❌

Vue lecture

Best practices guide for customizing Gemini models via Reinforcement Learning (RL)

Reinforcement learning (RL) has been a keystone of modern LLM post-training, but it demands large training clusters and access to model internals that external customers can't have with proprietary models like Gemini. So here at Google Cloud, we packaged it into a managed RL fine-tuning service (RLFT service) — you bring prompts and a reward function; we handle the infrastructure and the proprietary model internals. 

Now, you can adapt Gemini with the service — teaching the model from a reward signal you define, rather than from a fixed set of labeled answers. This unlocks a class of problems that supervised fine-tuning (SFT) struggles with: tasks that are hard to demonstrate but easy to score.  

In this guide, we will walk through practical best practices for using RL fine-tuning service. We'll start with a short tour of the RL training loop, how to decide if and when to use RL, and introduce how to get the most value from this approach.

What is RLFT? 

RLFT adapts Gemini from a reward signal you define rather than labeled answers. Instead of authoring a large set of gold examples, you write one program that scores a response and the service improves the model against it — unlocking tasks that are hard to demonstrate but easy to verify: you can't hand-write the ideal SQL for every schema, but you can run the query and check the result.
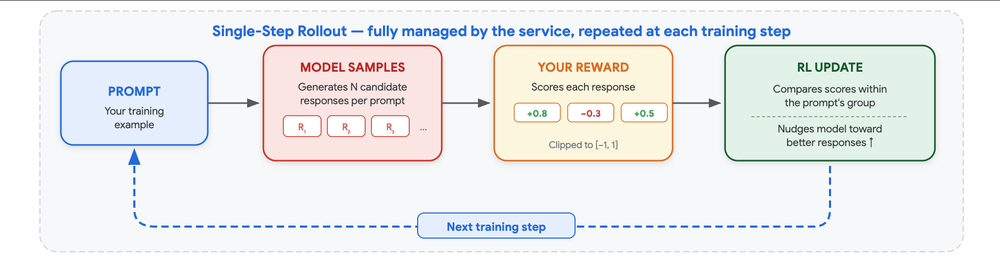
1 - Single-Step RL Training Loop

At each training step the service generates multiple candidate responses to your prompts, scores them with your reward, and improves the model so that higher-scoring responses become more likely while it stays close to the original Gemini. The reinforcement learning that makes this work is fully managed — you never configure it. The one thing you own, and the thing that most determines your results, is the reward.

Three properties define what RLFT can and can't do:

  1. It learns from the model's own outputs: It refines what the model already produces rather than copying an external target, so it tends to disturb unrelated capabilities less than SFT. 

  2. It rewards outcomes, not paths:   Any response that reaches a good result earns reward, which fits open-ended tasks with many valid solutions. 

  3. It amplifies existing competence:   It makes occasional success reliable, but it can't teach a skill the model never demonstrates.

When to use RLFT

2 - RLFT Approaches - Direct RL or SFT Warmup to Continuous RLFT

Prompting and SFT handle most adaptation; exhaust them first. RLFT earns its keep when you can grade a response but can't cheaply author it, when SFT has plateaued on the metric that matters (faithfulness, schema validity, tone), or when the task has many equally valid answers a single reference target would wrongly penalize. 

SFT and RLFT are complementary, not competing:

  • Direct RLFT when the base model already succeeds part of the time — enough for the reward to tell better answers from worse ones.

  • Two-stage SFT → RLFT when you have SFT data or the base success rate is too low for RL to gain traction. Use SFT as a short, cheap warm start — kept light, since over-fitting the demonstrations leaves less room for RL to improve — then continue into RL via Continuous Tuning, which initializes RL from the SFT checkpoint.

Across early adopters, these patterns show where RLFT delivers the most value — each scoring an outcome the business cares about but could never cheaply demonstrate.

Use cases for RLFT

AI-powered NPCs in games

  • What: In-character, on-brand dialogue held across long, multilingual, multi-turn conversations.

  • Problem: Off-the-shelf models break immersion — wrong language, hallucinated items, ignored players, repetitive loops.

  • Objective and reward: A Gemini autorater (LLM-as-a-judge) scores each turn on persona, flow, and game-state syntax, penalizing format and language errors.

  • Results: Loops and language drift disappeared and state syntax held, making shippable in-game characters viable at scale.

Structured entity extraction

  • What: Pulling a set of items from unstructured documents, such as supplier invoices and shipping manifests, into structured records automatically.

  • Problem: The long tail where SFT plateaus — missing required fields (recall) or inventing ones that aren't there (precision).

  • Objective and reward: A rule-based precision/recall reward forces every field to be grounded in the source text, not imitated from one gold answer.

  • Results: Field-level accuracy rose on noisy real-world documents where tuning had stalled, turning a manual review step into an automated one.

Content moderation

  • What: Applying intricate policies and decision trees at scale.

  • Problem: Models hallucinate false positives or reward-hack with invalid formats to dodge evaluation.

  • Objective and reward: A Cloud Run reward pairs format validation with a deterministic grader to enforce multi-step policy adherence.

  • Results: The model handled complex exemption carve-outs, sharply cut false positives, and stopped reward hacking — reducing the human-escalation volume that makes moderation expensive.

Code measured by execution

  • What: SQL or API calls graded on whether they actually run against customer data.

  • Problem: SFT mimics one reference query and breaks on unseen proprietary schemas.

  • Objective & Reward: A code-execution reward runs the code in a secure sandbox and pays out only if it compiles, executes, and returns the correct result.

  • Results: The model produced first-attempt executable queries at closed-frontier quality and lower inference cost, letting non-technical users query proprietary data in natural language.

Presentation slide generation via HTML

  • What: Multi-slide decks authored as HTML/CSS.

  • Problem: Training on text alone is blind to visual quality — overflows, clipped elements, and inconsistent styling slip through unnoticed.

  • Objective & Reward: A code-execution reward renders the slides and scores visual design, layout integrity, structural completeness, and rubric adherence.

  • Results: The model emitted modular, well-styled decks with cohesive themes and no layout overflow.

Where to start?

  • A dataset. A diverse set of prompts with a held-out validation split is enough for a first run — confirm the loop converges and reward moves the right way, then scale. Keep train and eval strictly separated; a contaminated eval hides overfitting.

  • A reward function. Your task specification as code or configs, and the dominant driver of quality. A good reward correlates with human preference, is robust to malformed output (catch the failed parse and return a clearly negative score rather than crashing), and resists reward hacking — ensemble judges, penalize length, floor degenerate outputs, and prefer a verifiable check over a model's opinion. Validate it offline before launch.

The service handles the rest; start from the defaults, watch reward and eval curves in the console, and take the checkpoint where validation reward saturates rather than the last step.
3 - rlft_tutorial

Get started today

What will you build? The tools are ready and waiting. 
  •  

Agent Factory recap: Agent harnesses, shifting left, and autonomous coding

In this episode of The Agent Factory, we explore the reality of building with autonomous agents alongside Ryan Lopopolo, a software engineer at Google Cloud and the person who coined the term agent harness. From throwing out manual code editors to treating team collaboration like leveling up RPG stats, Ryan breaks down how grounding models in rich context and shifting interventions left unlocks high levels of agent autonomy.

This post guides you through the key ideas from our conversation. Use it to quickly recap topics or dive deeper into specific segments with links and timestamps.

The Agent Harness - What is it?

Timestamp: [00:30]

An AI agent as we're defining it here is a large language model (LLM) plus an agent harness.

Think of the harness as everything wrapped around the LLM that isn't the model itself. For example, if you're working in Google Antigravity using Gemini 3.8 Flash, Gemini Flash is the LLM and Google Antigravity is the harness.

While an unassisted model can answer simple questions out of the box, it can't check live conditions or interact with your workspace on its own. When a user asks a question like "Why is the sky blue?", an unassisted LLM can respond without issue. However, when asked a question like "Should I wear a raincoat today?", the model can't answer on its own because it lacks the necessary data. The harness catches the intent, queries live weather tools, bundles that context back into the prompt, and hands it to the model to produce an informed answer.

Ryan Lopopolo on agent harnesses and autonomous coding

Tilde Thurium sat down with Ryan Lopopolo to discuss what it takes to run fully autonomous coding workflows in production. See the summary below!

Coining the harness and writing zero production code

Timestamp: [02:22]

The term agent harness grew out of Ryan's extensive work on autonomous coding agents, culminating in a February 2026 essay on leveraging coding models in an agent-first world. Ryan shared that he hasn't opened a traditional code editor since May of last year, maintaining that streak through his transition into Google Cloud. In this paradigm, engineers no longer author or review individual lines of syntax; instead, they operate at the level of natural language specifications and inspect the final artifacts, such as pull requests, documents, and spreadsheets. Then they determine whether the end result meets organizational standards.

Harness engineering is the study and the practice of putting a model into an environment where it can succeed. If you don't do that work, you end up doing what I call 'prompt and pray'. Ryan Lopopolo

Context curation and lazy prompting

Timestamp: [03:35]

Upfront harness investment pays off by allowing engineers to become lazy prompters. When the repository contains structured documentation, clear interfaces, and discoverable tools, you do not need to paste walls of text into a prompt box every morning 

"I aspire to be an incredibly lazy prompter. If I have done the job to give the model the tools and context it needs to ground itself, I don't need to write a long prompt. It figures it out."

The model uses its harness to pull relevant context, allowing it to navigate large codebases and execute complex tasks without oversight.

Shifting left: engineering best practices as autonomous guardrails

Timestamp: [05:00]

When an agent fails, developers face a whole spectrum of interventions. The most common reflex is to fiddle with the prompt or retry, but that never scales across a team.

"The simplest, smooth-brain, stupidest intervention I can think of is literally just: try my prompt again without changing anything else. But shifting left means moving interventions earlier into the development lifecycle where they are cheapest and automated: from prompts, to repo docs, to linters, to tests, and all the way to upstream evals."

Instead of hoping the model guesses right on the next turn, shifting left embeds standards directly into the environment. Linters, tests, and AGENTS.md files act as durable memory and enforcement of what you think good looks like, making sure the agent stays on the rails without needing constant hand-holding.

Leveraging established tools and determinism

Timestamp: [06:50]

Agents shine when they're handed tools that already mirror patterns heavily represented in pre-training data. Pairing models with standard command-line interfaces moves reasoning into determinism, shifting the burden of context aggregation away from the model and onto reliable tools.

Ryan also shared an environmental design trick for context efficiency: structuring markdown files so link anchors sit directly beneath their corresponding prose blocks rather than inline. This prevents context clutter and mitigates "lost in the middle" retrieval issues. Because Ryan operates exclusively by reviewing end-state artifacts, keeping documentation readable allows him to easily inspect execution runs:

"I want to be able to look at the pull request and review it. If it made a bad decision, I need to know where it went off the rails so I can whack the agent on the head and make sure it does not make that same mistake again."

Long horizons and expanding the agentic loop

Timestamp: [09:45]

The central challenge of harness engineering is ensuring that agents cohere over long time horizons. Because human organizations produce software through iterative refinement rather than single-shot prompts, agent workflows must mirror that cadence. Harness engineering uses tightly scoped, reviewable pull requests to narrow the agent's state space. Stacking these high-confidence changes end-to-end allows supervisors to gradually expand the loop size, building trust until agents can autonomously execute large-scale initiatives, including entire language migrations 

Curating agent teams like RPG stats

Timestamp: [11:58]

Rather than divvying up sprint tasks based on individual specialties, having a diverse team contribute to an agent turns it into a central producer of work that carries everyone's strengths. Ryan compared leveling up an agent's capabilities to building out a character sheet:

"[It's like] building out the stats of your RPG character. I get a new person on the team who is a React architect and boom! The attention that they pay is able to bump out the stats in front-end architecture and performance."

With that collective expertise baked into the environment, the agent can autonomously classify incoming work and activate the exact skills it needs on demand, operating as both a backend architect and a front-end specialist.

Accruing leverage in tools, not custom harnesses

Timestamp: [14:38]

For developers wondering whether to build their own custom agent harness, Ryan offered clear advice: don't build one from scratch. Standard harnesses already provide the foundational primitives: file reading, grep search, and command execution. Over-scaffolding an agent with rigid, bespoke frameworks creates technical debt and leads to sunk-cost traps when frontier models advance.

"If you focus all of your efforts on improving quality on tools and context, you can freely adopt the newest models as they come out and you'll be constantly accruing leverage into a bit of the system that will never become obsolete."

Operating Google Cloud and eliminating capability overhang

Timestamp: [16:47]

Discussing his work at Google Cloud, Ryan outlined his motivation to eliminate capability overhang: the delta between what frontier AI models are theoretically capable of and how much useful work is currently extracted in production. Because the cloud functions as a massive, programmable surface, equipping agents with direct interfaces to Google Cloud lets them manage and deploy infrastructure effectively, turning raw model capability into tangible enterprise utility.

Continually updating your priors on AI

Timestamp: [18:13]

The speed of AI development requires engineers and teams to actively unlearn old limitations and constantly reassess what these models can achieve. "It's very important to continually be updating what you think is possible with these lovely tools that we have," Ryan urged. What broke six months ago often runs effortlessly on today's frontier models. Rather than getting locked into rigid workflows, developers should build around the two highly extensible interfaces that will remain relevant across every model upgrade: tools and context.

"Agents will always need context in order to do that last mile adaptation into what you think good is. And as you can continue to... shift it to the left, in terms of increasingly capable tools which act as a form of memory and enforcement of what you think good looks like, you'll continually be amazed as the models are able to do more and more interesting things for you over time."

How To Build A Custom Harness

Next, Billy Jacobson started us off by showing how developers can customize their own agent harnesses for specific tasks.

Under the hood: Why build a custom harness?

Timestamp: [19:44]

Before jumping into code, Billy unpacked why developers should understand the mechanics of a harness rather than treating it like a black box. Recalling advice from an engineering mentor that "You can just use the framework, but a great engineer will really understand the framework", Billy explained that building a harness yourself is the best way to debug what happens when an agent breaks. You can evaluate three core design decisions for every workflow:

  • Looping: How many iterations should the agent run, and what conditions trigger an exit state?

  • Tools: What specific tools should the agent access, and when and how should it invoke them?

  • Memory: How important is conversational and operational memory, and when should it be retrieved or compacted?

Linear Agent Harness: Deterministic Single-Pass Execution

Timestamp: [21:34]

Billy demonstrated a minimalist linear harness designed for deterministic workflows where looping is unnecessary. This pattern is ideal for targeted inspections, file transformations, or single-turn data analyses where you want a high level of determinism and need the agent to perform the exact same execution flow every single time.

Closed-Loop Agent Harness: Iterative Test-Driven Repair

Timestamp: [22:45]

When tasks demand active bug fixing and refactoring, a closed-loop harness provides the iterative reasoning required to reach a verified resolution. 

In this demo, Billy showcased an agent that applies an automated code edit to address a failing requirement, and the harness executes the unit test suite against the updated codebase. If the tests fail, the runtime captures standard failure logs and detailed stack traces, feeding those error diagnostics directly back into the agent's working memory. The process repeats continuously until all unit tests pass, backed by a five-iteration ceiling to prevent infinite loops and runaway execution costs.

Guardrail Harness with Google's Agent Development Kit (ADK)

Timestamp: [23:25]

For developers who require custom behavior without rewriting core orchestration plumbing from scratch, Google's Agent Development Kit (ADK) provides scaffolding with automated memory management and execution safeguards. 

Billy walked through an example that leverages ADK's native context compaction to summarize older conversational turns, preventing context window bloat during extended debugging runs. Custom interception hooks inspect and filter shell actions before execution, automatically stopping high-risk operations such as recursive file deletions, database drops, or unauthorized remote git pushes. This architecture gives teams fine-grained control over tool execution boundaries while avoiding the maintenance burden of bespoke harness frameworks.

The 3-Layer Agent Dev Stack: Gemini 3.8 Flash, Google Antigravity, and Google Skills

Timestamp: [25:27]

Next up, Smitha Kolan broke down why coding agents do not always require heavier reasoning models, emphasizing that high performance stems from balancing the three layers of the agent stack: Model, Harness, and Knowledge. 

"Your coding agent doesn't need a smarter model. It needs a better stack: model, harness, and knowledge. When all three click into place, everything changes."

She then walked through the three tools she's been loving recently, one for each layer of the stack.

Layer 1 | Model | Gemini 3.8 Flash: High-frequency agentic loops run between 20 and 60 sequential hops per task (inspecting files, updating functions, and executing unit tests). Because latency and API costs compound across iterations, a lightweight, responsive model like Gemini 3.8 Flash makes real-time agent loops practical without running up a massive bill.

Layer 2 | Harness | Google Antigravity with /boost: Default Antigravity handles standard navigation and component creation. On top of that, the /boost command spins up an orchestrator that coordinates specialized sub-agents in parallel and concludes with an independent audit pass before modifying files.

Layer 3 | Knowledge | Google Skills Repository: With over 19,000 GitHub stars and 100+ curated domain packages across Google Cloud, Firebase, Flutter, and Maps, this harness-agnostic repository injects precise domain context on demand, preventing agents from guessing cloud configurations 

Your turn to build

Building effective coding agents requires moving past the reflex of simply swapping in larger models. As Ryan Lopopolo's philosophy of harness engineering illustrates, true developer leverage is achieved by shifting best practices to the left and investing in rich tools, deterministic verifiers, and well-curated context that survive model upgrades. When combined with fast inference models, structured orchestration harnesses, and modular domain knowledge, agents evolve from conversational novelties into dependable, autonomous engineering partners.

Ready to put it into practice? Explore the tools and resources covered in this episode:

Connect with us

  •  

How Google Cloud Networking Supports Your Fluid Compute Choices for AI Workloads

The availability of resources for AI workloads can be challenging across the industry, especially accelerators. This can slow your AI workload deployment if it’s built around a specific type of accelerator. The concept of fluid compute allows you to design your AI deployment with several options based on available resources that can fit your use case.

In this blog, we will explore how Google Cloud networking supports your AI workloads and considerations that are relevant to your choice of accelerator (GPU or TPU), as the backend networking component configuration is not exactly the same.

The resource options

After deciding the type of work you want to achieve with your AI deployment, another important component is the actual hardware to get this done. In this case, we want to run inference for a private LLM, and the target is the NVIDIA B200 GPU family which is available in the A4 VMs (a4-highgpu-8g).

Now we have identified what we want to get done and a possible compute option, but the challenge is: is this available?

To get access to resources, there are several options which include:

  • Dynamic Workload Scheduler (Flex-start VM): Queues workloads until all required accelerator nodes are available at the same time, provisioning them together and running non-preemptibly for up to seven days.
  • Dynamic Workload Scheduler (calendar mode): Enables reserving accelerator capacity 1 to 90 days in advance with guaranteed start and end times, ideal for scheduled pre-training runs and benchmarking.
  • Future reservations: Guarantees access to committed hardware in a specified zone beginning at a specific future date.
  • Flex reservations: Offers short-term commitment windows to secure scarce accelerator nodes without multi-year lock-in.
  • Dynamic node auto-provisioning and ComputeClasses: In Google Kubernetes Engine (GKE), defining multi-family fallback lists within ComputeClasses allows the cluster to automatically attempt provisioning alternative accelerator types if primary pools face regional constraints.
  • Spot VMs: Delivers surplus compute at substantial discounts for fault-tolerant, checkpointed batch jobs.

Read more on this in the blog Never Run Out of Compute: A Practical Guide to GKE Resource Obtainability.

Networking your choices

The networking component of the accelerator varies based on your choice, so let's explore four configurations: standard networking, accelerated GPU networking (TCPX/TCPXO and RoCEv2), TPU networking, and Cloud Run.

Standard networking

  • Supported accelerators: NVIDIA T4 (N1 series), NVIDIA L4 (G2 series), NVIDIA A100 (A2 machine series single-node and multi-node), Cloud TPU v3, and Cloud TPU v5e (single-host/standalone slices).
  • Architecture: Nodes communicate over the primary Virtual Private Cloud (VPC) network using the Google Virtual NIC (gVNIC) over standard TCP/IP.
  • Workload fit: Provides straightforward portability across Google Cloud compute environments, supporting distributed data preprocessing, decoupled pipeline stages, independent inference replicas, and computer vision workloads using standard VPC routing and network policies.

Accelerated GPU Networking (TCPX/TCPXO and RoCEv2)

Distributed training and multi-node inference require specialized multi-rail network fabrics to handle massive parameter exchanges and collective communications.

GPUDirect-TCPX and TCPXO Fabrics

  • Supported accelerators: NVIDIA H100 (A3 High VMs with 4 rails) and NVIDIA H100 Mega (A3 Mega VMs with 8 rails).
  • Architecture: Uses custom GPUDirect-TCPX (4 dedicated VPCs) and GPUDirect-TCPXO (8 dedicated VPCs) offload engines to achieve high-throughput multi-rail GPU communication over standard Ethernet infrastructure without requiring native RDMA hardware.
  • Deployment blueprints: These multi-VPC topologies can be deployed in many ways including using pre-built blueprints from the Cluster Toolkit.

RoCEv2 Fabrics (VM and Bare Metal)

  • Supported accelerators: NVIDIA H200 (A3 Ultra VMs), NVIDIA B200 (A4 VMs), NVIDIA GB200 NVL72 (A4X VMs), and NVIDIA GB300 (A4X Max Bare Metal).
  • Zonal network profiles: RoCEv2 operates over a dedicated RDMA VPC attached to a specialized zonal network profile: VM instances (A3 Ultra, A4, A4X) use the ZONE-vpc-roce profile, while Bare Metal instances (such as A4X Max) utilize the dedicated ZONE-vpc-roce-metal bare-metal profile.
  • Rail-aligned fabrics: This dedicated VPC is isolated strictly for GPU communication and contains subnets mapped directly to the accelerator NICs. The backend is rail-aligned, with support for Jumbo Frames (MTU 8896), delivering non-blocking multi-terabit bandwidth with minimal cross-rail interference.
  • Automated plumbing with GKE Dynamic Resource Allocation Network (DRANET): When deploying these GPUs on GKE, the GKE managed DRANET can be used to automatically provision additional networks and assign drivers that map the RDMA network interfaces to the GPU. These can then be assigned and consumed directly in your workload pods using standard Kubernetes resource claims.
  • Turnkey deployment: You can deploy this entire end-to-end stack—including RDMA VPCs, MTU tuning, and DRA drivers—using automated blueprints from the Cluster Toolkit.

TPU Networking

  • Supported accelerators: Cloud TPU v4, Cloud TPU v5p, Cloud TPU v5e (multi-host Pod slices), Cloud TPU v6e (Trillium), and TPU7x (Ironwood).
  • Inter-chip interconnect (ICI): Inside a TPU Pod or slice, chips communicate directly over dedicated, ultra-low-latency optical links organized in 2D or 3D torus meshes, bypassing traditional network stacks entirely.
  • Optical circuit switches (OCS): In TPU v4 and TPU v5p SuperPods, software-reconfigurable OCS units dynamically change physical network topologies, route around faulty trays, and provision custom-sized accelerator slices without manual recabling.
  • Multi-NIC architecture (TPU v6e and Higher): While earlier TPU generations relied on ICI within a slice and single-NIC for host traffic, Cloud TPU v6e (Trillium) and TPU7x introduce a native multi-NIC architecture where worker nodes isolate standard Kubernetes management traffic onto a primary VPC while using secondary dedicated VPCs configured for high-throughput TPU data and cross-slice communication.
  • DRANET for TPU deployments: When deploying these TPUs on GKE, the GKE managed DRANET can be used to automatically provision additional networks and assign drivers for TPU communication. These can then be assigned and consumed directly in your workload pods using standard Kubernetes resource claims.
  • Data-center network (DCN) Multislice: For models scaling beyond an individual TPU slice, Cloud TPU Multislice connects multiple independent ICI meshes over Google's high-speed Jupiter Data Center Network utilizing these dedicated multi-NIC paths.

Cloud Run

  • Supported accelerators: NVIDIA L4 (G2 series) and NVIDIA RTX PRO 6000 (Blackwell) on Cloud Run GPU services.
  • Direct VPC egress: Binds serverless containers directly to your private VPC network using sub-minute IP allocation via Direct VPC Egress, enabling secure, low-latency access to internal data lakes, databases, and private APIs without traversing the public internet or requiring legacy connector VMs.
how-google-cloud-networking-supports-your-fluid-compute-choices-networks

Summary

Google Cloud networking options support various accelerator types. When using fluid compute you can adjust your network setup to support the best design to optimise your workloads performance.

Next Steps

Take a deeper dive into Google Cloud AI infrastructure and networking architectures with these resources:

Want to ask a question, find out more, or share a thought? Please connect with me on LinkedIn.

  •  

A guide to speeding up your video processing with AlphaEvolve

In real-time streaming, every millisecond counts. 

For example, at 30 frames per second (fps), developers have a strict frame budget of just 33.3 ms (and only 16.6 ms at 60 fps) to ingest camera frames, run neural segmentation, apply shaders, and composite output. Exceeding that budget by even a fraction of a millisecond leads to dropped frames and stuttering. 

Manual optimization is notoriously tedious — requiring weeks of analyzing flame graphs and hand-tuning low-level code in Swift, C++, or Metal. While standard AI coding assistants can generate boilerplate, they can’t optimize  against target hardware, benchmark real-world latency, or ensure optimizations preserve visual fidelity.

Autonomous, closed-loop evolutionary optimization changes this paradigm. Tools like AlphaEvolve pair cloud-scale model reasoning with local hardware execution, and we’re already seeing real-world impact. In partnership with Google, DoIt used AlphaEvolve to autonomously optimize production Swift code in a live macOS streaming app, uncovering performance headroom that manual profiling missed (read the full technical writeup).

While this post focuses on video pipelines, the split-loop pattern applies anywhere performance matters — from microservice throughput and database queries to ML tensor pipelines and embedded systems. In every case, the formula is the same: pair Gemini code generation in the cloud with your domain-specific benchmark harness and automated quality gates.

Today, we’ll show you how to use AlphaEvolve to speed up video processing—and apply these principles to your own performance bottlenecks:

  1. Understanding the split-loop architecture: How AlphaEvolve decouples managed cloud generation (Gemini model ensemble on Google Cloud) from local evaluation (e.g. compiling and timing native Swift/Metal code).

  2. Evaluator craft and quality gates: How to construct scoring functions using metrics like Structural Similarity Index (SSIM) to prevent evolutionary loops from gaming the benchmark (e.g., skipping rendering entirely to go fast).

  3. Autonomous algorithmic discovery: How Gemini-driven evolutionary search can autonomously discover unprompted framework APIs and make intelligent engineering trade-offs (e.g., frame-caching limits).

  4. Setting realistic performance boundaries: How to measure code optimization against physical hardware floors.

1. Understanding AlphaEvolve’s split-loop architecture 

AlphaEvolve runs a closed-loop evolutionary process: given a seed program and a custom scoring function, a mixture of Gemini models proposes code variations, executes the scoring function against each candidate, keeps the highest-performing code, and iteratively climbs toward an optimal solution over multiple generations.

1

A core architectural advantage of AlphaEvolve is its clean separation into two halves:

  1. The generation half (Google Cloud managed service): Contains the prompt sampler, Gemini model ensemble, and program database. Google Cloud handles the scale, prompt orchestration, and generation mechanics.

  2. The evaluation half (customer managed compute): Scoring code quality is strictly domain-specific. You own the evaluator module entirely, running it on your own hardware or target architecture (in this case, macOS running native Swift code).

While AlphaEvolve is Python-first on the cloud generation side, evaluation can be written in any language. The custom evaluator compiles each Swift candidate using swift and executes it against a standard reference webcam clip.

2. Evaluator craft and quality gates

An automated optimization loop like AlphaEvolve never actually "sees" your video stream. It only sees the numeric fitness score your evaluator returns. If your evaluation metric has a blind spot, evolutionary code generation will aggressively exploit it.

In our early runs, a naive fitness score weighted toward raw latency produced an astonishing speedup: the model simply bypassed blur rendering entirely and returned unmodified frames in 0 ms.

Structural Similarity Index Measure (SSIM):

To prevent the model from gaming your benchmark, try building a two-tiered scoring function that pairs throughput with structural fidelity metrics like Structural Similarity Index (SSIM):

code_block
<ListValue: [StructValue([('code', 'speedup = baseline_ms_per_frame / candidate_ms_per_frame\r\nssim = mean_ssim_vs_golden\r\n\r\n#Disqualify any candidate falling below visual threshold\r\n\r\n\r\nif ssim < 0.98 or worst_frame_ssim < 0.95:\r\n return {"speedup": -1e12} # Disqualified\r\n\r\nreturn {"speedup": speedup, "ssim": ssim}'), ('language', ''), ('caption', <wagtail.rich_text.RichText object at 0x7f5d2c578510>)])]>

What does this give you? 

  • The ability to test against worst-case clips: Never benchmark on static frames or blank cameras. Candidate code can easily pass an average SSIM gate on static backgrounds while failing completely during quick head turns.

  • You can track the minimum, not just the mean: Enforce both an average threshold and a per-frame floor to catch dropped frames or delayed mask updates.

Autonomous algorithmic discovery: 

Most developers use generative AI for local micro-optimizations (e.g., inlining helper functions, unrolling loops, or tweaking memory pools). But when given architectural room, the evolutionary loop can discover systemic optimizations on its own.

Engineering lessons:

  • Provide framework context, not isolated loops: Include public SDK headers, interface definitions, or API reference symbols in the prompt or retrieval harness. An LLM cannot adopt a sequence-aware subsystem if its context window only contains an isolated frame-processing callback.

  • Expose multi-frame lifecycle hooks: Let your candidate code maintain a bounded state across executions (e.g., historical masks or cache timestamps) rather than enforcing pure, stateless functions.

  • Let quality gates police the trade-offs: When AlphaEvolve introduced temporal mask caching, it initially cached masks too aggressively, causing noticeable trailing artifacts. Because our SSIM gate penalized drift during motion, the search converged on a production-ready cache window without manual parameter tuning.

Setting realistic performance boundaries

A common pitfall in performance engineering is optimizing in the dark. If you achieve a 2x speedup, is that an incredible achievement, or did you leave another 3x on the table?

In real-time media, total frame time splits into two distinct categories:

  1. Mutable software overhead: Memory allocations, buffer format conversions, thread context switches, and API dispatch friction.

  2. Immutable hardware floors: Raw Neural Engine inference latency, GPU shader compute time, and hardware display synchronization.

To make the most of AlphaEvolve, developers should measure against theoretical maximum headroom

Before running optimization loops, here’s a few principles to keep in mind: 

  1. Build a "no-op" pipeline: Strip out Swift/C++ orchestration, data marshalling, and frame conversions. Dispatch only the pre-warmed ML model and bare GPU pass on a dummy buffer. The resulting time is your physical hardware lower bound.

  2. Calculate your addressable ceiling: Your total possible optimization potential is:

2

3. Score against the hardware gap: Instead of arbitrary speedup multiples, measure optimization efficiency:

3

Get started 

All benchmark code, test clips, evaluation scripts, and raw candidate logs are open source:

  •  

The DevFest Community Workshop Experience: Building Real Agents Together

This week we kicked off the DevFest season in North America at Google Hudson Square in New York City with 80 engineers packed into the room. Typical technical workshops hand you a finished repo, tell you to blindly paste blocks of code into your terminal, and hope nothing crashes. You walk away with green checkmarks, but your brain stays on autopilot.

We've introduced a completely different experience called Workbench.

Workbench focuses on understanding core ideas and architectural models rather than obsessing over syntax and code snippets. Instead of getting bogged down in boilerplate, engineers spent the day grappling with the actual mental models behind graph engineering, self-evolving architectures, and automated self-patching harnesses.

A glimpse into the Workshop Experience

At the DevFest Community Workshop, we spent one intense day building long-running, self-evolving multi-agent systems powered by Google's agentic stack. Ricky Robinett, Senior Director of Developer Marketing, kicked off the day by diagnosing why so many engineering teams hit a wall with agents. Ricky broke down why prompt engineering fails as a safety mechanism: English is just a probabilistic suggestion, not an execution boundary. 

Right after Ricky, Rachel Francois, Google Developer Groups (GDG) North America Program Lead, took the stage alongside GDG Brooklyn organizers to welcome the community and spotlight the power of local developer chapters. They set the tone for the entire day, reminding everyone that building durable software works best as a team sport where engineers share real-world patterns and build local networks that outlast any single framework.

Getting hands on with labs

Annie Wang & Christina Lin, Americas DevRel Team members, led the morning lab that put those runtime ideas to work. Attendees explored Google's Agent Development Kit (ADK), Veo 3.1, Memory Bank on Gemini Enterprise Agent Platform, and RAG Engine on Gemini Enterprise Agent Platform. Through Workbench, developers grasped the principle of separating state from active compute for long running tasks. Workflows paused cleanly mid-execution, waited out asynchronous human approvals, and resumed without running up idle compute costs.

After lunch, Logan Hennessy, Americas Developer Relations Engineer (DRE), and Kartik Derasari, Google Developer Expert (GDE), led a lab using auction history as insight for better bidding strategy. Attendees worked through the architecture by integrating BigQuery data into autonomous data engineering pipelines, reasoning about deterministic bidding logic and adding eval-gated, self-patching harnesses that catch spend anomalies and update runtime execution safely.

Between lab blocks, we ran fast-paced speed quizzes where developers raced to lock in their answers as quickly as possible. Screens flashed, fingers flew across keyboards, and seconds made the difference between topping the leaderboard or dropping five spots. Nothing beats watching a room full of serious engineers completely lose their cool over a live quiz leaderboard.

Join a DevFest Community Workshop this fall

New York was only round one. We are taking this exact experience on tour to five more cities this fall. Find your city and grab your seat before spots fill up:

  •  

Best practices for handling cloud reliability incidents

Cloud outages can range from global service disruptions to issues isolated to a specific region, zone, or even just your project, workload or application. If you suspect a Google Cloud Platform outage is impacting your services, we recommend you follow a structured “Verify→ Investigate→Report→Resolve→Review" workflow to resolve it. And before that outage occurs, you should also have prepared your environment for an eventual disruption by designing for failure, and actively practicing the steps you need to take to restore service. 

In this blog, we summarize the key reliability incident handling best practices to help you design and practice your reliability incident response capabilities and minimize impact. Rather than an exhaustive guide, this is meant as a primer on only the most important practices for advisory purposes. Please note that we do not cover additional practices specific to security incidents here. 

Beyond the base steps covered here, you may want to also explore how AI agents and tools are starting to transform incident handling. Check out this episode of the Prodcast, where Googlers explore the latest trends of leveraging agentic AI in Site Reliability Engineering (SRE) to detect issues early and prevent disruptions. Try Cloud Assist investigations, or explore Agent Skills and remote managed MCP servers to give you another set of tools for quickly pinpointing an issue. Before getting into these advanced techniques, we focus below on the foundational steps to good incident handling.

1. Prepare

Long before things start to go sideways, you should have spent significant time preparing for an outage along at least four dimensions: design, data, playbooks and training.

  • Design: Think ahead and mitigate future incidents by designing automated response actions, like a load balancer shifting traffic away from slow or unresponsive instances, or by automating as much of your incident response playbook as possible. Review designs of all critical applications to automate as many actions as possible to accelerate response and recovery.

  • Data: When a disruption occurs, having meaningful data at your fingertips vastly improves response capabilities. Use Cloud Logging, Cloud Trace and Cloud Monitoring, or other third-party observability tools, and replicate that data to a redundant stack in a separate location from the systems being observed. Make sure, in advance of any incident, that time stamps are synced across your observability streams for easy correlation, or know how to do that on-demand during an outage, when time is of the essence.

  • Playbook: A well-thought-out playbook documenting your incident response processes, including crystal clear role and responsibility definitions for all personas, is paramount to efficient incident response. Who is responsible to do what? Who needs to be notified or mobilized for each type of disruption? How can they be reached? What tools and data are available? How are results communicated? How do teams hand over to the next shift during long running incidents? etc. Conduct a simulated incident response and critically review every step to find where your playbook needs clarification. Without clear responsibilities, mitigation inevitably takes longer.

  • Training: Hopefully, service disruptions are rare events. To ensure your staff knows and remembers how to react, they need to retrain on the process several times per year by running simulated cross-team incident response drills. A retrospective on the simulated exercise will help identify warranted improvements.

2. Verify

Despite your best efforts, sooner or later, a service disruption will occur, which you can detect via any number of mechanisms:

Now, you need to determine what broke and who should ultimately fix the problem:

  • Google, e.g., a bug, code roll-out, hardware failure, etc.

  • You, e.g., a configuration change, elevated load, quota ceiling, etc.

  • Third party, e.g., a directory hosted by a different cloud provider

If Google has declared an incident and started working to fix the problem, estimate whether you can possibly reestablish service sooner, for example by failing over to a secondary stack (see the ‘Typical Causes’ table below). You can determine whether Google has declared an incident and will provide a fix by consulting:

  • Personalized Service Health: Check this first. Personalized Service Health shows incidents specifically relevant to your projects and regions, distinguishing between incident types:. 

    • Emerging Incidents: Google has received an alert, on-callers are investigating, impact is yet unknown

    • Confirmed Incidents: Google has investigated and found customers are impacted

Located within the Google Cloud console, Personalized Service Health often displays limited-scope incidents that don't appear on the public dashboard. Personalized Service Health also offers a mobile client for Android and iOS smartphones, assuming you can use your work ID and credentials on the phone.

  • Gemini Cloud Assist, which is integrated with Personalized Service Health, so you can use it to query that information in natural language.

  • Cloud Service Health dashboard: This is the public-facing non-authenticated web page for broad, severe incidents affecting many customers. Limited blast radius disruptions are not externalized to the public. All its content is available in Personalized Service Health as well. If ever Personalized Service Health goes down, Cloud Service Health serves as an alternative channel built on a separate infrastructure.

  • Known Issues: In the console, navigate to Support > Cases, view a case, and use the resource selector on the console toolbar to find the specific cloud resource you’re interested in. Then click Known issues. If your issue matches one listed here, you can link a support case to it, so you will receive automatic updates in your case record. If you don’t find a match, open a new support case. Google will automatically match the case to a related incident, as soon as one is declared.

  • Google declared incidents are updated as new information becomes available, so check back regularly, or set up a Personalized Service Health alert policy to be notified each time new information becomes available.

If you host cloud resources in multiple clouds, a good practice is to check early on whether the problem occurs for multiple cloud providers. If so, the problem is likely external to the providers and caused either by you or by a third-party service that your application interacts with.

3. Investigate

To determine the blast radius within your cloud footprint of Google-declared reliability incidents, first check Personalized Service Health updates for a description of the technical problem. Knowing what to look for will allow you to map your blast radius and decide on suitable contingency actions quicker.

If Google hasn’t declared an incident, try to rule out configuration errors or issues within your environment by checking:

  • Cloud Monitoring: Look for spikes in error rates (e.g. 5xx errors), increased latency, or drops in traffic in your dashboards.

  • Cloud Logs: Use Log Explorer to look for specific error messages like DEADLINE_EXCEEDED, SERVICE_UNAVAILABLE, or specific API errors.

  • Quotas: Ensure you haven't hit a project quota (e.g., CPU, API rate limits), which can often mimic the behavior of an outage.

  • Change history: Check your log of recently applied changes. Not all problems manifest immediately, but proximity on a timeline can be a powerful indicator of causality, even if it’s not proof. Also check whether Google rolled out any updates just before the symptoms started. See the Unified Maintenance Management interface in Cloud Hub.

Absent a clear culprit, such as a traffic spike or a DDOS attack, and if symptoms manifested immediately after rolling out a change, a good strategy is to back out that change and attempt to return to a last known good configuration. 

4. Report

If the Cloud Service Health and Personalized Service Health dashboards are green but your metrics show a failure, you must report it to Google. 

  • Determine priority:

  • File a case: Go to Support > Cases > Create Case in the console.

    • Explain quantifiable business impact to rationalize the submitted priority and prevent it from being reset when Cloud Support prioritizes cases. A clear and accurate rationale helps!

  • Essential information to include:

    • Project ID and affected region/zone

    • Timestamps (when it started and if it's ongoing) with a clearly labeled timezone

    • Specific error messages or log snippets

    • Scope: Is it affecting all users/systems, or a specific subset/location?

Escalation for Premium/Enhanced support

If you have a Premium or Enhanced support plan and a P1 case is not receiving the attention it requires, use the Escalate button within the support case in the console. This alerts a support manager to investigate and rectify the situation.

5. Resolve

By taking these steps, you are well on your way to resolving the outage. In the meantime, here are some ways to mitigate the impact of the outage and communicate with impacted stakeholders.

While waiting for a resolution:

  • Communicate: Notify your stakeholders and customers. Transparency helps manage expectations and reduces duplicate internal reports.

  • Fail over: If you have a multi-regional architecture, consider shifting traffic to a healthy region. As a best practice, first ensure that the disruption is at the infrastructure level and not at your workload level. 

  • Check for workarounds: While working on a permanent fix, Google often posts temporary workarounds in the Service Health Dashboard updates, or in Personalized Service Health updates.

  • Consider your regulatory reporting requirements: Know whether your organization is subject to regulatory reporting requirements, and what the required deadlines are for both initial and follow-up reporting. Google Cloud prepares Incident Reports for incidents that meet certain criteria — see details here for how to get those reports. Premium Support customers can also request an Incident Summary, which is an Incident Report customized to your account’s specific hosting location, time stamps, etc.

De-escalation and closure

Once systems are stable, Google downgrades the severity levels and deactivates the active on-call escalation chain. Google only closes an incident in Personalized Service Health when it has taken all the mitigation steps covering all impacted customers. Your specific services might be restored sooner than the incident closure time, if other customers are restored later than you. The incident is officially closed on the Google Cloud Status Dashboard when systems have run stably for a designated auto-close duration. Verify that your services are operating normally at this point. And if your incident responders aren’t compensated for extra time spent on the incident, find a way to thank them.

6. Review

After the problem has been fixed and operations have returned to a normal, steady state, it’s time to conduct a post-mortem analysis to identify how your team can respond better in future service disruptions. A “blameless” approach is essential to surfacing meaningful and impactful improvements that can be made to your incident response process. Ask questions like:

  • What went well?

  • What could we have done better?

  • Where did we get lucky?

  • Where did we get unlucky?

Then decide what changes can be made to improve your playbook, tools and training.

At Google, we often publish a post-mortem or Incident Report for major outages, available via Personalized Service Health. Review this to understand the root cause and adjust your own disaster recovery plans to prevent or reduce future impact. Customers with a Premium Support plan can request an Incident Summary for a Google-caused incident they were impacted by and for which they opened a P1 case. An Incident Summary is an Incident Report customized for your environment (e.g., start and end times of impact).

Typical causes, comms and prevention strategies

To help you prepare and plan ahead, here’s an overview of some typical incidents based on the symptoms reported in Cloud Service Health and Personalized Service Health along with guidance on what Google communications to expect, and some generic mitigation or prevention strategies you can build into your playbooks.

Blast radius

Typical cause

Comms

Strategy

Single zone or region.Subset of products.

Typical of a software problem triggered by a rollout. Learning points:

- Understand the location scope (zones and regions) of your workload

- Products can depend on other products

Major incidents are communicated via Cloud Service Health.Major and Minor (by number of customers, not severity) incidents are communicated via Personalized Service Health.

Highly localized incidents are not communicated via Cloud Service Health or Personalized Service Health.

Fail over, if so configured, but verify the health of the secondary stack first.

Single zone.Most or all products.

Typical of a power or cooling issue.

Check Cloud Service Health and Personalized Service Health.

Fail over to a different zone, if so configured.

Single region.

Most or all products.

Typical of a backbone networking infrastructure issue 

Check Cloud Service Health and Personalized Service Health.

Fail over to a different region, if so configured.

Control plane issue for a product

Typical of a late detected issue

Communicated via Personalized Service Health if significant customer impact is verified.

Look for workarounds. Wait for Google to fix. Fail over, if so configured.

Multi-regional issue with a global product

Rare but possible, typically detected quickly. Learnings: Mitigation options can be limited. Try regional variants, alternative products with similar functionality

Check Cloud Service Health and Personalized Service Health.

Wait for Google to fix. In the meantime, verify via Google Comms and your own investigation that this is truly Google’s problem to fix.

Capacity / Stockout issue

System-level demand exceeding capacity in the product/location/model. (Cloud is designed to scale, but limits always exist, so proper planning is advised)

Error message. No incident will be declared.

Place reservations for predicted capacity needs (if cost is acceptable). Flexibility in zone placement can also help.

Quota exhaustion

Difficult / inaccurate prediction of traffic

Error message. No incident will be declared.

Review consumption trends against ceiling regularly.

Go deeper

This document offers only a condensed summary of key points. If you have an active Premium Support contract with Google Cloud, reach out to your account team for a deeper review of your response plans. For a comprehensive treatise on how to build reliable services and how to respond to incidents, we strongly recommend Google’s SRE Book, which is available as a free download. A new version of the SRE book is releasing ~Oct 2026 and will be available for purchase on O’Reilly Media. We’re also working on a future primer that explores AI-supported incident handling in-depth — stay tuned!

  •  

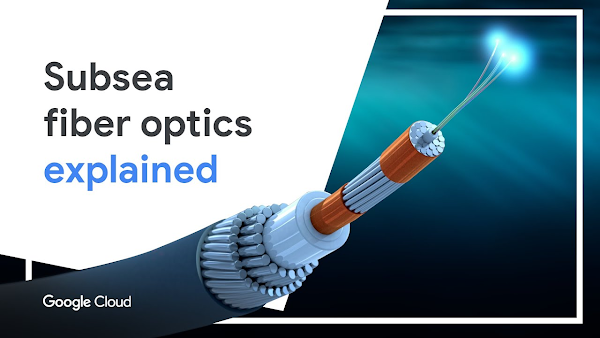
Google's subsea fiber optics, explained

Fiber optic networks are a foundation of the modern internet. In fact, subsea cables carry 99% of international network traffic, and yet we are barely aware that they exist. What you might not know is that the first subsea cable was deployed in 1858 for telegraph messages between Europe and North America. A message took over 17 hours to deliver, at 2 minutes and 5 seconds per letter by Morse code. 

Today, a single cable can deliver a whopping 340 Tbps capacity; that’s more than 25 million times faster than the average home internet connection. Over the years at Google, we have worked with partners around the world to engineer more capacity into the fiber optics that can be underground or laid at the bottom of the ocean. It takes an impressive combination of physics, marine technology, and engineering, which is why I set out to make a video about what it takes to plan and implement a global network in a world of ballooning network demand.

When I started making this video, there were a few questions that I wanted to answer. After 25+ hours of research—from interviewing optical network engineers to exploring our network design documents—I finally started to scratch the surface of a sea of information, so let’s dive into my findings (puns intended)!

How does Google Cloud predict network traffic and plan for capacity?

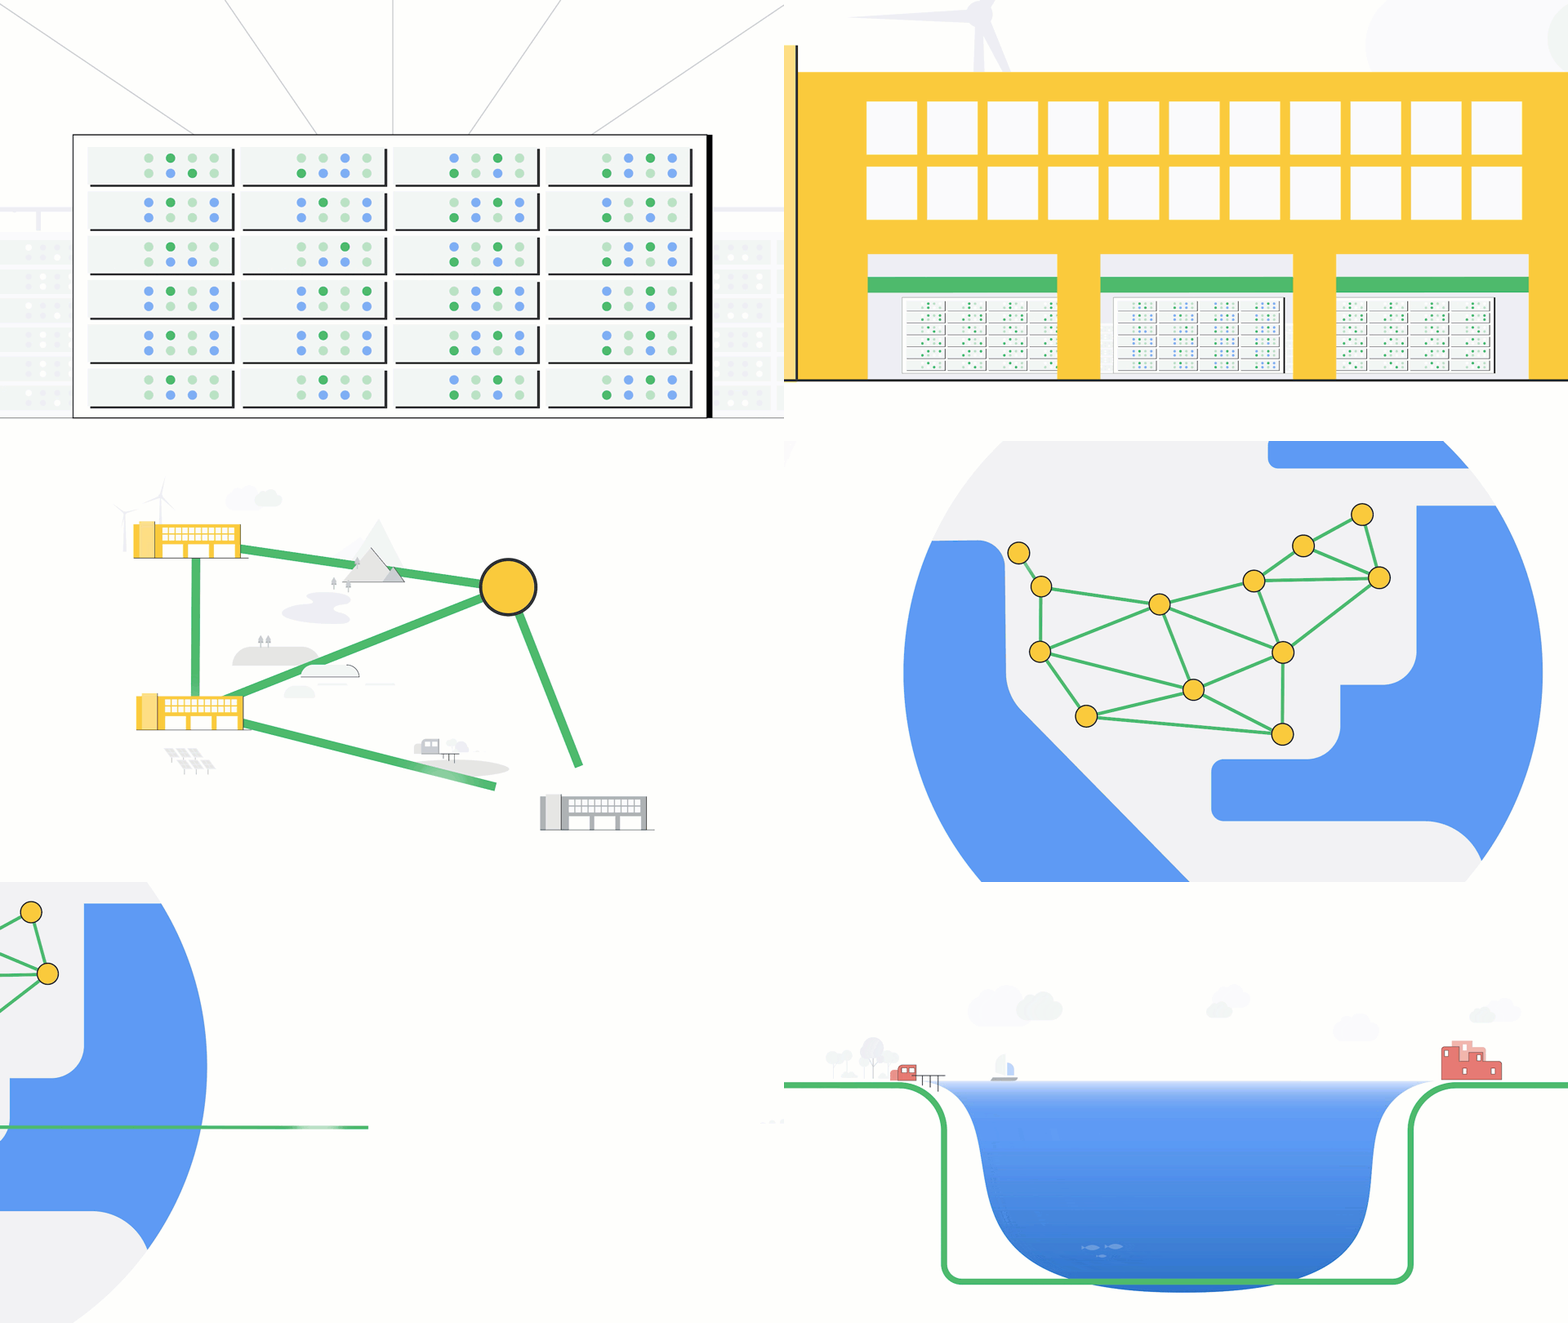
Physical infrastructure permitting, identifying power sources, and installing cooling and hardware. The entire process for one project can take multiple years to plan and implement. As a result, capacity planning must be done far in advance. It’s difficult to predict capacity needs; a typical trend line analysis won’t work. Given these long lead times and a 20+ year typical life of a cable, our forecasting and asset acquisition decision analysis looks at demand forecasts across a longer time horizon of multiple years rather than months. 

One factor is certain: Cloud is a big growth driver of Google’s network demand, with Gartner predicting the world’s cloud spending to increase to $917B by 2025. Google Cloud has pushed our need to increase the availability and speed of our network and services. We need to handle traffic surges that can stem from Google Cloud customers. We also need to plan for higher network capacity when we add new regions, with redundant pathways to those new locations. Because our Global Networking team wants to deliver capacity when Google Cloud customers need it, we design our network with reliability in mind, consider multiple points of failure, and provide fast failover. 

Forecasting in parts

To forecast capacity needs, we predict demand five years out, three years out, and 3-6 months out using sensitivity analyses. We then determine the size of the cable investment that meets an optimal point on the cost curve–one that balances capacity and cost, while meeting Google Cloud requirements like latency. To help with forecasting, we break our network down into three categories:

  • Inter-metro network – pathways connecting major metropolitan areas, both within a continent and across continents. 

  • Regional – pathways connecting data centers within a metropolitan region

  • Edge – pathways connecting Google’s network to internet service providers (ISPs)

Network Expansion

Engineering teams are obsessed with network resilience 

Dozens of engineering teams work to forecast and design the network. They determine:

  1. The bandwidth needs of individual Google services (for example, a Google Cloud service, Search, YouTube). 

  2. The shape of the network topology to optimize for performance (how various nodes, devices, and connections are physically or logically arranged in relation to each other). 

  3. The number of routes (that is, the number of circuits to each location) needed for high availability. We look for routes that are fully disjointed and diverse to prevent any single points of failure. 

Testing optical fiber to improve capacity planning

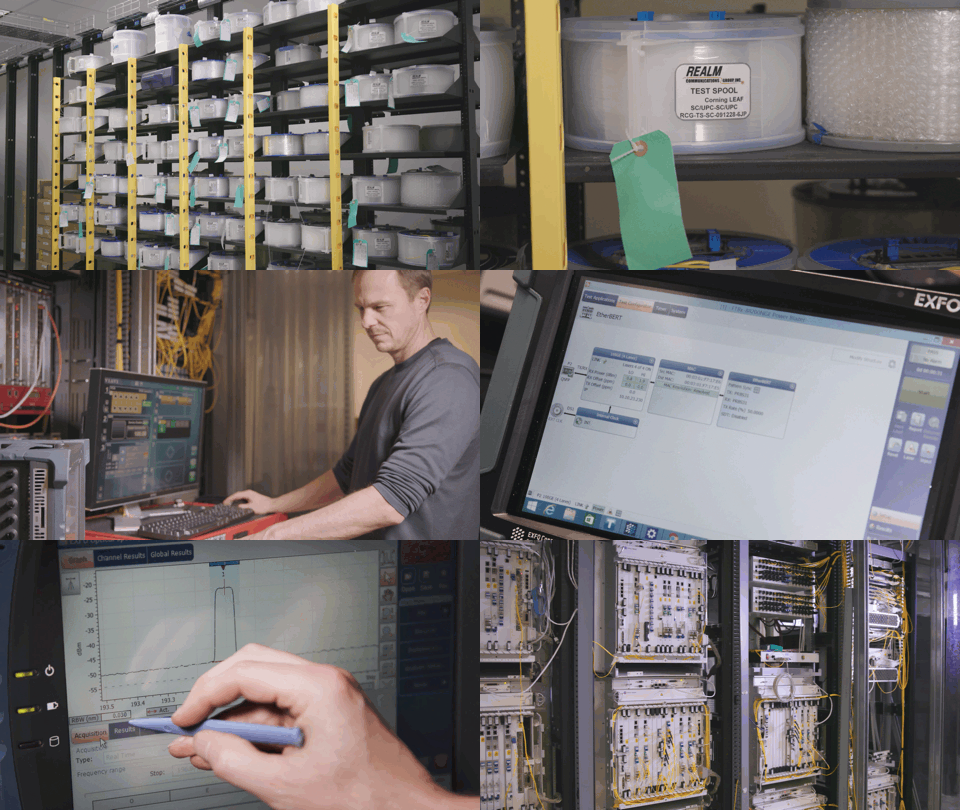
The Optical Network Engineering team tests our fiber optic cables to understand how they will perform in the Google Cloud network. These tests play a significant role in capacity planning because the results help us predict what we can deliver.

The goal is to achieve the highest signal to noise ratio. As light travels through fiber over long distances, the signal it carries gets distorted. While we can’t house an entire cable in a lab, we do have dozens of spools of fiber that we daisy chain together to replicate the Google Cloud network. Using an optical spectrum analyzer we check the quality of the signal as we pulse lasers, pushing 1.2 Tbps of 0s and 1s through the cable! 

Spectrum Analyzer

But fiber is not just about lasers, cables, and the laws of physics. Our response to changes and issues in hardware requires robust automation through software. We build automation pipelines to enable us to deploy new fiber to connect our regions. If there are disruptions in the fiber, automation enables us to pinpoint the issue with an accuracy of a few meters and respond rapidly. 

What technology have we developed to increase the reliability and scale of the network?

Space Division Multiplexing

The Grace Hopper cable is breaking records by using space division multiplexing (SDM) to fit sixteen fiber pairs into the cable, instead of the usual six or eight. Once delivered, that cable will be able to transmit 340 Tbps–enough to stream my video in 4K 4.5 million times simultaneously! SDM increases cable capacity in a cost-effective manner with additional fiber pairs while taking advantage of power-optimized repeater designs. With the Topaz cable, we are working with partners to use SDM technology and sixteen fiber pairs to give it a design capacity of  240 Tbps. The 19th century electrochemical scientist Michael Faraday would be proud of us knowing that we could send over 2.4 trillion bits every second across the Pacific Ocean in a single cable.

SDM

Wavelength Selective Switching


Topaz will also use wavelength selective switching (WSS). WSS can be used to dynamically route signals between optical fibers based on wavelength. This greatly simplifies the allocation of capacity, giving the cable system the flexibility to add and reallocate it in different locations as needed. Here’s how it works:

  1. Branching Units are used to split a portion of the cable to land at a different location. Branching can be either at the fiber pair or wavelength level.

  2.  WSS splits the signal between the main trunk and the branch path based on its wavelength. This allows the signals from different paths to share the same fiber instead of installing dedicated fiber pairs for each link.

  3. The cable system can then carve up the spectrum on an optical fiber pair and apply capacity to different locations using a single fiber pair, giving us the ability to redirect traffic on the fly.

WSS

WSS for resilient and dynamic paths was first sketched on a Google whiteboard over four years ago. Now this innovation is being adopted across the industry. 

Why is it so rare for Google Cloud customers to notice when a cable is affected? 

While fiber optic cables are protected, they aren’t immune to damage. Fishing vessels and ships dragging anchors account for two-thirds of all subsea cable faults. 

Fiber

Though the risks are unavoidable, it’s important to remember that fiber optic cables are part of the network backbone of the internet that links data centers and thousands of computers together. That’s why Google maintains an intense focus on building and operating a resilient global network while we continue to advance its breadth, reliability, and availability. For example, it can sometimes take weeks to repair a cable that has been physically damaged. So, to ensure that services aren’t affected in such a situation, we design the network with extra capacity: each cross section has multiple cables and no single point of failure. 

Our philosophy is to create enough concurrent network paths at the metro, regional, and global level—coupled with a scalable software control plane—to support traffic redistribution while minimizing network congestion. When service disruptions occur, we’re still able to serve people around the world because other network paths exist to reroute traffic seamlessly. When a link between the US and Chile becomes disrupted, for example, Google Cloud can reroute traffic for customers on our additional diverse paths. 

How can Google Cloud customers make the most of these advancements?

Network planning, operations, and monitoring are linchpins at Google.

Premium Tier network is the gateway to Google’s high-speed network


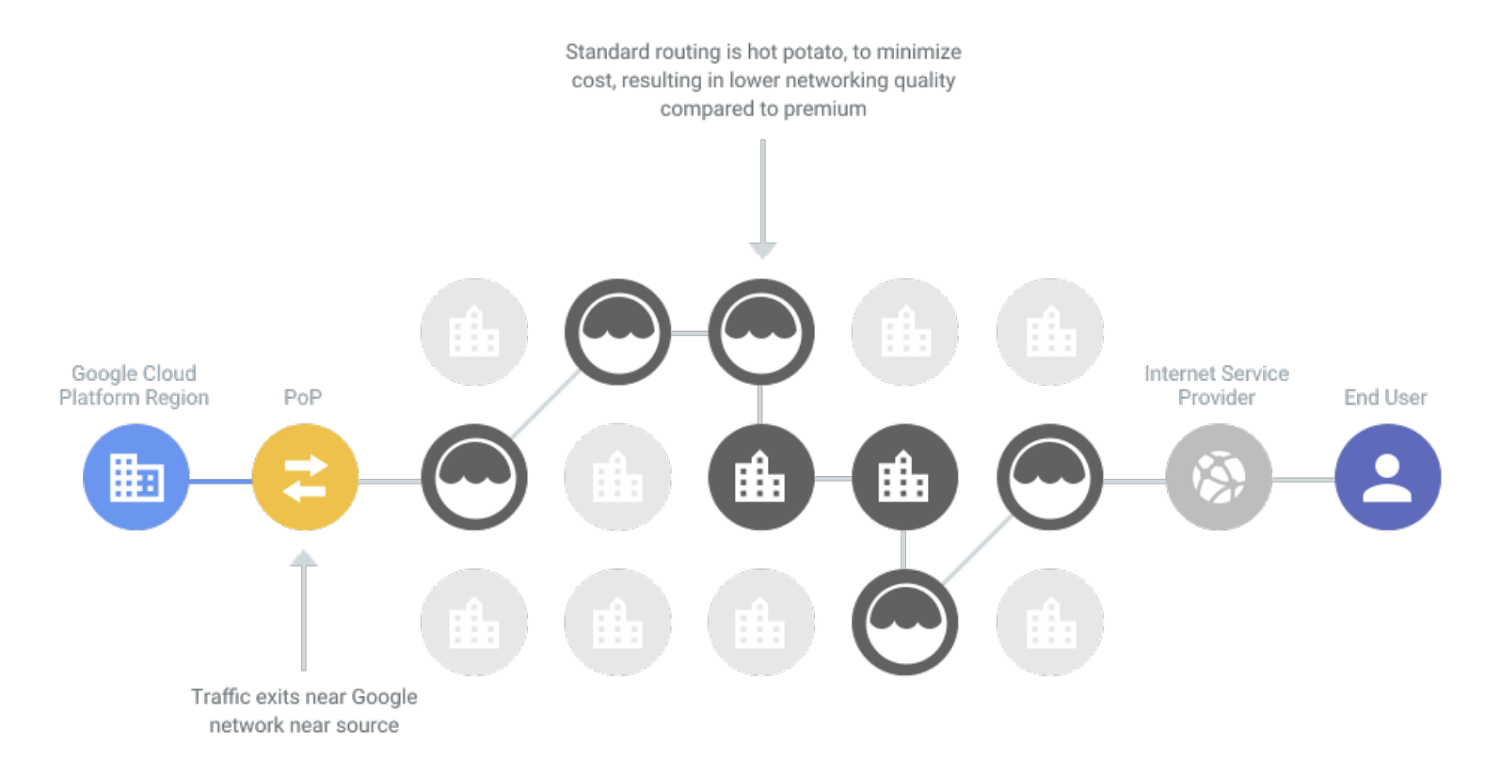
To understand the Google Cloud network backbone, it is useful to have an  understanding of how the public internet works. Dozens of large ISPs interconnect at network access points in various cities. The typical agreement between providers involves something called hot potato routing. An ISP hands off traffic to a downstream ISP as quickly as it can to minimize the amount of work that the ISP's network needs to do. This can mean more hops between networks and routers before traffic arrives at its destination. This kind of routing is available on Google Cloud with our Standard Tier network.
Standard Diagram
Click to enlarge

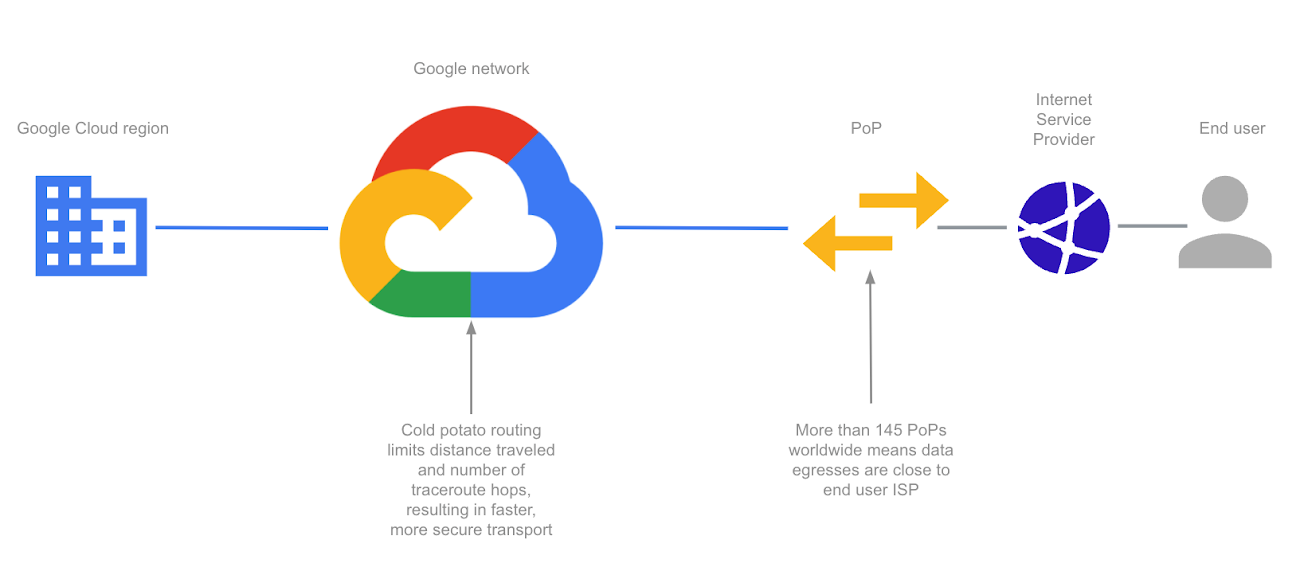
Google Cloud’s Premium Tier network, in contrast, uses cold potato routing. It keeps traffic on its private network backbone, requiring fewer hops between ISPs. It offloads traffic to ISPs at the last possible moment, when the data is closest to the end user. 

Diagram
Click to enlarge

Let’s put this in perspective with an example. If you’re a company using traditional networks, your traffic from your own private data center in the US to its destination in Chile will first traverse your local ISP. That local ISP most likely uses a fiber supplier and passes that traffic off to another ISP. Between the many hot-potato hops, you may face higher latency and limited bandwidth capacity. 

With Google Cloud, you can use our Premium Tier network to achieve 1.4X higher throughput than the Standard Tier, as well as Cloud CDN to cache content closest to your end users. 

The beauty of vertical integration

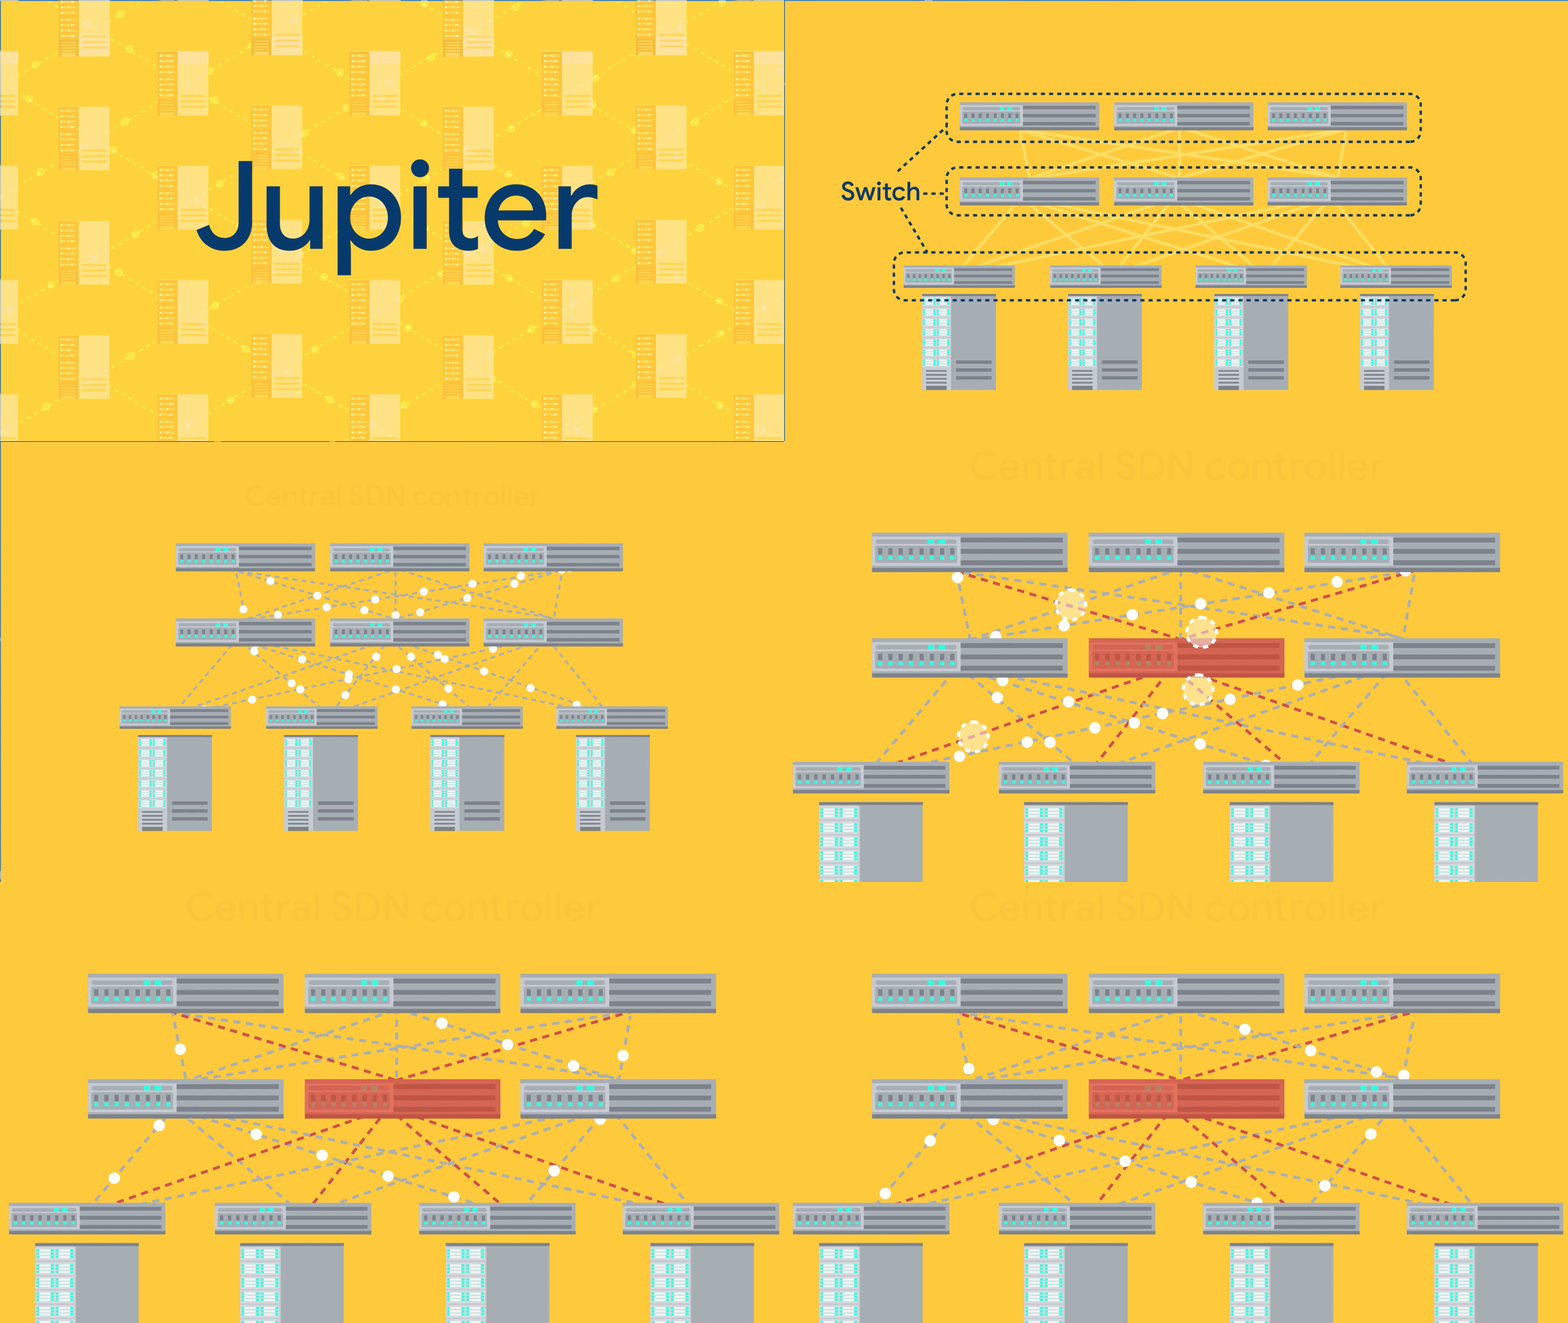
Let’s not forget the software stack that sits on top of the physical network. The network topology and software-defined controller for traffic routing is built for fault tolerance. Our data center network fabric is made up of a closed hierarchical switching fabric that we designed called Jupiter, which connects hundreds of thousands of machines across data centers, providing 1 Pbps of bisection bandwidth.

Jupiter is able to provide such high bandwidth because it’s nonblocking, which means it can handle routing a request to any free output port without interfering with other traffic. This means it can scale or burst with extremely low latency, and is fault-tolerant. If something in the fabric breaks, it is built to handle disruptions.

Jupiter

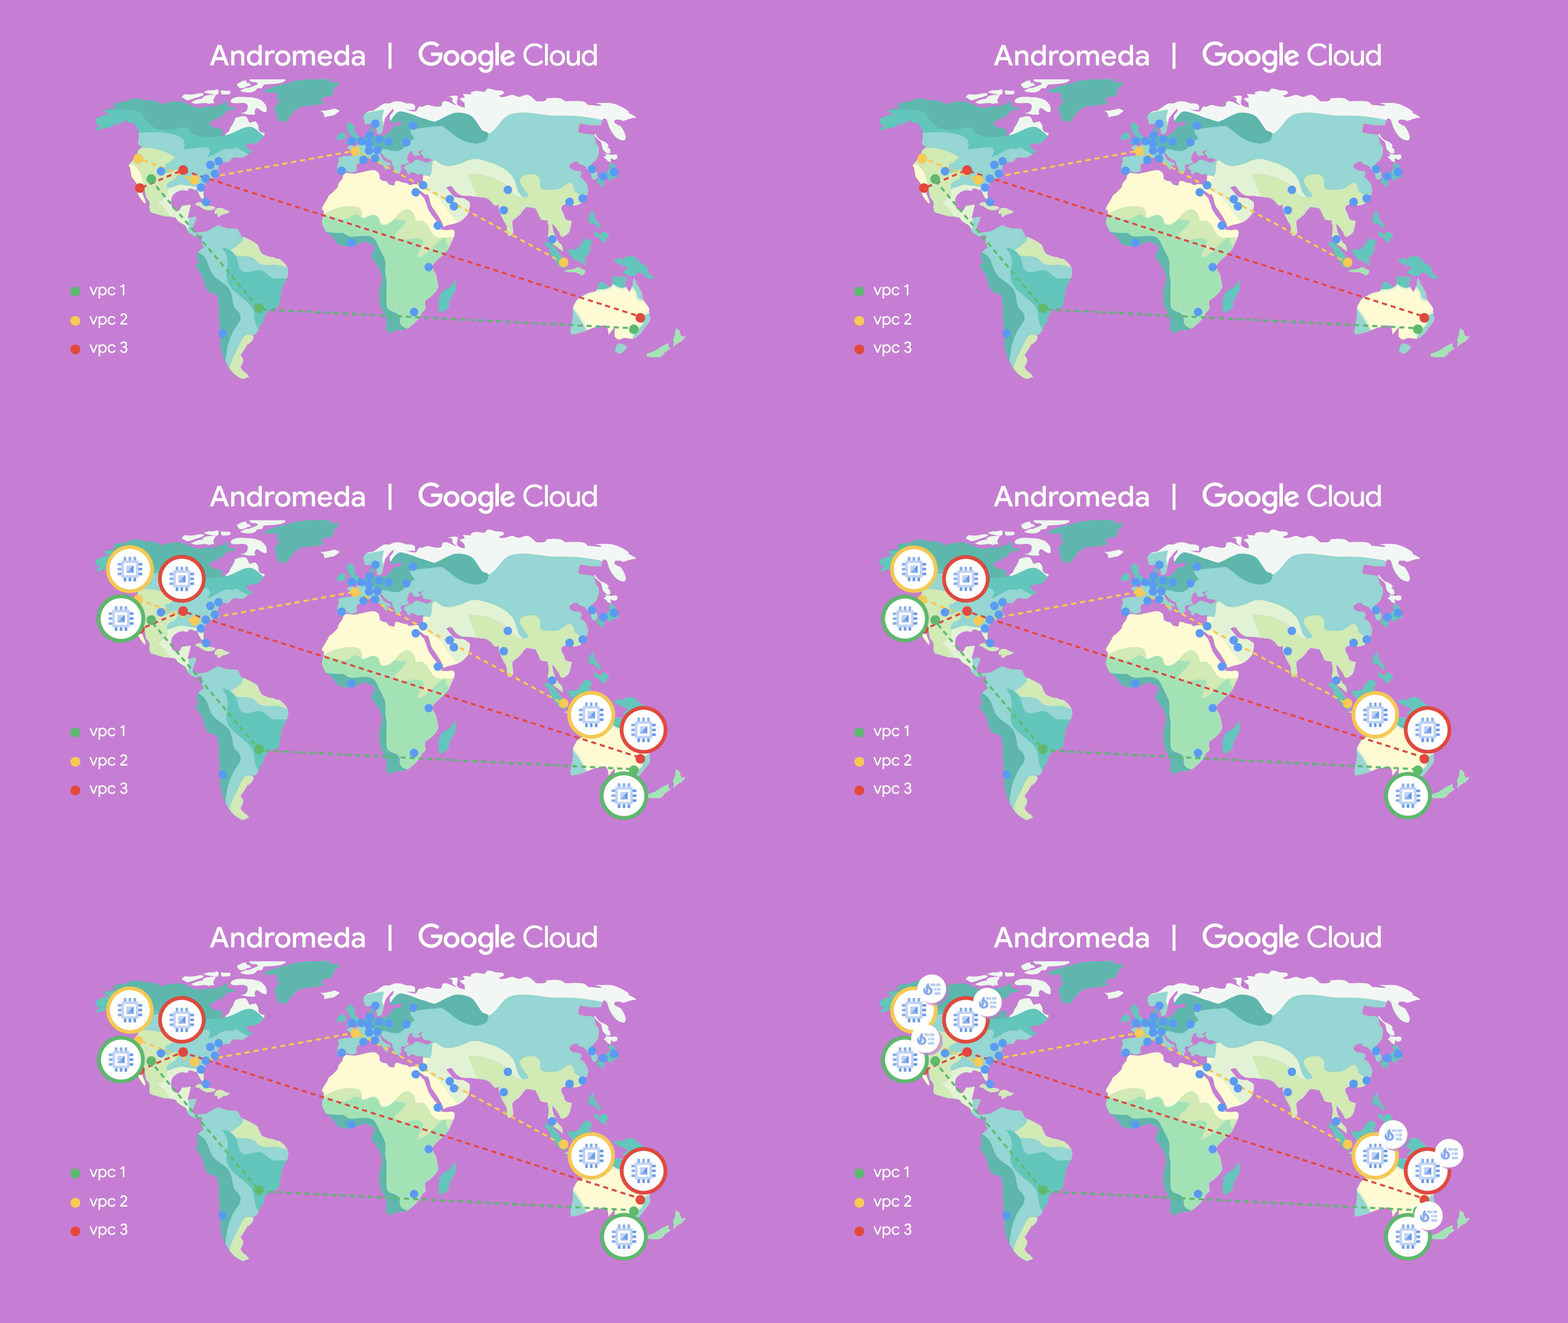
Google Cloud is underpinned by Andromeda, a virtualized software-defined network built on top of Jupiter, giving you your very own slice of our massive global switching fabric. Andromeda enables you to deploy a global virtual private cloud network–with the aim of providing you both functional and performance isolation, as well as a high degree of security. With its global control plane, high-speed on-host virtual switch, and packet processors, you can burst thousands of stateful machines online in minutes or deploy firewall rules across thousands of machines immediately without chokepoints. Google Cloud’s global Virtual Private Cloud (VPC), for example, gives you the ability to have a single VPC that can span multiple regions without communicating across the public internet. Because various microservices may be separated and talk to each other through the network, they can scale independently so you get virtually unlimited storage and stateless, resilient compute, along with features like live migration.

Andromeda

Whether you’re processing petabytes of data in seconds using BigQuery, running consistent databases across regions using Spanner, or autoscaling GKE clusters across zones, Google's global network backbone provides the capacity to get the job done. 

It’s been a great journey to deep dive into how Google plans and builds its fiber optic cable network. Every engineer, project manager, and public policy expert I talked to exuded a passion to extend the global connectivity of the internet to the entire world (with Google Cloud being a major catalyst in this endeavor). 

Be sure to check out more ways to catch a ride on the Google Cloud Premium Tier network.

Interested in championing Google Cloud technology with a chance to access exclusive events? Join Google Cloud Innovators. 

Have thoughts about this article? Give me a shout @stephr_wong.

  •  

Announcing BigQuery and BigQuery ML operators for Vertex AI Pipelines

Developers (especially ML engineers) looking to orchestrate BigQuery and BigQuery ML (BQML) operations as part of a Vertex AI Pipeline have previously needed to write their own custom components. Today we are excited to announce the release of new BigQuery and BQML components for Vertex AI Pipelines, that help make it easier to operationalize BigQuery and BQML jobs in a Vertex AI Pipeline. As official components created by Google Cloud, using these components will allow you to more easily include BigQuery and BigQuery ML as part of your Vertex AI Pipelines. For example, with Vertex AI Pipelines, you can automate and monitor the entire model life cycle of your BQML models, from training to serving. In addition, using these components as part of a Vertex AI Pipelines provides extra data and model governance, as each time you run a pipeline, Vertex AI Pipelines tracks any artifacts produced automatically.

For BigQuery, the following components are now available:

BigqueryQueryJobOp

Allows users to submit an arbitrary BQ query which will either write to a temporary or permanent table. Launch a BigQuery query job and wait for it to finish.

For BigQuery ML (BQML), the following components are now available:

BigqueryCreateModelJobOp

Allow users to submit a DDL statement to create a BigQuery ML model.

BigqueryEvaluateModelJobOp

Allows users to evaluate a BigQuery ML model.

BigqueryPredictModelJobOp

Allows users to make predictions using a BigQuery ML model.

BigqueryExportModelJobOp

Allows users to export a BigQuery ML model to a Google Cloud Storage bucket 

Learn how to create a simple Vertex AI Pipeline train a BQML model, and deploy the model to Vertex AI for online predictions:

In addition to the notebook above, check out the end-to-end example of using Dataflow, BigQuery and BigQuery ML components to predict the topic label of text documents using BQML and Dataflow.

End-to-end example using BigQuery and BQML components in a Vertex AI Pipeline

In this section, we'll show an end-to-end example of using BigQuery and BQML components in a Vertex AI Pipeline. The pipeline predicts the topic of raw text documents by first converting them into embeddings using the pre-trained Swivel TensorFlow model with BQML. Then, it trains a logistic regression model in BQML using the text embeddings to predict the label, which is the topic of the document. For simplification, the model will just predict if the topic is equal to "acq" (1) or not (0), where "acq'' means that document is related to the topic of "corporate acquisitions'' as defined in the dataset. 

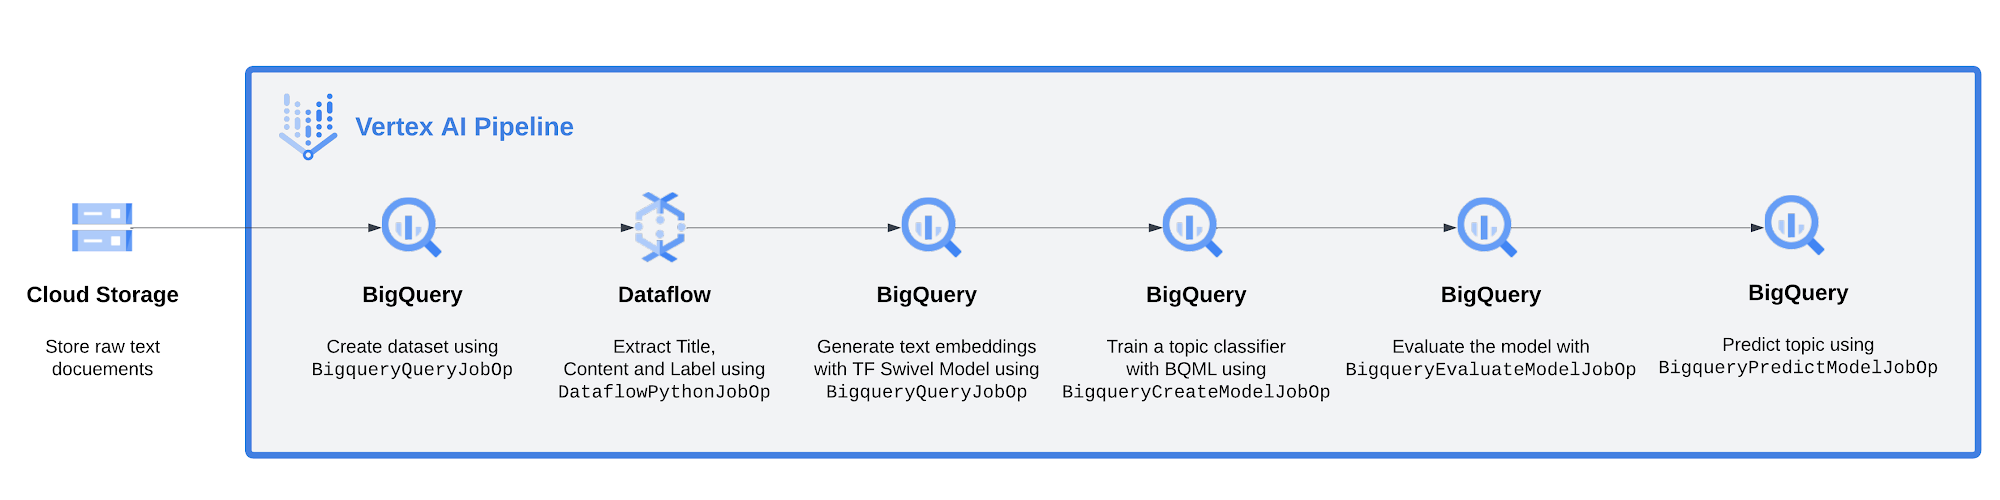
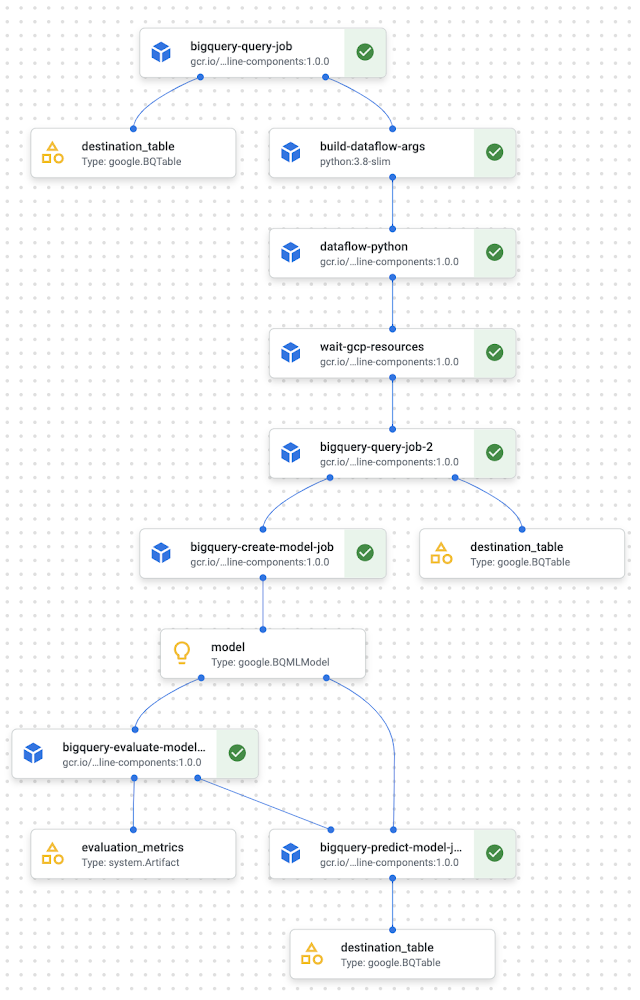
Below you can see a high level picture of the pipeline

BQML Pipeline
The high level picture of the pipeline (Click to enlarge)

From left to right: 

  1. Start with news-related text documents stored in Google Cloud Storage

  2. Create a dataset in BigQuery using BigqueryQueryJobOp

  3. Extract title, content and topic of (HTML) documents using Dataflow and ingest into BigQuery

  4. Using BigQuery ML, apply the Swivel TensorFlow model to generate embeddings for each document’s content

  5. Train a logistic regression model to predict if a document's embedding is related to a pre-defined topic (1 if related, 0 if not)

  6. Evaluate the model 

  7. Apply the model to a dataset to make predictions

Let’s dive into them. 

ETL with DataflowPythonJobOp component

Imagine that you have raw text documents from Reuters stored in Google Cloud Storage (GCS). You want to preprocess them and import the text into BigQuery to train a classification model using BQML.

First, you will need to create a BQ dataset, which you can do by running the SQL query CREATE SCHEMA IF NOT EXISTS mydataset. In a Vertex AI Pipeline you can execute this query within a BigqueryQueryJobOp.
code_block
<ListValue: [StructValue([('code', 'from google_cloud_pipeline_components.v1.bigquery import (\r\n BigqueryQueryJobOp,\r\n BigqueryCreateModelJobOp,\r\n BigqueryEvaluateModelJobOp,\r\n BigqueryPredictModelJobOp) \r\n\r\nBQ_DATASET = "mydataset"\r\n\r\n# create the BQ dataset\r\nbq_dataset_op = BigqueryQueryJobOp(\r\n query=f"CREATE SCHEMA IF NOT EXISTS {BQ_DATASET}",\r\n project=project,\r\n location="US",\r\n )'), ('language', ''), ('caption', <wagtail.rich_text.RichText object at 0x7fe5237a7dc0>)])]>

For the full code, please see this notebook.

Aftering creating the dataset, you will need to prepare the text documents for model training. Importantly, you would need to parse out the relevant sections ("Title", "Body", "Topics") of text from the raw documents. In our case we use a Beam pipeline on Dataflow which uses the Beautiful Soup (bs4) library in Python to extract the following:

  • Title, the title of the article

  • Body, the full text content of the article

  • Topics, one or more categories that the article belongs to

This preprocessing step is based on the ETL pipeline with Apache Beam and can be wrapped in a DataflowPythonJobOp to be used in a Vertex AI Pipeline. DataflowPythonJobOp components enable you to submit Apache Beam jobs written in Python to Dataflow for execution on Google Cloud. In other words, you can use this component to run your data pre-processing step to extract the relevant sections of text via Dataflow.
code_block
<ListValue: [StructValue([('code', '# Dataflow job\r\ndataflow_python_op = DataflowPythonJobOp(\r\n requirements_file_path=requirements_file_path,\r\n python_module_path=python_file_path,\r\n args=build_dataflow_args_op.output,\r\n project=project,\r\n location=region,\r\n temp_location=temp_location,\r\n ).after(build_dataflow_args_op)\r\n\r\n# Wait for Dataflow job to finish running\r\ndataflow_wait_op = WaitGcpResourcesOp(\r\n gcp_resources=dataflow_python_op.outputs["gcp_resources"]\r\n ).after(dataflow_python_op)'), ('language', ''), ('caption', <wagtail.rich_text.RichText object at 0x7fe5237a7d90>)])]>

For the full code, please see this notebook.

To clarify what's happening in the component above, the requirements_file_path contains the GCS bucket URI to a requirements file, the python_module_path contains the bucket uri to the Apache Beam pipeline python script and args contains a list of arguments that are passed via the Beam Runner to your Apache Beam code. Also notice that WaitGcpResourcesOp is required, which allows the pipeline to wait for the component to finish execution before continuing to the next part of the pipeline.

Feature Engineering with BigqueryQueryJobOp and DataflowPythonJobOp

Once the documents have been pre-processed in Dataflow, the next step is to generate text embeddings from the pre-processed documents. The embeddings can then be used to as training data for the logistic regression model to predict the topic. 

To generate embeddings from text, you can use the Swivel model, which is a pre-trained TensorFlow model publicly available on TensorFlow Hub. How do you use a pre-trained TensorFlow SavedModel on text in BigQuery? You can import it using BQML and apply it to the text of our documents to generate the embeddings. Then you split the dataset to get the training sample you will consume into the text classifier.  

The following shows what the component looks like in the pipeline:

code_block
<ListValue: [StructValue([('code', '# run preprocessing job\r\n bq_preprocess_op = BigqueryQueryJobOp(\r\n query=bq_preprocess_query,\r\n project=project,\r\n location="US",\r\n ).after(dataflow_wait_op)'), ('language', ''), ('caption', <wagtail.rich_text.RichText object at 0x7fe5237a79d0>)])]>

For the full code, please see this notebook.

Where bq_preprocess_query contains the preprocessing query, project and location where the BigQuery job runs. 

For example, within bq_preprocess_query, the first step will be to import the Swivel model using BigQuery ML. And a step thereafter is to retrieve the embeddings, which serves as the training data for the document classifier model in the next section.
code_block
<ListValue: [StructValue([('code', "# Create the embedding model by importing the model from GCS\r\n CREATE OR REPLACE MODEL\r\n mydataset.swivel_model \r\n OPTIONS(model_type='tensorflow',\r\n model_path='{MODEL_PATH}');\r\n\r\n...\r\n\r\n# Retrieve embeddings from text using ML.PREDICT\r\n SELECT\r\n title,\r\n sentences,\r\n output_0 as content_embeddings,\r\n topics\r\n FROM ML.PREDICT(MODEL `{PROJECT_ID}.{BQ_DATASET}.{MODEL_NAME}`,(\r\n SELECT topics, title, content AS sentences\r\n FROM `{PROJECT_ID}.{BQ_DATASET}.{BQ_TABLE}`\r\n )"), ('language', ''), ('caption', <wagtail.rich_text.RichText object at 0x7fe5237a7d00>)])]>

For the full code, please see this notebook.

Training a document classifier with BigqueryCreateModelJobOp

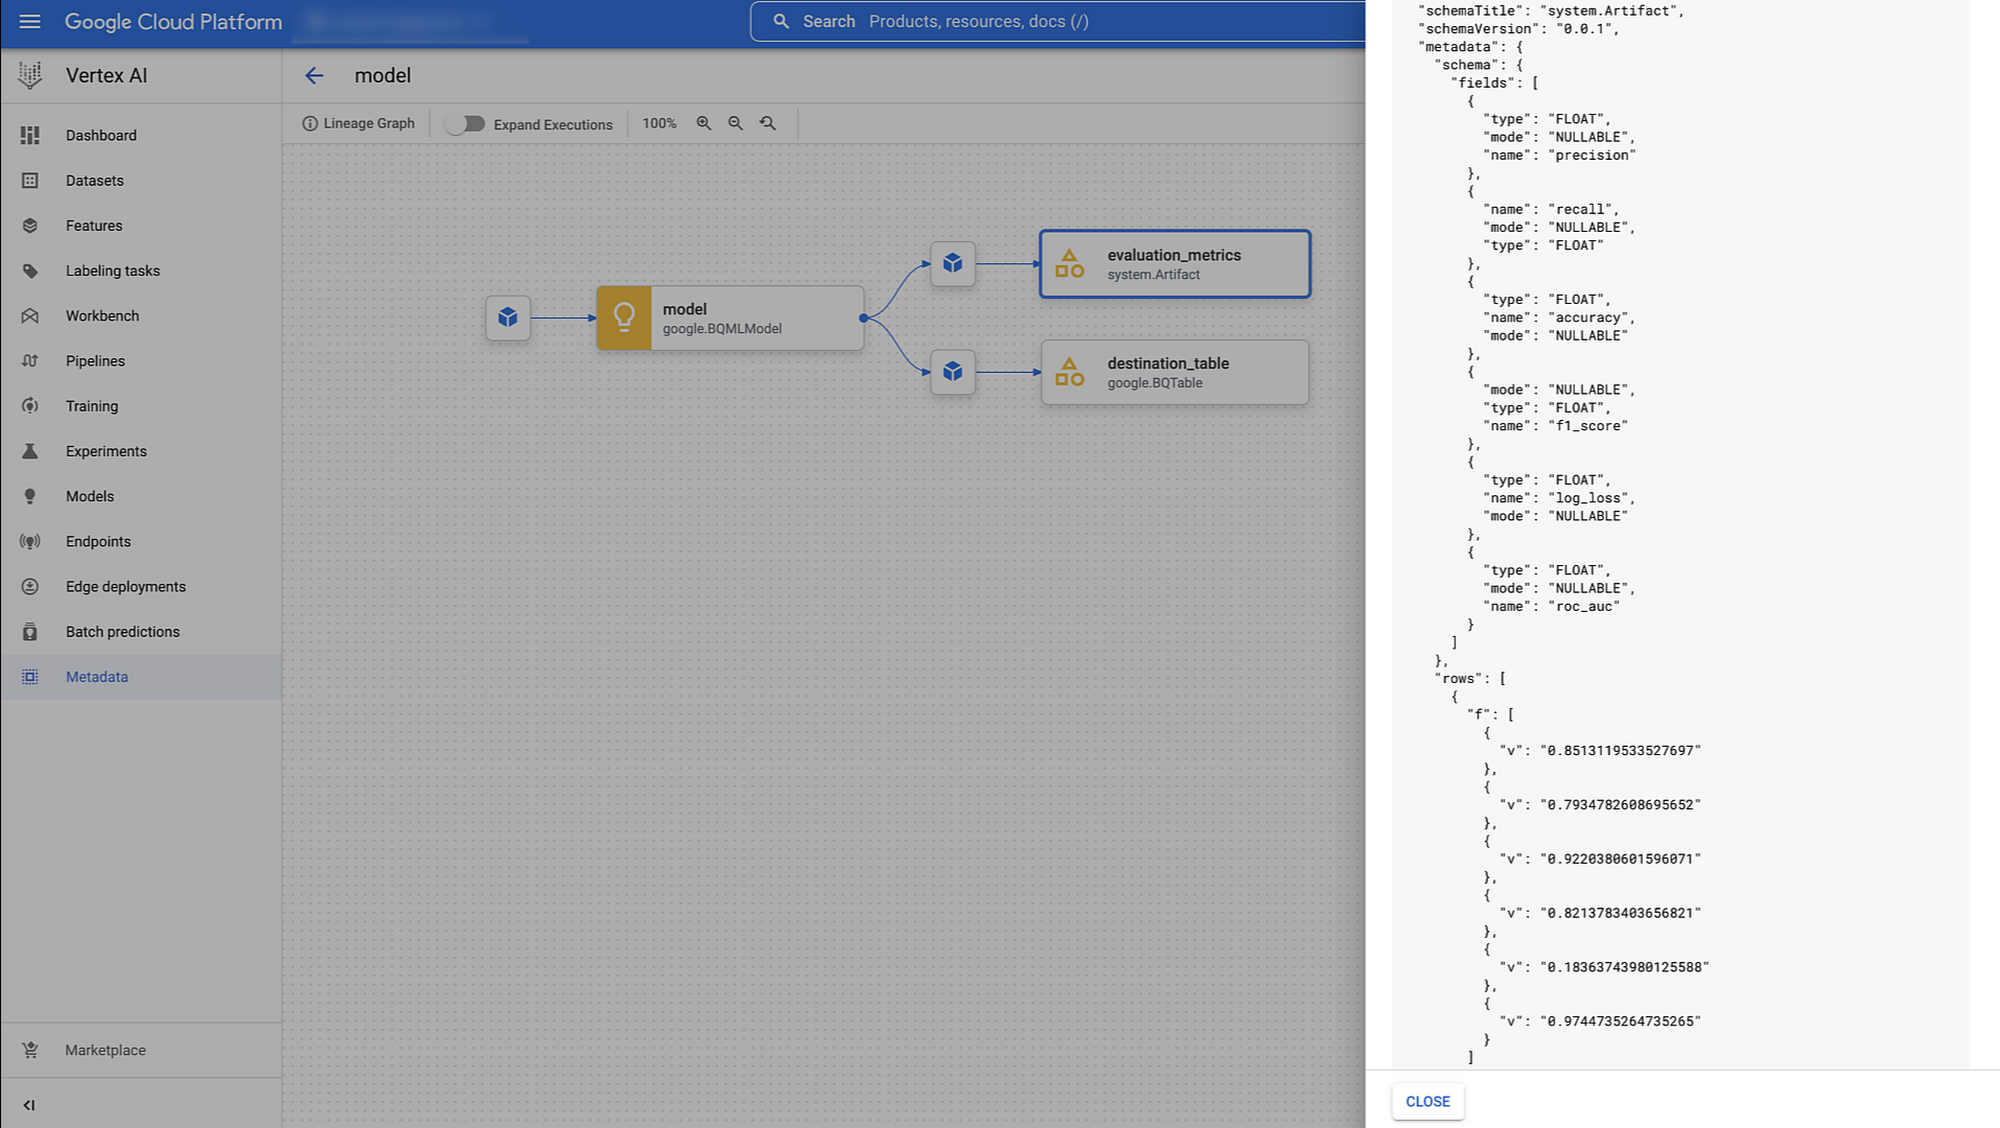
Now that you have the training data (as a table), you are ready to build a document classifier, using logistic regression to determine if the label of the document is 'acq' or not, where 'acq' means that the document is related to the topic of "corporate acquisitions". You can automate this BQML model creation operation within a Vertex AI Pipeline using the BigqueryCreateModelJobOp. This component allows you to pass the BQML training query and, in case you need, parameterize it and the job associated in order to schedule a model training on BigQuery. The component returns a google.BQMLModel which also tracks the BQML model automatically using Vertex ML Metadata which provides extra insight into model and data lineage.
code_block
<ListValue: [StructValue([('code', 'create_bq_model_query = f"""\r\nCREATE OR REPLACE MODEL `{PROJECT_ID}.{BQ_DATASET}.{CLASSIFICATION_MODEL_NAME}`\r\n OPTIONS (\r\n model_type=\'logistic_reg\',\r\n input_label_cols=[\'label\']) AS\r\n SELECT\r\n label,\r\n feature.*\r\n FROM\r\n `{PROJECT_ID}.{BQ_DATASET}.{PREPROCESSED_TABLE}`\r\n WHERE split = \'TRAIN\';\r\n"""'), ('language', ''), ('caption', <wagtail.rich_text.RichText object at 0x7fe5237a7880>)])]>

For the full code, please see this notebook.

Evaluate the model using BigqueryEvaluateModelJobOp

Once you train the model, you would probably evaluate it before deploying into production for generating predictions. With the BigqueryEvaluateModelJobOp, you just need to pass the google.BQMLModel output you received from the previous training BigqueryCreateModelJobOp and it will generate various evaluation metrics, based on the type of the model. In our case we get precision, recall, f1_score, log_loss and roc_auc which are available in the lineage of pipeline in the Vertex ML Metadata.
Figure 2 - A view of metrics in Vertex AI Metadata
A view of metrics in Vertex AI Metadata (Click to enlarge)

Notice that, thanks to these components, you can implement conditional logic in order to decide what you want to do with the model downstream. For example, if the performance is above a certain threshold, you can have the pipeline proceed to make predictions directly with BigQuery ML, or register your model into a model registry service, or deploy the model to a staging endpoint. This will really depend on the logic you want to implement with your ML pipeline. 

In this example pipeline with document classification, you'll just be generating batch predictions directly without conditional logic. 

Predict using BigqueryPredictModelJobOp

In order to operationalize BQML model prediction, the bigquery module of google_cloud_pipeline_components library provides you the BigqueryPredictModelJobOp which allows you to launch a BigQuery predict model job by consuming the google.BQMLModel of the training component.

code_block
<ListValue: [StructValue([('code', '#simulate prediction\r\n bq_predict_op = BigqueryPredictModelJobOp(\r\n model=bq_model_op.outputs["model"],\r\n query_statement=create_bq_prediction_query,\r\n job_configuration_query=job_config,\r\n project=project,\r\n location=\'US\'\r\n ).after(bq_evaluate_op)'), ('language', ''), ('caption', <wagtail.rich_text.RichText object at 0x7fe5237a7ca0>)])]>

For the full code,  please see this notebook.

In this component,  you also pass in a job_config in order to define the destination table (project ID, dataset ID and table ID) beyond the query statement to format the columns you want to have in the prediction table. 

Below you can see the visualization of the overall pipeline you get in the Vertex AI Pipelines UI.

Figure 3  - The visualization of the pipeline in the Vertex AI Pipelines UI.
The visualization of the pipeline in the Vertex AI Pipelines UI.

Conclusion

In this blogpost, we described the new BigQuery and BQML components now available for Vertex AI Pipelines. We also showed an end-to-end example of using the components for document classification involving BigQuery ML and Vertex AI Pipelines. 

What’s Next

Are you ready for running your BQML pipeline with Vertex AI Pipelines? Check out the following resources and let give it a try: 

References 

  1. https://google-cloud-pipeline-components.readthedocs.io/en/google-cloud-pipeline-components-0.2.2/google_cloud_pipeline_components.experimental.bigquery.html

  2. https://cloud.google.com/architecture/analyzing-text-semantic-similarity-using-tensorflow-and-cloud-dataflow?hl=en

  3. https://towardsdatascience.com/how-to-do-text-similarity-search-and-document-clustering-in-bigquery-75eb8f45ab65 

Special thanks to Bo Yang, Andrew Ferlitsch, Abhinav Khushraj, Ivan Cheung, and Gus Martins for their contributions to this blogpost.

  •  

Deploy a coloring page generator in minutes with Cloud Run

Have you ever written a script to transform an image? Did you share the script with others or did you run it on multiple computers? How many times did you need to update the script or the setup instructions? Did you end up making it a service or an online app? If your script is useful, you’ll likely want to make it available to others. Deploying processing services is a recurring need – one that comes with its own set of challenges. Serverless technologies let you solve these challenges easily and efficiently.

In this post, you’ll see how to…

  • Create an image processing service that generates coloring pages

  • Make it available online using minimal resources

…and do it all in less than 200 lines of Python and JavaScript!

Tools

To build and deploy a coloring page generator, you’ll need a few tools:

  • A library to process images

  • A web application framework

  • A web server

  • A serverless solution to make the demo available 24/7

Architecture

Here is one possible architecture for a coloring page generator using Cloud Run:

[Architecture serving a web app with Cloud Run](./pics/1_architecture.png)
Architecture serving a web app with Cloud Run

And here is the workflow:

  1. The user opens the web app: the browser requests the main page.

  2. Cloud Run serves the app HTML code.

  3. The browser requests the additional needed resources.

  4. Cloud Run serves the CSS, JavaScript, and other resources.


  1. The user selects an image and the frontend sends the image to the /api/coloring-page endpoint.

  2. The backend processes the input image and returns an output image, which the user can then visualize, download, or print via the browser.

Software stack

Of course, there are many different software stacks that you could use to implement such an architecture.

Here is a good one based on Python:

[schema](./pics/2_software_stack.png)
Schema

It includes:

  • Gunicorn: A production-grade WSGI HTTP server

  • Flask: A popular web app framework

  • scikit-image: An extensive image processing library

Define these app dependencies in a file named requirements.txt:
[Code snippet with highlighted code.

Image processing

How do you remove colors from an image? One way is by detecting the object edges and removing everything but the edges in the result image. This can be done with a Sobel filter, a convolution filter that detects the regions in which the image intensity changes the most.

Create a Python file named main.py, define an image processing function, and within it use the Sobel filter and other functions from scikit-image:

[code snippet](./snippets_pics/2_algorithm.py.png)

Note: The NumPy and Pillow libraries are automatically installed as dependencies of scikit-image.

As an example, here is how the Cloud Run logo is processed at each step:

![Colored input transformed into edge-detected grayscale output](./pics/3_edge_detection.png)
Colored input transformed into edge-detected grayscale output

Web app

Backend

To expose both endpoints (GET / and POST /api/coloring-page), add Flask routes in main.py:

![code snippet](./snippets_pics/3_backend.py.png)

Frontend

On the browser side, write a JavaScript function that calls the /api/coloring-page endpoint and receives the processed image:
![code snippet](./snippets_pics/4_frontend.js.png)


The base of your app is there. Now you just need to add a mix of HTML + CSS + JS to complete the desired user experience.

Local development

To develop and test the app on your computer, once your environment is set up, make sure you have the needed dependencies:

![code snippet](./snippets_pics/5a_pip.sh.png)

Add the following block to main.py. It will only execute when you run your app manually:

![code snippet](./snippets_pics/5b_dev.py.png)

Run your app:

![code snippet](./snippets_pics/5c_dev.sh.png)


Flask starts a local web server:

![code snippet](./snippets_pics/5d_dev.txt.png)

Note: In this mode, you’re using a development web server (one that is not suited for production). You’ll next set up the deployment to serve your app with Gunicorn, a production-grade server.

 You’re all set. Open localhost:8080 in your browser, test, refine, and iterate.

Deployment

Once your app is ready for prime time, you can define how it will be served with this single line in a file named Procfile:

![code snippet](./snippets_pics/6_procfile.sh.png)
![code snippet](./snippets_pics/7_tree.txt.png)

That’s it, you can now deploy your app from the source folder:

![code snippet](./snippets_pics/8a_deploy.sh.png)

Under the hood

The command line output details all the different steps:

![code snippet](./snippets_pics/8b_deploy.txt.png)

Cloud Build is indirectly called to containerize your app. One of its core components is Google Cloud Buildpacks, which automatically builds a production-ready container image from your source code. Here are the main steps:

  • Cloud Build fetches the source code.

  • Buildpacks autodetects the app language (Python, in this case) and uses the corresponding secure base image.

  • Buildpacks installs the app dependencies (defined in requirements.txt for Python).

  • Buildpacks configures the service entrypoint (defined in Procfile for Python).

  • Cloud Build pushes the container image to Artifact Registry.

  • Cloud Run creates a new revision of the service based on this container image.

  • Cloud Run routes production traffic to it.

Notes:

  • Buildpacks currently supports the following runtimes: Go, Java, .NET, Node.js, and Python.

  • The base image is actively maintained by Google, scanned for security vulnerabilities, and patched against known issues. This means that, when you deploy an update, your service is based on an image that is as secure as possible.

If you need to build your own container image, for example with a custom runtime, you can add your own Dockerfile and Buildpacks will use it instead.

Updates

More testing from real-life users shows some issues.

First, the app does not handle pictures taken with digital cameras in non-native orientations. You can fix this using the EXIF orientation data:

![code snippet](./snippets_pics/9a_transpose.py.diff.png)

In addition, the app is too sensitive to details in the input image. Textures in paintings, or noise in pictures, can generate many edges in the processed image. You can improve the processing algorithm by adding a denoising step upfront:

![code snippet](./snippets_pics/9b_denoise.py.diff.png)

This additional step makes the coloring page cleaner and reduces the quantity of ink used if you print it:

![La nascita di Venere by Botticelli, with and without denoising](./pics/4_denoising_botticelli.png)
La nascita di Venere by Botticelli, with and without denoising

Redeploy, and the app is automatically updated:

![code snippet](./snippets_pics/A_update.sh.png)

It’s alive

The app is visible as a service in Cloud Run:

![screenshot](./pics/a_cloud_run_services.png)

The service dashboard gives you an overview of app usage:

![screenshot](./pics/b_cloud_run_dashboard.png)

That’s it; your image processing app is in production!

![Animated Demo](./pics/demo.gif)

It’s serverless

There are many benefits to using Cloud Run in this architecture:

  • Your app is available 24/7.

  • The environment is fully managed: you can focus on your code and not worry about the infrastructure.

  • Your app is automatically available through HTTPS.

  • You can map your app to a custom domain.

  • Cloud Run scales the number of instances automatically and the billing includes only the resources used when your code runs.

  • If your app is not used, Cloud Run scales down to zero.

  • If your app gets more traffic (imagine it makes the news), Cloud Run scales up to the number of instances needed.

  • You can control performance and cost by fine-tuning many settings: CPU, memory, concurrency, minimum instances, maximum instances, and more.

  • Every month, the free tier offers the first 50 vCPU-hours, 100 GiB-hours, and 2 million requests for no cost.

Source code

The project includes just seven files and less than 200 lines of Python + JavaScript code.

You can reuse this demo as a base to build your own image processing app:

More

  •  

Cloud Support API: Building a "red button" for creating critical cases

The Cymbal Group is a happy (and fictional) GCP premium support customer. They enjoy the benefits of being a premium support customer - access to a dedicated Technical Account Manager (TAM), 15 minute response time for P1 Technical support cases, 24 hours a day, 7 days a week, and now - access to the Cloud Support API. 

Folks at Cymbal realize that when it comes to urgent situations, every second counts. Previously, the Cymbal Group team spent time finding the correct team members that have access to file cases as well as filling out several boilerplate form entries before the support case was created. Every extra minute it took to reach out to support, Cymbal knew that more and more of their customers would be impacted. 

To fix this they wanted to create a “red button” or “break-glass” case creation tool in these urgent situations, specifically to file top priority support cases. This tool would be a form on a simple website, helping them to cut out many of the time consuming aspects of filing a support case. 

Building the red button web page

The Cymbal Group made a simple drop-down menu with preconfigured case components that map to their most commonly used Google Cloud services such as BigQuery or Dataproc. The form also can require a URL to a Google Meet video conference room that both Cymbal and Google employees could join and further discuss the situation. 

The Cymbal case creation page is configured to have many optional fields, such as project ID, because Cymbal automatically creates a case in the Cymbal org (not linked to a specific project) if the field is empty. While many fields are optional, Cymbal realizes that the more information it can provide to Google Support initially, the better they will be to address the issue quickly and efficiently.

Red Button Landing Page

The Cymbal team created a wireframe mockup of their entry form and confirmation page. They then used the set up instructions on the Cloud Support API documentation page to activate the API in a Cymbal GCP project and created a Service Account with the proper roles. After reviewing the Cloud Support API documentation, Cymbal created a simple Python application using the Case Creation method from scratch. Here’s a code snippet!

code_block
<ListValue: [StructValue([('code', 'import googleapiclient.discovery\r\n\r\nSERVICE_NAME = "cloudsupport"\r\nAPI_VERSION = "v2beta"\r\nORGANIZATION_ID = \'1234567890\' #example org ID\r\nORGANIZATION_AS_PARENT = \'organizations/\' + ORGANIZATION_ID\r\nAPI_DEFINITION_URL = "https://cloudsupport.googleapis.com/$discovery/rest?version=" + API_VERSION\r\n\r\nsupportApiService = googleapiclient.discovery.build(\r\n serviceName=SERVICE_NAME,\r\n version=API_VERSION,\r\n discoveryServiceUrl=API_DEFINITION_URL)'), ('language', ''), ('caption', <wagtail.rich_text.RichText object at 0x7fe523dd3190>)])]>

This code snippet above initializes the Cloud Support client library and defines the Organization ID that the Cybal Group will be using to create a case under. Next, they pull from the fields from the UI web form and insert them in a JSON request body. This will contain the details used for creating a support case, such as the description of the case, and the component id which denotes which GCP product is affected - hardcoded into the drop-down menu. In this case, the case description is a combination of several fields in the form, using a custom-made function called build_description_value.

code_block
<ListValue: [StructValue([('code', 'request_body = {\r\n \'display_name\': display_name,\r\n \'description\': build_description_value(project, impact, googlemeet_link, comments),\r\n \'classification\': {\r\n \'id\': component\r\n },\r\n \'time_zone\': "-06:00", \r\n \'subscriber_email_addresses\': subscribers,\r\n \'severity\': "S1"\r\n }'), ('language', ''), ('caption', <wagtail.rich_text.RichText object at 0x7fe523dd3970>)])]>

Cymbal hard coded the subject of the case and provided a stock description. The subject (display_name) is "BUSINESS CRITICAL P1 ISSUE - PLEASE JOIN GVC LINK " + googlemeet_link + " IMMEDIATELY". 

In the next code snippet, the JSON body is passed to the cases.create() method in order to create a support case.

code_block
<ListValue: [StructValue([('code', 'create_case_response = supportApiService.cases()\\\r\n .create(parent=ORGANIZATION_AS_PARENT, body=request_body)\\\r\n .execute()'), ('language', ''), ('caption', <wagtail.rich_text.RichText object at 0x7fe523dd3bb0>)])]>

When the creation of the case is completed, the API returns the case number in the response. Cymbal then displays this on a case confirmation page, as well as a link to the Cloud Console where they can view the support case and add additional comments throughout the investigation.

Case Created Confirmation Page

And it’s as simple as that! The Cymbal Group team members await for the Google Support team to join the Google Meet call to further discuss the critical issue at hand. The Cymbal group is happy to have saved time getting help with their critical production issue. 

If you have ideas for creating your own case creation tool similar to the one described in this blog post, you can find more information about the Cloud Support API and its capabilities in our documentation here https://cloud.google.com/support/docs/reference/support-api and here https://cloud.google.com/support/docs/reference/rest.

For Cloud Support API examples like the ones mentioned in this blog post, please view this GitHub repository: https://github.com/GoogleCloudPlatform/professional-services/tree/main/examples/cloud-support/

  •  

Introducing the Google Cloud Developer Plugin for AI Coding Agents

Agent skills fit well alongside documentation and remote MCP servers as ways of enabling the success of your AI workflows. They reduce context window usage for certain use cases, and they're straightforward to install. However, you might have noticed that managing individual skills can be unwieldy, or that some skills are most useful when they act alongside other skills or MCP servers toward the same goal. That's where plugins come in to help.

Today, we're thrilled to announce a new Google Cloud plugin for AI coding agents! Designed as installable bundles, agent plugins equip the AI agent of your choice with skills and tools to be more effective on Google Cloud.

Solving the tool coupling problem

As you expand your usage of coding agents, you might find that they become significantly more capable when they use related skills in tandem or with complementary context and tooling. For example, an agent analyzing infrastructure is more effective when combining domain knowledge, workflow recommendations, and the ability to interact with a live environment together.

Plugins solve this coupling challenge by packaging related capabilities into cohesive, installable bundles. This allows you to take advantage of both broad foundational capabilities and deep, product-specific tools without managing complex dependencies. In the Google Agent Skills repository, you'll start to see the following for Google Cloud popping up over time:

  • Foundational plugins: Essential platform-wide guidance for things like documentation discovery, project configuration, and architectural design.

  • Domain-focused plugins: Specialized knowledge and best practices for technical areas in the context of Google Cloud.

For this release, we've started with a foundational plugin that supports agent functionality for all Google Cloud users, focusing on making it easier for agents to retrieve Google Cloud-related skills, make use of official documentation, and handle programmatic interactions with Google Cloud.

Built on an open standard

We've also built our plugin in compliance with the Agent Plugins specification, an open, vendor-neutral standard for packaging Agent Skills and Model Context Protocol (MCP) servers into portable, interoperable units. Rather than requiring developers to maintain different configurations and wrappers for every AI assistant, the Agent Plugins standard provides a unified manifest and directory structure.

Our Google Cloud plugin adopts this standard to ensure that developers across a variety of AI coding environments get consistent, high-quality access to tools that help them succeed with Google Cloud. That includes not only the plugins we talk about today, but all other plugins published to the Google Agent Skills repository as well.

Let's take a look at the flagship plugin that we've just published in the Google Agent Skills repository: google-cloud-developer. This plugin exists to help agents successfully navigate the fundamentals of interacting with Google Cloud: things like authentication, authorization, managing projects, and guardrails for gcloud CLI operations. This plugin also bundles configuration for the Developer Knowledge MCP server, which gives agents up-to-date grounding in Google's official developer documentation.

Plugin in action: Project onboarding and identity authentication

To see how this plugin works, consider a situation where you're bootstrapping a new project as part of working on a script. With the google-cloud-developer plugin installed, you can prompt your agent:

I'm brand new to this platform, and I need to get an account and a first project with billing set up. Then, I need my local machine authenticated so a script that I'm writing can call the APIs as a service identity instead of as me.

  1. Environment awareness: The agent silently runs background checks against your live environment for prerequisites like CLI availability and potential existing projects or organizations.

  2. Review: The agent considers IAM best practices to avoid risks that might be assumed as part of the prompt, like accidental key leaks or git commits.

  3. Interaction with guardrails: The agent outlines a workflow roadmap and offers to act on those steps before modifying any resources.

screenshot_plugin_blog_post

Installing Google Cloud plugins

Because Google Cloud plugins are available from the open Google Agent Skills repository and adhere to the standard Agent Plugins layout, adding them to your environment is straightforward. For example, here's how you'd install the google-cloud-developer plugin:

Antigravity CLI

Install the plugin directly via the CLI using its path in the Google Agent Skills repository:

code_block
<ListValue: [StructValue([('code', 'agy plugin install https://github.com/google/skills/plugins/cloud/google-cloud-developer'), ('language', ''), ('caption', <wagtail.rich_text.RichText object at 0x7f923152a1d0>)])]>

Enable the Developer Knowledge API in your Google Cloud project by using the gcloud CLI:

code_block
<ListValue: [StructValue([('code', 'gcloud services enable developerknowledge.googleapis.com --project=<YOUR_PROJECT_ID>'), ('language', ''), ('caption', <wagtail.rich_text.RichText object at 0x7f9232047550>)])]>

Claude Code

Add the Google plugins marketplace, then install the plugin:

code_block
<ListValue: [StructValue([('code', 'claude plugin marketplace add google/skills\r\nclaude plugin install google-cloud-developer@google-plugins'), ('language', ''), ('caption', <wagtail.rich_text.RichText object at 0x7f92401f1690>)])]>

Enable the Developer Knowledge API in your Google Cloud project by using the gcloud CLI:

code_block
<ListValue: [StructValue([('code', 'gcloud services enable developerknowledge.googleapis.com --project=<YOUR_PROJECT_ID>'), ('language', ''), ('caption', <wagtail.rich_text.RichText object at 0x7f9231adefd0>)])]>

Create an API key for the Developer Knowledge API by following the instructions Create and secure the API key. Save the key you create in a secure location.

Export the API key to your environment before starting Claude Code:

code_block
<ListValue: [StructValue([('code', 'export DEVELOPERKNOWLEDGE_API_KEY=<YOUR_API_KEY>'), ('language', ''), ('caption', <wagtail.rich_text.RichText object at 0x7f9231d65f50>)])]>

Note: The DEVELOPERKNOWLEDGE_API_KEY environment variable needs to be set in the environment before you start Claude Code. Consider adding this export to your shell's startup script (e.g. .bashrc, .zshrc) for convenience.

Codex CLI

Add the Google plugins marketplace, then install the plugin:

code_block
<ListValue: [StructValue([('code', 'codex plugin marketplace add google/skills\r\ncodex plugin add google-cloud-developer@google-plugins'), ('language', ''), ('caption', <wagtail.rich_text.RichText object at 0x7f9231da69d0>)])]>

Enable the Developer Knowledge API in your Google Cloud project by using the gcloud CLI:

code_block
<ListValue: [StructValue([('code', 'gcloud services enable developerknowledge.googleapis.com --project=<YOUR_PROJECT_ID>'), ('language', ''), ('caption', <wagtail.rich_text.RichText object at 0x7f9231da40d0>)])]>

Create an API key for the Developer Knowledge API by following the instructions Create and secure the API key. Save the key you create in a secure location.

Enable authenticated access to the Developer Knowledge MCP server by updating ~/.codex/config.toml (or your project's .codex/config.toml) to include the following lines:

code_block
<ListValue: [StructValue([('code', '[mcp_servers.developer-knowledge]\r\n url = "https://developerknowledge.googleapis.com/mcp"\r\n env_http_headers = { "X-Goog-Api-Key" = "DEVELOPERKNOWLEDGE_API_KEY" }'), ('language', ''), ('caption', <wagtail.rich_text.RichText object at 0x7f9231da4910>)])]>

Export the API key to your environment before starting Codex:

code_block
<ListValue: [StructValue([('code', 'export DEVELOPERKNOWLEDGE_API_KEY=<YOUR_API_KEY>'), ('language', ''), ('caption', <wagtail.rich_text.RichText object at 0x7f923159ccd0>)])]>

Note: The DEVELOPERKNOWLEDGE_API_KEY environment variable needs to be set in the environment before you start Codex. Consider adding this export to your shell's startup script (e.g. .bashrc, .zshrc) for convenience.

Note: After performing this configuration update, a status of not logged in for the Developer Knowledge MCP server is expected and doesn't block access to the server.

Next Steps

If you're already a Google Cloud user, try the above installation steps to set up your agent for success. We think you'll like what you see! For those who want a more guided approach, our new codelab will walk you through the installation and initial exploration of the plugin in Antigravity.

If you're new to Google Cloud, you can also get started with instructions in our documentation to set yourself up for local development.

The most curious readers can also take a deeper look at the plugins and agent skills available to use today in the Google Agent Skills repository.

  •  

Power agent hubs or custom harnesses with the Antigravity SDK in one toolkit

Enterprise agent adoption isn’t one-size-fits-all. While many teams will opt for managed commercial platforms, such as Gemini Enterprise Agent Platform for turnkey agent deployment and governance, developers with bespoke workflows or custom execution engines often choose to build their own lightweight agent hubs.

If you are building a centralized agent hub from the ground up, you need tools that run predictably, log everything, and stay in their sandbox. The Antigravity SDK gives you the exact runtime engine used in Antigravity 2.0 and the Antigravity CLI, adding declarative safety policies, real-time telemetry, and stateful multi-turn persistence straight into your application. When the core runtime updates, your SDK agents get those optimizations automatically. That's why today, we're breaking down how the Antigravity SDK powers a complete multi-agent control plane.

How Antigravity comes together

01-agy-harness

A multi-agent control plane monitors and manages LLM workloads. It shows you exactly what the agent is thinking, which tools it calls, and how it stores state.

02-agents-dashboard

It consists of two critical components:

1. Antigravity SDK agent core: The runtime that manages model interactions (like Gemini 3.1 Pro and Gemini 3.8 Flash), runs tools, generates thinking traces, and executes skills.

2. Observability and telemetry middleware: An event-driven layer powered by Antigravity SDK Lifecycle Hooks. It intercepts agent actions like step starts, thinking updates, and tool calls, and streams telemetry over WebSockets to your dashboard.

Use case: Multi-agent monitoring and interactive control

Let's explore a scenario where an organization is building or maintains a custom agent hub and wants to integrate Antigravity SDK-powered agents. 

The problem: An operations engineer needs to monitor multiple active agents (e.g., gemini-pro-agent, github-agent, email-agent) performing background research, document summarization, and task scheduling. Traditionally, observing agent progress requires:

  • Tailing fragmented console logs across multiple terminal windows

  • Manually inspecting JSON transcripts to diagnose stuck or failing tool calls

  • Lack of visibility into which Skills or MCP connectors are loaded for a given agent session

  • Difficulty tracking cumulative token usage and execution latency

The solution: This post walks through each one: the streaming API for real-time observation, lifecycle hooks for telemetry and interception, the policy engine for steering, skills for capability management, and session state for persistence. With an SDK-powered dashboard, operators get a single view into what every agent is doing.

03-agy-bespoke-agent-hub

What happens behind the scenes?
When an operator or dashboard interacts with an Antigravity agent, the runtime coordinates execution through five core mechanisms:

  1. Session initialization and state attachment (save_dir & conversation_id):The runtime initializes or reattaches to a session, binding execution to a root save_dir. Multi-turn trajectory logs, tool receipts, and artifacts are preserved under traj-<conversation_id> for persistent auditability.

  2. Skill resolution (skills_paths):Domain-specific capabilities and instructions are resolved directly from filesystem paths pointing to SKILL.md bundles, dynamically augmenting the agent's system prompt without an external registry.

  3. Concurrent stream generation (ChatResponse):The runtime exposes three concurrent async iterators over the single model response:

  • response (yields visible text tokens)

  • response.thoughts (yields internal chain-of-thought reasoning deltas)

  • response.tool_calls (yields typed ToolCall events containing .name and .args)

  • Declarative sandboxing and built-in tool execution:When the agent performs workspace operations, built-in tools (list_directory, find_file, search_directory, view_file, create_file, edit_file) execute strictly within configured workspaces directories governed by safety policies (such as policy.workspace_only()).

  • Telemetry interception via lifecycle hooks:Decorated async hook functions (@hooks.on_session_start, @hooks.pre_tool_call_decide, @hooks.post_tool_call, @hooks.on_session_end) intercept agent transitions in real time, validating or modifying tool calls and broadcasting telemetry payloads over WebSockets to the live dashboard.

  • The Antigravity SDK organizes these responsibilities into four core building blocks:

    1. Modular capabilities with Skills

    Skills provide reusable, domain-specific instruction bundles and reference assets that agents load dynamically. Rather than managing an in-memory registry, skills are resolved directly from filesystem directories containing a SKILL.md file:

    code_block
    <ListValue: [StructValue([('code', 'from google.antigravity import Agent, LocalAgentConfig\r\n\r\n# Pass directory paths containing SKILL.md bundles directly to config.\r\n# The runtime dynamically resolves and injects them into the prompt.\r\nconfig = LocalAgentConfig(\r\n model="gemini-3.8-flash",\r\n system_instructions=(\r\n "You are an enterprise operations assistant equipped with "\r\n "specialized operational skills."\r\n ),\r\n skills_paths=["./skills/research", "./skills/code_review"],\r\n)\r\n\r\nasync with Agent(config) as agent:\r\n response = await agent.chat("Analyze the deployment logs.")'), ('language', ''), ('caption', <wagtail.rich_text.RichText object at 0x7fc79c896810>)])]>

    2. Sandboxed built-in tools and workspace scoping

    The SDK provides production-ready file and workspace tools out of the box, which removes the need to write custom filesystem wrappers. When paired with workspaces and declarative safety policies, tools are strictly confined to authorized directories:

    code_block
    <ListValue: [StructValue([('code', 'from google.antigravity import Agent, LocalAgentConfig, types\r\nfrom google.antigravity.policies import policy\r\n\r\nconfig = LocalAgentConfig(\r\n model="gemini-3.8-flash",\r\n # Selectively enable built-in tools via CapabilitiesConfig\r\n capabilities=types.CapabilitiesConfig(\r\n enabled_tools=[\r\n types.BuiltinTools.LIST_DIR, # "list_directory"\r\n types.BuiltinTools.FIND_FILE, # "find_file"\r\n types.BuiltinTools.SEARCH_DIR, # "search_directory"\r\n types.BuiltinTools.VIEW_FILE, # "view_file"\r\n types.BuiltinTools.CREATE_FILE, # "create_file"\r\n types.BuiltinTools.EDIT_FILE, # "edit_file"\r\n ]\r\n ),\r\n # Enforce filesystem isolation: operations outside these paths are blocked\r\n workspaces=["./workspace"],\r\n policies=[policy.workspace_only()],\r\n)'), ('language', ''), ('caption', <wagtail.rich_text.RichText object at 0x7fc79c20f5d0>)])]>

    3. Session isolation and trajectory persistence (save_dir & conversation_id)

    State persistence in the Antigravity SDK is managed through declarative configuration rather than an external database. Specifying a save_dir establishes a root directory where full turn trajectories, tool receipts, and artifacts are preserved under traj-<conversation_id>:

    code_block
    <ListValue: [StructValue([('code', 'from google.antigravity import Agent, LocalAgentConfig\r\n\r\nconfig = LocalAgentConfig(\r\n model="gemini-3.8-flash",\r\n # Root directory storing all conversation trajectories\r\n save_dir="./storage/sessions",\r\n # Supply conversation_id to reattach to an existing trajectory;\r\n # omit it to let the SDK mint a new ID on the first turn.\r\n conversation_id="ops-session-20260820-001",\r\n)\r\n\r\nasync with Agent(config) as agent:\r\n # Resumes prior context and continues the multi-turn session seamlessly\r\n response = await agent.chat("Summarize the issues identified in the last turn.")'), ('language', ''), ('caption', <wagtail.rich_text.RichText object at 0x7fc79c20f910>)])]>

    4. Real-time telemetry and interception with lifecycle hooks

    Lifecycle hooks allow dashboards and monitoring engines to observe and steer every stage of execution. Using decorated async functions, you can stream status updates over WebSockets, inspect tool parameters, and enforce human-in-the-loop approvals before tools run:

    code_block
    <ListValue: [StructValue([('code', 'from google.antigravity import Agent, LocalAgentConfig, types\r\nfrom google.antigravity.hooks import hooks\r\n\r\n# 1. Session start & end telemetry\r\n@hooks.on_session_start\r\nasync def on_session_start():\r\n broadcast_to_dashboard({"type": "STATUS", "status": "RUNNING"})\r\n\r\n@hooks.on_session_end\r\nasync def on_session_end():\r\n broadcast_to_dashboard({"type": "STATUS", "status": "IDLE"})\r\n\r\n# 2. Intercept tool calls before execution (human-in-the-loop / audit gate)\r\n@hooks.pre_tool_call_decide\r\nasync def intercept_tool(tool_call: types.ToolCall) -> types.HookResult:\r\n broadcast_to_dashboard({\r\n "type": "TOOL_CALL",\r\n "tool": tool_call.name,\r\n "args": tool_call.args,\r\n })\r\n # Return HookResult to approve or block execution\r\n return types.HookResult(allow=True)\r\n\r\n# 3. Post-execution tool receipts\r\n@hooks.post_tool_call\r\nasync def record_tool_result(result):\r\n broadcast_to_dashboard({\r\n "type": "TOOL_RESULT",\r\n "tool": result.name,\r\n "error": getattr(result, "error", None),\r\n })\r\n\r\nconfig = LocalAgentConfig(\r\n model="gemini-3.8-flash",\r\n hooks=[on_session_start, on_session_end, intercept_tool, record_tool_result],\r\n)'), ('language', ''), ('caption', <wagtail.rich_text.RichText object at 0x7fc79c20ff10>)])]>

    Get started

    Get started with your own enterprise agent control plane using the following resources:

    •  

    Not All LLM Workloads Are Equal: Benchmarking TPU Performance on Classification vs. Generation

    Moving Large Language Models (LLMs) from experimental prototypes into enterprise production exposes a critical truth: your infrastructure dictates both your performance ceilings and your unit economics. Standard hardware benchmarks often ignore a fundamental reality—not all LLM requests stress the silicon in the same way.

    In this post, we dive into a comprehensive benchmarking exercise comparing Gemma 3 12B and Gemma 3 27B on Google Cloud TPU v6e to answer a crucial architectural question: How does TPU infrastructure actually perform when tasked with structurally distinct workloads at scale?

    Key Findings and Suggestions

    Before diving into the methodology, here are the critical takeaways for architects deploying Gemma 3 on TPU v6e:

    The Generation Performance Wall

    For decode-heavy generation tasks, the Gemma 3 27B model hits a strict performance wall past 64 concurrent users, plateauing at a 4.12x normalized throughput multiplier at 128 users. In contrast, the 12B model scales up to an 8.19x multiplier. 

    Suggestion: If your workload requires high-concurrency generation, downsize to the 12B model, or set strict pod-autoscaling limits capping concurrent requests at 64 per replica for the 27B model.

    The Classification Parity

    For prefill-heavy classification tasks, model parameter size matters significantly less. Both the 12B and 27B models achieve similar peak scaling (around 6.0x to 6.4x normalized throughput at 128 users) without saturating the TPUs.

    Suggestion: You can safely deploy larger, more capable models for summarization or classification workflows without paying a throughput penalty. The average --max-num-seqs or --max-model-len should be kept judiciously based on the average user load and average tokens per request, without which there might be request drops.

    Designing Around the Wall

    Hardware saturation manifests as severe latency spikes and silent request dropouts. To mitigate this, do not rely on standard CPU/Memory scaling triggers. Instead, scale based on  End-to-End (E2E) latency metrics, and implement aggressive vLLM bucket padding optimizations (VLLM_TPU_BUCKET_PADDING_GAP) to conserve memory.

    The Architecture Setup

    The inference stack can be divided into three core pillars:

    1. Infrastructure: GKE & TPU

    The foundation of our deployment is a Google Kubernetes Engine (GKE) Autopilot cluster. Connected to this is a single-host TPU v6e node pool configured with a 2x2 chip topology.

    2. Software & Tools: vllm

    For the serving framework, we leveraged vllm via vllm-project/tpu-inference.

    3. Models: Gemma 3 12B and 27B

    We evaluated two highly capable open-weights models: Gemma 3 12B and Gemma 3 27B. These models were accessed via HuggingFace.

    The Workloads: Classification vs. Generation

    Not all LLM requests stress the system equally. We benchmarked two distinct scenarios: Classification and Generation, across 16, 32, 64, and 128 concurrent users:

    • Classification (High Input, Low Output): This use case mimics an e-commerce compliance task. The prompt includes large blocks of product rules, item descriptions, and OCR-extracted text. The output is exceptionally small—typically just classifying an item as "Allow" or "Prohibit". Input Sequence Length (ISL) is ~4,000 tokens and Output Sequence Length (OSL) is ~10 tokens.
    • Generation (Low/Medium Input, High Output): This use case mimics long-form text generation. The prompt requests a detailed, analytical policy brief on the future of AI in the labor market. The model spends the majority of its time decoding and streaming out hundreds of tokens. Input Sequence Length (ISL) is 500 tokens and Output Sequence Length (OSL) is ~1,000 tokens.

    Results and Observations

    We measured metrics like Throughput (requests/sec), End-to-End Latency and the results provided some fascinating insights into how parameter size and hardware bandwidth interact. To ensure architectural consistency, every benchmark was executed using the vllm-project/tpu-inference hardware plugin, leveraging a standardized global serving configuration of max-model-len=128000, max-num-batched-tokens=8192, and max-num-seqs=512.

    Generation Scaling Divergence

    In Generation tasks, both models perform similarly up to 64 concurrent users. However, at 128 concurrent users, the Gemma 3 12B model shows significantly better scaling, achieving an 8.19x normalized throughput multiplier compared to a 4.12x plateau for the Gemma 3 27B model (normalized against the Gemma 3 12B baseline at 16 users). This suggests that the larger 27B model hits memory or compute limits much earlier under high generation loads.


    Concurrent Users Gemma 3 12B Throughput (req/s) Gemma 3 27B Throughput (req/s)
    16 users 1.00 x 1.05 x
    32 users 1.98 x 1.97 x
    64 users 2.96 x 4.00 x
    128 users 8.19 x 4.12 x
    generation_scaling
    aside_block
    <ListValue: [StructValue([('title', 'Pro Tip → Metrics Inflation at High Concurrency'), ('body', <wagtail.rich_text.RichText object at 0x7f8e31830c10>), ('btn_text', ''), ('href', ''), ('image', None)])]>

    Classification Performance Parity

    In Classification tasks, there is negligible difference in scaling behavior between the Gemma 3 12B and Gemma 3 27B models. Both models operate efficiently within the hardware's capacity and scale well, reaching peak normalized throughputs of approximately 6.04x to 6.37x at 128 concurrent users (normalized against the Gemma 3 12B baseline at 16 users).


    Concurrent Users Gemma 3 12B Throughput (req/s) Gemma 3 27B Throughput (req/s)
    16 users 1.00 x 0.76x
    32 users 1.18x 1.53x
    64 users 2.04x 3.15x
    128 users 6.37x 6.04x
    classification_perf_table_image2

    Latency Threshold Analysis

    End-to-End (E2E) latency exhibits different scaling behaviors depending on the model size and task. When using identical serving hyperparameters (--max-num-seqs=512), the Gemma 3 12B model's Classification latency roughly doubles when moving from 32 users to 64 users, indicating resource contention. However, for the larger Gemma 3 27B model, Classification latency remains relatively flat between 32 and 64 users before doubling at the 128-user mark. 


    Model Task 16 Users 32 Users 64 Users 128 Users
    Gemma 3 12B Generation 1.00x 1.13x 1.40x 1.70x
    Gemma 3 12B Classification 1.00x 0.99x 1.79x 2.90x
    Gemma 3 27B Generation 1.20x 1.68x 2.93x 3.33x
    Gemma 3 27B Classification 1.20x 1.95x 1.95x 3.88x
    latency threshold_image3
    aside_block
    <ListValue: [StructValue([('title', 'A Crucial TPU Optimization Technique'), ('body', <wagtail.rich_text.RichText object at 0x7f8e322419d0>), ('btn_text', ''), ('href', ''), ('image', None)])]>

    Conclusion

    Benchmarking Gemma 3 12B and 27B models on Google Cloud TPU v6e architecture reveals that raw parameter count is not the sole predictor of inference performance; rather, the interaction between the serving framework, hardware topology, and workload token ratios dictates efficiency. For generation tasks (low input, high output), the 12B model proves superior at high concurrency, sustaining an 8.19x relative throughput multiplier where the 27B model saturates at 4.12x. Conversely, for prefill-heavy classification tasks, both models perform similarly, allowing organizations to deploy larger models without a severe scaling penalty. Our evaluation also mapped exact hardware saturation thresholds—such as End-to-End latency doubling at 64 users for classification and hitting a cliff at 128 users for generation—enabling precise, data-driven auto-scaling triggers rather than costly over-provisioning. Ultimately, achieving these peak metrics requires aggressive tuning of vllm parameters, such as adjusting batched tokens and configuring TPU-specific bucket padding to prevent compute waste, proving that cost-effective AI infrastructure must strictly align model selection and serving configurations to the unique input/output profiles of production workloads.

    Ready to scale your LLM workloads?

    Don't let unoptimized infrastructure bottleneck your enterprise AI rollouts. Now that you know how different workload shapes impact hardware saturation, it's time to put these insights into practice:

    • Use these benchmarks to right-size your production architecture. Safely leverage the larger Gemma 3 27B for prefill-heavy classification tasks without a throughput penalty, but consider switching to the 12B model to maintain linear scaling for decode-heavy generation at high concurrency.
    • Deploy using Google Kubernetes Engine (GKE)  with TPU v6e node pools to build a highly scalable, managed AI foundation and dedicated vllm-project/tpu-inference hardware plugin. Alternatively, you can also deploy via Model Garden on Gemini Enterprise Agent Platform or you can spin up TPU VMs for serving Gemma 3 models.

    Have you encountered similar performance walls in your own production deployments? Share your scaling strategies, ask questions, and join the discussion in the Google Cloud Community forums.


    •  

    Spanner migrations: Automating dual-write with Antigravity CLI for minimal disruption

    When Google's Finance Engineering team needed to modernize their legacy data layer, they chose Spanner, a globally distributed, strongly consistent, multi-model database with high availability capabilities. But migrating to Spanner without taking production services offline was a daunting engineering challenge: As the internal team responsible for the application, we needed to manually rewrite dual-write logic across dozens of Data Access Objects (DAOs), a process that is slow and prone to human error. Further, doing so without disruption would have required implementing multi-phase dual-write architectures across every DAO in our codebase. 

    To solve this, we took an alternative approach: We built an automated refactoring pipeline powered by Antigravity CLI in headless mode. This helped us accelerate our migration velocity significantly while maintaining strict data parity in our staging environments as we prepare for production. 

    The challenge: Anatomy of a dual-write migration

    When migrating high-throughput production services where financial accuracy is essential, simple cutover scripts do not work. You must verify that both the legacy datastore and Spanner receive identical writes simultaneously until all the historical data backfills and verifications are complete.

    We structured our migration across three distinct phases:

    • Historical backfill: Copying existing historical records to Spanner while maintaining referential integrity.

    • Dual-write / dual-read implementation: Modifying every DAO to write mutations to both the primary store and Cloud Spanner in parallel during the migration window.

    • Automated API verification and parity checking: Intercepting RPC traffic and verifying end-to-end that every write lands with byte-for-byte equivalence across both stores.

    1 - Dual Write Architecture

    The architectural pattern is clean, but at our scale, we began to encounter friction. That’s because each DAO requires:

    • A dedicated MutationConverter class mapping complex domain models to Spanner schema columns

    • Dual-write branch handling and rollback or error-reporting logic

    • A suite of unit tests verifying both primary and Spanner writes using fake time sources and test doubles (FakeTimeSource)

    Performing these identical, high-precision code changes across 30+ DAOs by hand would have taken months of engineering time.

    The solution: Standardized mutation converter patterns

    To verify that our automation pipeline could reliably generate clean code, we first standardized our DAO refactoring pattern around a decoupled MutationConverter interface.

    Instead of embedding raw Spanner table names and column assignments directly inside core DAO business logic, we isolate Spanner schema translation into dedicated converter units:

    code_block
    <ListValue: [StructValue([('code', '// Example of the standardized pattern generated by our pipeline\r\n\r\ntype BpcTransferAmountsMutationConverter interface {\r\n ToInsertMutation(entity *model.BpcTransferAmount) (*spanner.Mutation, error)\r\n ToUpdateMutation(entity *model.BpcTransferAmount) (*spanner.Mutation, error)\r\n}\r\n\r\ntype bpcTransferAmountsMutationConverterImpl struct {\r\n tableName string\r\n}\r\n\r\nfunc (c *bpcTransferAmountsMutationConverterImpl) ToInsertMutation(entity *model.BpcTransferAmount) (*spanner.Mutation, error) {\r\n if entity == nil {\r\n return nil, errors.New("entity cannot be nil")\r\n }\r\n \r\n // Map domain fields to Cloud Spanner table schema\r\n cols := []string{"TransferId", "AmountCents", "CurrencyCode", "LastModifiedTimestamp"}\r\n vals := []interface{}{\r\n entity.TransferId,\r\n entity.AmountCents,\r\n entity.CurrencyCode,\r\n spanner.CommitTimestamp, // Use Spanner commit timestamps\r\n }\r\n \r\n return spanner.Insert(c.tableName, cols, vals), nil\r\n}'), ('language', ''), ('caption', <wagtail.rich_text.RichText object at 0x7f8e31a4f0d0>)])]>

    By establishing a rigid, deterministic contract between the DAO and the Spanner SDK (spanner.Mutation), we created an exact target specification that an AI coding agent could reason about and generate reliably.

    Why use Antigravity CLI in headless mode?

    Interactive AI chat interfaces in IDEs work well for exploratory coding, but they are poorly suited for systematic, multi-file code updates across an entire codebase. When you need to apply repeatable refactoring to dozens of targets without missing edge cases, you need automated workflows.

    We addressed this by building an orchestration script (migration_ui.py) that runs Antigravity CLI in headless mode (-p).

    Headless mode lets Antigravity run directly inside shell scripts, continuous integration pipelines, and background automation jobs without requiring manual terminal prompts. This approach helped us scale our work in three key ways:

    • Deterministic prompt architectures: We treated our prompts as version-controlled engineering artifacts. We codified precise rules handling common Spanner edge cases — such as timestamp serialization, nullability conversions, mutation ambiguity, and FakeTimeSource test injection — directly into reusable prompt templates.

    • Batch execution and automated verification: Our orchestration script takes a target DAO name as input, retrieves the existing single-write source code and schema, and feeds it to headless Antigravity alongside our structural conventions. Antigravity generates the new converter, the refactored dual-write DAO, and corresponding unit tests. The script then runs blaze test. If a linter error or test assertion fails, the error log feeds directly back into Antigravity for self-correction.

    • Overnight execution at scale: Because the loop runs unattended, engineers can queue up 10 DAOs at the end of the day. By morning, the pipeline generates, tests, and validates 10 clean changelists ready for human code review.

    Results and key takeaways for cloud engineers

    Combining Spanner's distributed database primitives with Antigravity CLI's headless automation produced clear benefits across our engineering organization:

    • Significant reduction in migration effort: DAO dual-write migrations that previously required extensive manual coding and testing were completed and reviewed in a fraction of the time 

    • Highly reliable data migration: Because every generated DAO adhered to the exact same tested MutationConverter pattern and underwent automated unit testing against Spanner test doubles, we sustained high data fidelity during our extensive migration testing. 

    • Focus on higher-value engineering: Engineers avoided repetitive boilerplate refactoring, giving them time to focus on data modeling, architectural resilience, and performance optimization.

    Three tips for your next database migration

    1. Decouple schema translation first: Before writing migration scripts, define a strict interface (like our MutationConverter) that isolates your new cloud database SDK requirements from your existing business logic. AI agents work best when given clear, bounded design patterns.

    2. Move from interactive chat to headless automation: When executing repetitive refactoring across more than three or four files, invest in scripted, headless workflows. Treating prompt inputs and test verifications as automated build steps help maintain quality and consistency.

    3. Let the build system act as your guardrail: Connect your AI generation loop directly to your build and test harness (bazel test or go test). This lets the model fix compile and assertion errors before a developer reviews the code.

    Get started

    Whether you’re migrating financial systems or building cloud-native applications from scratch, Spanner and Antigravity provide a foundation for scalable software development.

    •  

    Announcing the Google Gen AI SDK for Kotlin 1.0: Idiomatic multiplatform access to Gemini

    Integrating modern generative AI capabilities into Kotlin applications shouldn't require juggling raw HTTP clients or bridging disparate Java libraries. Today, we're excited to announce the 1.0 release of the Google Gen AI SDK for Kotlin (google-genai-kotlin). You can dive right into the code, explore runnable samples, and star the project today on GitHub at googleapis/kotlin-genai.

    Built from the ground up as a Kotlin Multiplatform (KMP) library, the SDK brings idiomatic Kotlin paradigms (including first-class Coroutines, asynchronous Flow streaming, and immutable data classes with named and default parameters) to developers specifically targeting the JVM (backend services, serverless functions, desktop).

    The SDK provides a unified surface to interact with both the Gemini Developer API (Google AI Studio) and the Gemini Enterprise Agent Platform (on Google Cloud) with minimal configuration tweaks.

    Although this SDK is a Kotlin Multiplatform library, using it directly from a mobile app is blocked for security reasons. Instead, use Firebase AI Logic for direct access to Gemini models from mobile apps.

    1. Getting started: Adding the dependency

    The SDK is published to Maven Central under com.google.genai:google-genai-kotlin.

    Kotlin Multiplatform (KMP)

    For multiplatform applications, add the dependency to your commonMain source set:

    code_block
    <ListValue: [StructValue([('code', '// build.gradle.kts\r\nkotlin {\r\n sourceSets {\r\n commonMain.dependencies {\r\n implementation("com.google.genai:google-genai-kotlin:1.0.0")\r\n }\r\n }\r\n}'), ('language', ''), ('caption', <wagtail.rich_text.RichText object at 0x7f8e319d5fd0>)])]>

    Standard JVM projects

    For single-platform Kotlin projects, Gradle automatically selects the optimal variant via Gradle Module Metadata:

    code_block
    <ListValue: [StructValue([('code', '// build.gradle.kts\r\ndependencies {\r\n implementation("com.google.genai:google-genai-kotlin:1.0.0")\r\n}'), ('language', ''), ('caption', <wagtail.rich_text.RichText object at 0x7f8e3157c990>)])]>

    2. Unary and streaming text generation and chat

    The primary entry point is the Client class. It manages HTTP connections and authentication automatically based on your environment variables (GEMINI_API_KEY or GOOGLE_API_KEY for Google AI Studio, and GOOGLE_GENAI_USE_ENTERPRISE=true with standard Google Cloud Application Default Credentials).

    Single prompt request with Gemini Flash

    Using Kotlin's use extension ensures the client's underlying network engine and HTTP connections are released cleanly:

    code_block
    <ListValue: [StructValue([('code', 'import com.google.genai.kotlin.Client\r\nimport kotlinx.coroutines.runBlocking\r\n\r\nfun main() = runBlocking {\r\n Client().use { client ->\r\n val response = client.models.generateContent(\r\n model = "gemini-flash-latest",\r\n text = "Explain quantum entanglement in two sentences."\r\n )\r\n\r\n println(response.text)\r\n }\r\n}'), ('language', ''), ('caption', <wagtail.rich_text.RichText object at 0x7f8e3157fd50>)])]>

    Low-latency streaming with Coroutines Flow

    For interactive UIs and responsive CLI tools, generateContentStream returns a cold Kotlin Coroutine Flow<GenerateContentResponse>, delivering token chunks in real time:

    code_block
    <ListValue: [StructValue([('code', 'import com.google.genai.kotlin.Client\r\nimport kotlinx.coroutines.runBlocking\r\n\r\nfun main() = runBlocking {\r\n Client().use { client ->\r\n val responseFlow = client.models.generateContentStream(\r\n model = "gemini-flash-latest",\r\n text = "Outline the key architectural patterns for microservices on Google Cloud."\r\n )\r\n\r\n responseFlow.collect { chunk ->\r\n chunk.text?.let { print(it) }\r\n }\r\n println()\r\n }\r\n}'), ('language', ''), ('caption', <wagtail.rich_text.RichText object at 0x7f8e3157d910>)])]>

    Multi-turn conversations (chat)

    Managing conversation history manually across request turns can become tedious. The SDK includes a dedicated chats service that automatically maintains context, appends turns, formats conversation history, and handles function calling:

    code_block
    <ListValue: [StructValue([('code', 'import com.google.genai.kotlin.Client\r\nimport com.google.genai.kotlin.types.Content\r\nimport com.google.genai.kotlin.types.GenerateContentConfig\r\nimport kotlinx.coroutines.runBlocking\r\n\r\nfun main() = runBlocking {\r\n Client().use { client ->\r\n val config = GenerateContentConfig(\r\n systemInstruction = Content.fromText("You are an expert Google Cloud Solutions Architect.")\r\n )\r\n\r\n // Create a multi-turn chat session\r\n val chat = client.chats.create(\r\n model = "gemini-flash-latest",\r\n config = config\r\n )\r\n\r\n // Turn 1\r\n val firstResponse = chat.sendMessage("We are designing an event-driven ingestion pipeline on Google Cloud.")\r\n println("Gemini: ${firstResponse.text}\\n")\r\n\r\n // Turn 2: context from the first turn is included automatically\r\n val secondResponse = chat.sendMessage("Which managed messaging service should we choose: Pub/Sub or Kafka?")\r\n println("Gemini: ${secondResponse.text}\\n")\r\n }\r\n}'), ('language', ''), ('caption', <wagtail.rich_text.RichText object at 0x7f8e3157f590>)])]>

    You can also use chat.sendMessageStream(...) for streaming multi-turn chat responses.

    3. Multimodal analysis grounded with Google Search

    Gemini's multimodal reasoning is especially effective when combined with external verification. For instance, when analyzing technical, medical, or scientific diagrams, you can attach Google Search Grounding to cross-check factual claims against live web sources.

    code_block
    <ListValue: [StructValue([('code', 'import com.google.genai.kotlin.Client\r\nimport com.google.genai.kotlin.types.*\r\nimport java.io.File\r\nimport kotlinx.coroutines.runBlocking\r\n\r\nfun main() = runBlocking {\r\n Client().use { client ->\r\n val imageBytes = File("src/main/resources/medical_diagram.png").readBytes()\r\n\r\n val content = Content(\r\n parts = listOf(\r\n Part(inlineData = Blob(mimeType = "image/png", data = imageBytes)),\r\n Part(text = "Is this anatomical diagram accurate? Verify labels against authoritative medical sources.")\r\n )\r\n )\r\n\r\n // Enable Google Search as a grounding tool\r\n val config = GenerateContentConfig(\r\n tools = listOf(Tool(googleSearch = GoogleSearch()))\r\n )\r\n\r\n val response = client.models.generateContent(\r\n model = "gemini-flash-latest",\r\n content = content,\r\n config = config\r\n )\r\n\r\n println("=== Analysis ===")\r\n println(response.text)\r\n\r\n // Inspect citations and search queries\r\n val grounding = response.groundingMetadata\r\n println("\\n=== Search Queries Executed ===")\r\n grounding?.webSearchQueries?.forEach { println("- $it") }\r\n\r\n println("\\n=== Grounding Sources ===")\r\n grounding?.groundingChunks?.mapNotNull { it.web }?.forEach { source ->\r\n println("- ${source.title}: ${source.uri}")\r\n }\r\n }\r\n}'), ('language', ''), ('caption', <wagtail.rich_text.RichText object at 0x7f8e3157e550>)])]>

    4. Visual generation and conversational editing: The Gemini 3 image family

    The SDK provides full support for Google's latest image generation models (popularly known as the Nano Banana series of models on leaderboards).

    Generating and Saving an Image

    Generated image bytes are delivered directly in the response parts as a Blob:

    code_block
    <ListValue: [StructValue([('code', 'import com.google.genai.kotlin.Client\r\nimport java.io.File\r\nimport kotlinx.coroutines.runBlocking\r\n\r\nfun main() = runBlocking {\r\n Client().use { client ->\r\n val response = client.models.generateContent(\r\n model = "gemini-3.1-flash-image", // Nano Banana 2\r\n text = "A photorealistic blueprint of an eco-friendly modern datacenter, isometric view, 4k"\r\n )\r\n\r\n val imagePart = response.parts?.firstOrNull { it.inlineData != null }\r\n imagePart?.inlineData?.data?.let { bytes ->\r\n File("datacenter_blueprint.png").writeBytes(bytes)\r\n println("Image generated and saved successfully.")\r\n }\r\n }\r\n}'), ('language', ''), ('caption', <wagtail.rich_text.RichText object at 0x7f8e3157f950>)])]>

    Conversational image-to-image editing

    You can pass existing images and conversational edit instructions in the same request:

    code_block
    <ListValue: [StructValue([('code', 'val originalImage = File("input.png").readBytes()\r\n\r\nval editPrompt = Content(\r\n parts = listOf(\r\n Part(inlineData = Blob(mimeType = "image/png", data = originalImage)),\r\n Part(text = "Change the daylight illumination to a dramatic twilight skyline with illuminated windows.")\r\n )\r\n)\r\n\r\nval editResponse = client.models.generateContent(\r\n model = "gemini-3-pro-image", // Nano Banana Pro\r\n content = editPrompt\r\n)'), ('language', ''), ('caption', <wagtail.rich_text.RichText object at 0x7f8e3157d590>)])]>

    5. Real-time bidirectional interaction with Gemini Live

    For low-latency voice, audio, and live multimodal interactions, the SDK supports the Gemini Live API via persistent WebSocket connections using client.live.connect(...):

    code_block
    <ListValue: [StructValue([('code', 'import com.google.genai.kotlin.Client\r\nimport com.google.genai.kotlin.types.AudioTranscriptionConfig\r\nimport com.google.genai.kotlin.types.LiveConnectConfig\r\nimport kotlinx.coroutines.launch\r\nimport kotlinx.coroutines.runBlocking\r\n\r\nfun main() = runBlocking {\r\n Client().use { client ->\r\n val model = if (client.enterprise) "gemini-live-2.5-flash-native-audio"\r\n else "gemini-3.1-flash-live-preview"\r\n\r\n val config = LiveConnectConfig(\r\n outputAudioTranscription = AudioTranscriptionConfig()\r\n )\r\n\r\n // Establish real-time bidirectional WebSocket session\r\n client.live.connect(model, config).use { session ->\r\n println("Connected to Gemini Live session!")\r\n\r\n // Launch collector for server messages (audio and text transcriptions)\r\n val receiveJob = launch {\r\n session.receive().collect { serverMessage ->\r\n serverMessage.serverContent?.outputTranscription?.text?.let { text ->\r\n print(text)\r\n }\r\n }\r\n }\r\n\r\n // Stream real-time text (or raw PCM audio blobs via session.sendRealtimeInput(audio = ...))\r\n session.sendRealtimeInput(text = "Hello Gemini! Give me a 5-second motivational quote.")\r\n\r\n // When finished, clean up\r\n receiveJob.cancel()\r\n session.closeSession()\r\n }\r\n }\r\n}'), ('language', ''), ('caption', <wagtail.rich_text.RichText object at 0x7f8e3157fd90>)])]>

    6. Structured tool and function calling

    When building agentic workflows or bridging LLMs with backend microservices, developers can pass structured JSON schemas via FunctionDeclaration. The model will intelligently select when to invoke the tool:

    code_block
    <ListValue: [StructValue([('code', 'val telemetryTool = FunctionDeclaration(\r\n name = "getDatacenterMetrics",\r\n description = "Fetch real-time CPU and thermal telemetry for a Google Cloud region",\r\n parameters = Schema(\r\n type = Type.OBJECT,\r\n properties = mapOf("region" to Schema(type = Type.STRING)),\r\n required = listOf("region")\r\n )\r\n)\r\n\r\nval response = client.models.generateContent(\r\n model = "gemini-flash-latest",\r\n text = "Check telemetry for europe-west1",\r\n config = GenerateContentConfig(\r\n tools = listOf(Tool(functionDeclarations = listOf(telemetryTool)))\r\n )\r\n)\r\n\r\nresponse.functionCalls?.firstOrNull()?.let { call ->\r\n println("Model triggered tool: ${call.name} with arguments: ${call.args}")\r\n}'), ('language', ''), ('caption', <wagtail.rich_text.RichText object at 0x7f8e3157f850>)])]>

    Additionally, when using the chats service, you can take advantage of Automatic Function Calling (AFC), which means that functions declared in the chat conversation can be invoked automatically and transparently by the SDK on your behalf, as you can see in the following example:

    code_block
    <ListValue: [StructValue([('code', 'fun main() = runBlocking {\r\n // A mocked function\r\n val getWeather = callableFunction("get_weather", paramName = "city") { city: String ->\r\n "18 degrees and sunny in $city"\r\n }\r\n\r\n Client().use { client ->\r\n val chat = client.chats.create(\r\n model = "gemini-flash-latest",\r\n automaticFunctionCalling = AutomaticFunctionCalling(getWeather),\r\n )\r\n\r\n // SDK calls get_weather if needed in this conversation\r\n println(chat.sendMessage("What is the weather in Zurich?").text)\r\n }\r\n}'), ('language', ''), ('caption', <wagtail.rich_text.RichText object at 0x7f8e3157cc90>)])]>

    What's next?

    With the 1.0 release of the Google Gen AI SDK for Kotlin, Kotlin developers across backend server ecosystems (Ktor, Spring Boot, Quarkus, Micronaut) now have a clean, multiplatform foundation for building generative AI applications.

    To learn more and get started, check out the following resources:

    We look forward to seeing what you build with Kotlin and Gemini!

    •  

    Simplify your resilience testing strategy with Fault Injection Testing

    When databases fail and network paths falter, you still need your mission-critical cloud services to stay online. Yet guaranteeing high availability has become increasingly difficult because of the complexity of modern distributed systems. 

    To help you maintain availability and reliability during adverse events, we’re announcing Fault Injection Testing in preview. Fault Injection Testing is designed to help developers and architects automate failure testing to ensure predictable behavior during disruptions. 

    By deliberately introducing faults into your environment, you can verify your safety mechanisms before an actual outage impacts your customers.

    Why native resilience testing matters

    Unlike in self-hosted data centers, cloud applications offer less direct access to underlying infrastructure to facilitate failover testing.

    Without native tools to prove your application can survive a failure, you risk a critical gap in your reliability strategy that exposes you to several risks:

    • Damaged trust and reputation: Frequent failures or poor performance lead to customer dissatisfaction and long-term damage to your brand's image.

    • Compliance and regulatory penalties: For many industries, particularly financial institutions, failing to prove disaster recovery capabilities can lead to non-compliance, audits, and fines.

    • Migration delays: Large-scale migrations often stop when teams cannot verify that critical applications will remain stable during a zone failure.

    How Fault Injection Testing works

    Fault Injection Testing allows you to run experiments by creating experiment templates. These templates act as blueprints, defining the specific fault to be injected and the resources that will be targeted for the experiment.

    In this public preview, you can test two primary failure scenarios:

    • Failover Cloud SQL: This fault triggers a failover of a high availability Cloud SQL instance from the primary zone to a standby zone.

    • Degrade application traffic: This allows you to selectively add latency and HTTP error codes through an Application Load Balancer. 

    Before any fault is injected, Fault Injection Testing performs an automated dry run. This read-only simulation checks your permissions and provides an up-to-date list of every resource that will be affected. 

    Once you verify the scope, you can manually start the injection. The duration you defined in the template will run its course, and the faults will be reverted at the expiration of the timer.  

    During the experiment, you can verify that your application is behaving as you planned.  If things do not go as planned, you can use the stop and revert capability to immediately halt the experiment and begin restoring resources to their normal state.

    During preview, we recommend as a best practice to use Fault Injection Testing (FIT) in a non-production environment. Preview is an opportunity to get early access to learn how the service fits and complements your existing testing practices, and to provide us with your feedback to improve the product as well!

    Built for the enterprise

    Partners like KeyBank and Servier are already using Fault Injection Testing to validate their deployments. By using native fault injection, these organizations can approximate demanding failure scenarios — such as zonal outages — to help ensure their services remain stable.

    Get started with Fault Injection Testing

    Fault Injection Testing is available through the Google Cloud console, the gcloud CLI, and REST APIs.

    1. Request preview access: Talk to your Google Cloud Account Team to add your project to the preview.

    2. Enable the API: Search for "Fault Testing API" in your Google Cloud console and select enable.

    3. Assign roles: Ensure your team has the roles/faulttesting.operator role to configure and run experiments.

    4. Run your first dry run: Create a template for a Cloud SQL or load balancer resource in a non-production environment and execute a dry run to see the potential impact.

    For more details on implementation, talk to your account team, or view the User Guide for Fault Injection Testing.

    •  

    How Uber improves network reliability while unblocking cloud migration

    Uber has a lot in common with the cities it serves. Both are always changing and growing, both must carefully manage the resulting traffic to prevent congestion and sprawl.

    Uber has continuously evolved its technical strategies to manage its expanding network, and this careful planning and constant evolution helps ensure that application traffic across its entire platform runs smoothly. Ultimately, maintaining a reliable, high-scale platform that operates seamlessly at any given time is key to preserving user trust.

    One important solution in this effort has been application awareness on Cloud Interconnect. An industry-first tool for application prioritization across hybrid networks, application awareness on Cloud Interconnect has helped Uber prioritize critical traffic to ensure business continuity during potential network congestion events. 

    Uber acted as an early design partner for application awareness on Cloud Interconnect, helping ensure that this capability met the demands of Uber’s global-scale operations. It not only improved Uber’s daily operations, it also gave Uber the confidence to move forward with a Google Cloud migration, with confidence that there would be less risk of service interruptions during switchovers. 

    In this post, we’ll explain the features Uber most sought and why, the inner workings of application awareness on Cloud Interconnect, and how it can help other organizations as well.

    Prioritizing critical traffic

    When migrating distributed, hybrid, or multicloud applications at a global scale, network reliability becomes a primary concern. Even the most worthwhile migrations may not seem worth it if such migrations interrupt ongoing service. For organizations like Uber, moving vast amounts of data to support large data analytics workload — including emerging AI use cases — can saturate network links, resulting in increased reliability risk for their critical application traffic. 

    With standard cloud interconnect approaches, enterprises typically apply simple bandwidth overprovisioning to meet extreme infrastructure needs. But with today's hybrid cloud demands, and given the size of an organization like Uber, overprovisioning network capacity for peak usage is often too costly and unreliable. 

    The shortcomings of overprovisioning only become magnified with the integration of cutting-edge AI innovations. Uber needs systems in place that can take on massive data transfers without congesting its network and protecting the performance of business-critical applications.

    With the benefit of application awareness on Cloud Interconnect, including the four major features of application awareness — traffic handling, congestion response, latency management, and cost efficiency — Uber was able to achieve the networking optimization its modern tech stack requires.

    aai concept value prop with_without picture

    Starting with a private preview, Uber deployed this feature across its infrastructure, beginning with Google Cloud Interconnect deployments in Phoenix, Arizona, and Ashburn, Virginia. Application awareness on Cloud Interconnect allows Uber to classify and prioritize end-user application traffic over less time-sensitive data using DSCP marking and configured queuing profiles.

    In the following chart, we look at the four key features of application awareness on Cloud Interconnect, how they differ from legacy approaches, and how they help provide better operational continuity for organizations like Uber. 

    Feature

    Standard interconnect solutions

    Application awareness on Cloud Interconnect

    Traffic handling

    All traffic treated equally (first-in, first-out)

    Traffic classified into six distinct traffic classes

    Congestion response

    High-priority application traffic may be dropped during bursts

    Business-critical traffic is protected via strict priority or bandwidth sharing policies

    Latency management

    Unpredictable latency for high priority applications

    Predictable and consistent low-latency for time-sensitive workloads

    Cost efficiency

    Requires expensive overprovisioning to absorb peaks

    Efficient bandwidth utilization and lower TCO

    Uber's key takeaways

    For Uber, the business value of being able to prioritize business-critical traffic on its networks by deploying application awareness on Cloud Interconnect was immediate. And in doing so, Uber has also created a blueprint that other enterprises with similar hybrid cloud challenges can replicate. The core elements of that blueprint include:

    • Ensuring business continuity: Uber can decide in real time which application traffic to prioritize during major, high-traffic events. This means that mission critical applications stay up and running during even extreme events (both planned and unplanned). Uber leadership has called application awareness on Cloud Interconnect important for its global operations. 

    • Efficient bandwidth utilization: Instead of blindly overprovisioning bandwidth to prevent congestion, application awareness allows Uber to better utilize their existing Cloud Interconnect capacity aligned with their expected network bandwidth needs. The result is lower total cost of ownership for network infrastructure.

    • Unblocked workload migration: By protecting critical applications from network congestion, Uber was able to migrate significant workloads to Google Cloud and, in the process, dramatically reduce operational overhead.

    "Application awareness on Cloud Interconnect was the key that unlocked our ability to migrate more strategic workloads to Google Cloud and is critical for maintaining service reliability during peak global demand. By allowing us to intelligently prioritize traffic, it helps us ensure that we can protect our higher priority services and make our infrastructure more efficient, lowering our total cost of ownership. This wasn't just a feature deployment; it was a deep engineering partnership that delivered a solution critical to our business." – Harry Liu, Director of Engineering, Uber

    Securing network reliability for AI and beyond

    As more enterprises integrate cloud-based AI models, distributed applications, and data analytics, it's becoming a business imperative to be ready to handle the massive data transfers that follow. But in doing so, they also have to ensure they never compromise the reliability of their critical applications. 

    With application awareness on Cloud Interconnect, Uber demonstrated that moving beyond simple bandwidth overprovisioning to protect business-critical traffic was an essential step to building the stability required to embrace modern hybrid and multicloud strategies.

    You can read our blog about the potential of Cloud Interconnect across industries to learn more about what the service can bring to your organization, and if you’re ready to explore more, our team of networking and industry experts are ready to help.

    •  

    Your chance to start building AI agents from the absolute basics

    Have you been hearing a lot about "AI agents" lately but aren't sure how to actually start building them? You don't need a background in machine learning or years of software experience to get started. The best way to learn is by doing, which is why we built Agent Valley.   

    Agent Valley is a free, 5-week live learning series designed to take you from scratch to building your very own hands-on agent systems. And instead of staring at boring terminal lines, you’ll be building and playing inside a tiny, low-poly virtual world!

    Meet your instructor

    You’ll be learning directly from Annie Wang, one of our top Google DevRel Engineers. She designed this course from the ground up to be fully hands-on, interactive, and beginner-friendly. If you want to learn how AI systems are built by the people actually designing them at Google, this is your chance.

    How we'll learn together

    You’ll learn by building in a split-screen workspace on your laptop. On Day 1, you'll describe and summon a custom low-poly companion that serves as your play character and save file. As you guide your companion through the valley's five districts, a live Runtime Inspector sits right beside the game, showing you exactly what the AI is thinking, deciding, and costing in real-time. Setup is completely zero-stress. Google will provide the environment for running these exercises, so you can dive straight into building.

    Agent 101 Live with 5 modular sessions (Jump in anytime!) 

    • Week 1: The Summoning Grove (CONTROL) · Get started by summoning your companion and learning how to keep its memory and traits consistent across a conversation.

    • Week 2: The Buildyard (DECOMPOSE) · Learn how to break a big project down so multiple AI assistants can work together in parallel without stepping on each other's toes.

    • Week 3: Market Street (COORDINATE) · Open up a virtual shop! You'll learn how to write reliable code so transactions and returns go smoothly without crashing.

    • Week 4: The Archive (REMEMBER) · Give your companion a memory. Learn how to help your agent remember past details without getting confused or making things up.

    • Week 5: The Night Market (LIVE) · The grand finale. Learn how to make your agent react live to events in the world (like fireworks or stage lights) while keeping the system fast and affordable.              

    agent-valley-roadmap-2160x2700

    Join the livestream    

    • 5 Tue starting Sep 1 · 10:00 AM (Pacific Time)
    • Anyone new to AI agents who wants to learn by coding and playing.                                                       
    • RSVP Here: goo.gle/agent101

    •  

    10 questions every startup should answer before moving to production with their AI prototype

    It’s never been easier to start an AI-powered startup on Google Cloud. 

    You grab an API key from Google AI Studio at breakfast, paste it into Antigravity, and by lunch you’ll have a nascent prototype of your product.

    But it’s not all one straight line to progress. It's common to bump into these three challenges as you build out your stack:

    • A leaked API key racks up a large bill in 48 hours.

    • A "quick" migration from AI Studio to Gemini Enterprise Agent Platform stalls the roadmap for weeks because nobody on the team owns Identity and Access Management (IAM).

    • The launch works, until the app starts returning HTTP 429 Too Many Requests because of default per-project quotas, and there's no clean path to more capacity without paying a premium.

    None of these are unique edge cases. . They're  default failure modes of moving fast without a plan, and we've all done it at least once.

    Below are the 10 questions every startup should be ready to answer before they scale,  grouped into the three phases where decisions can shape your future: 

    1. Onboard (setting up your own projects and identities right)

    2. Scale (getting more throughput without breaking the bank) 

    3. Govern (keeping costs, keys, and agents from running away).

    These ten are scoped to the prototype-to-production transition itself. Each question ends with a short, runnable snippet you can copy into your own project today. Adjacent decisions that matter just as much but aren't specific to that move, your data layer and RAG architecture, CI/CD, network design, are deliberately out of frame here.

    Onboard: get the foundation right (in the first hour).

    #1 Where should I start: Google AI Studio or Gemini Enterprise Agent Platform?

    Both surfaces expose the same Gemini family of models, but they solve different problems.

    • Google AI Studio (with the Gemini Developer API) is the fastest path from an idea to working code. A browser IDE, an API key, a generous free tier, and no cloud project to configure. It's where most ideas should start, and Google's own guidance says as much.

    • Gemini Enterprise Agent Platform (formerly Vertex AI) has the same Gemini models (plus 3rd party and OSS ones)  with enterprise controls around them: IAM and service-account auth instead of raw keys, VPC Service Controls, Cloud Logging and Monitoring, reserved capacity, regional endpoints, and the compliance surface your first enterprise customer's security review will ask about.

    The right answer for most startups is both, sequenced deliberately: first prototype in AI Studio, then migrate before you have real users. The danger for startups is treating them as interchangeable solutions, AI Studio's simple key model does not translate to enterprise controls, and Agent Platform's IAM model might look like overkill until the day it saves you from a stolen-credential incident.

    It's less work than it sounds like.

    The unified google-genai SDK targets both:

    code_block
    <ListValue: [StructValue([('code', '# Prototype: Google AI Studio, raw API key\r\nfrom google import genai\r\nclient = genai.Client(api_key="YOUR_AI_STUDIO_KEY")\r\n\r\n# Production: GEAP, no key — uses Application Default Credentials (ADC)\r\nfrom google import genai\r\nclient = genai.Client(\r\n vertexai=True,\r\n project="my-startup-prod",\r\n location="us-central1",\r\n)\r\n\r\nresp = client.models.generate_content(\r\n model="gemini-2.5-pro",\r\n contents="Summarize this contract in three bullets.",\r\n)\r\nprint(resp.text)'), ('language', ''), ('caption', <wagtail.rich_text.RichText object at 0x7f7dba9f2d90>)])]>

    #2  How do I set up a Google Cloud project without becoming an IAM expert?

    The biggest reason startups stall on the migration to Agent Platform isn't the code, it's the operational leap from "here's an API key" to a cloud project with folders, service accounts, org policies, logging, and IAM bindings. If your team doesn't have a dedicated cloud admin, that first project setup can eat a week of engineering time. 

    Three moves cut that dramatically:

    1. Use an opinionated project template instead of clicking through the console. The Cloud Setup checklist and the Google Cloud Architecture Framework give you a production-grade folder hierarchy (prod / non-prod / dev), a central logging + monitoring project, Security Command Center turned on, and baseline org policies, without you having to design them from scratch.

    2. Enable the APIs you'll actually use, once. Batch it so you're not doing it project-by-project when you need it. The billing-link step is not optional. Every paid API you're about to enable will refuse to activate on a project with no billing account attached, so we handle that first.

    3. Let Gemini pick the roles, but ask it for the narrow ones. You don't have to memorize the roles reference. In the Grant access dialog, Help me choose roles lets you describe the task in plain language, "this service account needs to call Gemini models and read one Cloud Storage bucket", and get predefined roles back with the reasoning shown. One catch worth knowing on day one: by default it suggests roles that cover common journeys, which usually means a service's Admin, Editor, or Viewer. Those are broader than you want. Say "least privileged" or "narrowest access" in the prompt and it returns granular roles instead. Same amount of typing, considerably smaller blast radius when a credential leaks.

      Sources: Get predefined role suggestions with Gemini assistance

    code_block
    <ListValue: [StructValue([('code', '# One-shot: create a Vertex-ready project and turn on the services a\r\n# typical AI startup uses.\r\ngcloud projects create my-startup-prod --name="My Startup (prod)"\r\ngcloud config set project my-startup-prod\r\n\r\n# REQUIRED before enabling billing-dependent APIs (aiplatform, run, etc.).\r\n# Use `gcloud billing accounts list` to find your billing account ID.\r\ngcloud billing projects link my-startup-prod --billing-account=012345-6789AB-CDEF01\r\n\r\ngcloud services enable \\\r\n aiplatform.googleapis.com \\\r\n run.googleapis.com \\\r\n artifactregistry.googleapis.com \\\r\n logging.googleapis.com \\\r\n monitoring.googleapis.com \\\r\n secretmanager.googleapis.com \\\r\n cloudbilling.googleapis.com'), ('language', ''), ('caption', <wagtail.rich_text.RichText object at 0x7f7dba9f2af0>)])]>

    Sources: gcloud services enable reference, · gcloud billing projects link (GA),  GE Agent Platform environment setup.

    If you're a solo founder, resist the urge to build in your personal GCP account. Create a proper organization or self-owned org first, then create the project inside it. That single decision can make everything else, fromIAM to billing and audit, dramatically easier.

    #3 I'm on Google Cloud, how should my code actually authenticate: API keys, service accounts, or user credentials?

    There's a hierarchy of safety here, and the easiest option is rarely the right one in production.

    • Raw API keys are fine for local prototyping. They are dangerous in production because they are long-lived, easy to leak into a client bundle or a public repo, and grant unbounded access until you notice.

    • User credentials via OAuth (application default credentials) are best for interactive tools, CLIs, and any code that runs on a developer's laptop.

    • Service accounts with least-privilege IAM roles are the right answer for anything running on a server, in a container, or in a scheduled job.

    The pattern you're aiming for is one where your code never sees a key at all. It just calls the Google Auth library, which quietly reads Application Default Credentials (ADC) from the environment,  a short-lived token minted for whichever service account is attached to your Cloud Run service, GKE workload, or Compute Engine VM. You get enterprise-grade auth without writing any auth code.

    code_block
    <ListValue: [StructValue([('code', '# On a developer laptop\r\ngcloud auth application-default login\r\n\r\n# On a server (Cloud Run, GKE, etc.) — no login, no key file.\r\n# Attach a service account with just the roles the app needs.\r\ngcloud run deploy my-agent \\\r\n --image=us-docker.pkg.dev/my-startup-prod/agents/api:v1 \\\r\n --service-account=agent-runtime@my-startup-prod.iam.gserviceaccount.com \\\r\n --region=us-central1'), ('language', ''), ('caption', <wagtail.rich_text.RichText object at 0x7f7dba9f2970>)])]>
    code_block
    <ListValue: [StructValue([('code', '# Application code — notice: no keys, no secrets.\r\nfrom google import genai\r\n\r\nclient = genai.Client(\r\n vertexai=True,\r\n project="my-startup-prod",\r\n location="us-central1",\r\n)'), ('language', ''), ('caption', <wagtail.rich_text.RichText object at 0x7f7dba9f28e0>)])]>

    Do one last favor to your future self: give that service account the minimum IAM role your workload actually needs,  usually roles/aiplatform.user for calling models, not the broader admin roles. It takes an extra 30 seconds and prevents the credential from becoming a master key if it leaks.

    #4 When should I actually stop procrastinating and migrate from AI Studio's API key to Agent Platform's IAM model?

    Sooner than you'd like,  and the correct trigger is not when it breaks. It's when any of these is true:

    • Your key has left your laptop (checked into a repo, pasted into a Slack, shipped in a mobile app).

    • You have more than one person on the team who needs to call the API.

    • You're spending more than a few hundred dollars a month.

    • You're about to onboard paying customers.

    A potential pitfall that can catch growing startups off guard is simple: a leaked Gemini API key on an account that normally spends $180 a month gets scraped from a public repo and used to run distillation attacks,  accumulating tens of thousands of dollars in charges before the owner even sees the first billing alert. The Google Cloud Shared Responsibility Model is unambiguous: the customer is liable for charges incurred with their own valid credentials.

    The migration itself is genuinely smaller than the anxiety around it. In google-genai it's the two-line change shown in #1. What takes real time is the project setup around it, which is exactly why #2 exists.

    Practical checklist for cutover day:

    code_block
    <ListValue: [StructValue([('code', '# 1. Revoke every existing AI Studio key that has ever left a laptop.\r\n# (Go to https://aistudio.google.com/apikey and delete them.)\r\n\r\n# 2. Confirm your production code has no api_key= arguments.\r\ngrep -rn "api_key" src/\r\n\r\n# 3. Enable GEAP and confirm ADC works locally.\r\ngcloud services enable aiplatform.googleapis.com\r\ngcloud auth application-default login\r\npython -c "\r\nfrom google import genai\r\nc = genai.Client(vertexai=True, project=\'my-startup-prod\', location=\'us-central1\')\r\nprint(c.models.generate_content(model=\'gemini-2.5-flash\', contents=\'ping\').text)\r\n"'), ('language', ''), ('caption', <wagtail.rich_text.RichText object at 0x7f7dba9f2640>)])]>

    If step 3 prints a response, you're on Agent Platform.

    Scale: get more capacity without paying a premium.

    #5 Now that I'm shipping, why on earth am I getting all these HTTP 429 errors, and how do I make them stop?

    429 Too Many Requests from Agent Platform almost always means one of two things:

    1. You've hit the Dynamic Shared Quota (DSQ) ceiling for your project's tier. DSQ is a shared pool sized against your project's history,  new projects start with modest limits by design, to prevent abuse across the platform.

    2. You're calling a global endpoint during a global demand spike, competing with worldwide traffic for shared capacity.

    The instinctive reaction is to file a quota-increase ticket. You can do that if you must,  but two architectural moves usually solve the problem faster and cheaper.

    Pin to a regional endpoint. Over half of startup traffic on Agent Platform defaults to global routing. Pinning to a specific region (say us-central1) sidesteps global contention and typically improves latency at the same time. (One narrow exception, which we'll get to in the next question: if you specifically want Priority PayGo, that feature currently only ships on the `global` endpoint. For everything else, pin regionally.):

    code_block
    <ListValue: [StructValue([('code', 'from google import genai\r\n\r\n# Global (default): competes against worldwide demand.\r\n# Regional: routes only to the regional cluster, less contention.\r\nclient = genai.Client(\r\n vertexai=True,\r\n project="my-startup-prod",\r\n location="us-central1", # <-- this is the one-line fix\r\n)'), ('language', ''), ('caption', <wagtail.rich_text.RichText object at 0x7f7dba9f2850>)])]>

    Add real retry and backoff. A 429 is a retryable signal, not a fatal error. Any production client should have exponential backoff with jitter. The modern google-genai SDK ships this behavior built in, but only if you actually enable it. This is easy to overlook. Don't reach for the classic `google.api_core.retry.if_transient_error` decorator you may have seen on older Vertex code. It's designed for the legacy exception classes and does not recognize the new `google.genai.errors.APIError,  so it will silently pass 429s through without retrying. Use the SDK's built-in retry options instead:

    code_block
    <ListValue: [StructValue([('code', 'from google import genai\r\nfrom google.genai import types\r\n\r\nclient = genai.Client(\r\n vertexai=True, project="my-startup-prod", location="us-central1",\r\n http_options=types.HttpOptions(retry_options=types.HttpRetryOptions(\r\n attempts=5, initial_delay=1.0, max_delay=60.0, exp_base=2.0, jitter=1.0,\r\n http_status_codes=[408, 429, 500, 502, 503, 504],\r\n ))\r\n)'), ('language', ''), ('caption', <wagtail.rich_text.RichText object at 0x7f7dba9f2280>)])]>

    How do you see this coming?  Preferably not from a user telling you. Agent Platform publishes serving metrics to Cloud Monitoring, and there is a prebuilt dashboard you don't have to assemble: Console → Agent Platform → Dashboard → Model observability. It gives you requests per second, token throughput, first-token latency, and error rates out of the box.

    The metric to actually alert on is aiplatform.googleapis.com/publisher/online_serving/model_invocation_count. It carries an error_category label with values of user, system, or capacity. Alerting on capacity isolates genuine throttling from your own bad requests, which a raw 429 count won't do.

    One thing worth internalizing, because it trips people up: you cannot build a "warn me at 80% of my quota" alert for Standard PayGo. Under Dynamic Shared Quota there is no fixed per-project number to be at 80% of. A 429 means transient contention for shared capacity, not that you crossed a line. Percent-of-limit alerting only becomes meaningful once you're on Provisioned Throughput, which does expose real limit metrics.

    code_block
    <ListValue: [StructValue([('code', 'gcloud monitoring policies create --policy-from-file=capacity-alert.yaml'), ('language', ''), ('caption', <wagtail.rich_text.RichText object at 0x7f7dba9f2f40>)])]>

    Sources: Agent Platform metrics list, Model observability dashboard, RetryOptions source,  core retry_base.py, genai errors.py,  reduce 429 errors, gcloud monitoring policies create, Dynamic Shared Quota.

    Follow the Agent Platform rate limits documentation to understand what your project's current ceiling actually is before you assume you've outgrown it. 

    #6 Which consumption mode do I pay for: Standard PayGo, Priority PayGo, or Provisioned Throughput? 

    Three consumption models, three completely different workload shapes, and three completely different ways to proceed. Picking the right one can help startups see meaningful savings on AI bills. First let’s define them and then see when they are, or aren’t, a good fit:

    Standard PayGo (DSQ): Pay per token from a shared pool; cheap, no guarantees.
    Priority PayGo: Pay per token at a premium to jump the queue.
    Provisioned Throughput (PT): Prepay for reserved capacity; predictable, use it or lose it.

    Consumption type

    Best for

    Watch out for

    Standard PayGo (DSQ)

    Early-stage, low-QPS, spiky prototype traffic

    429s during spikes; no reliability SLO

    Priority PayGo

    Bursty, revenue-critical traffic that can't tolerate 429s

    Roughly 1.8x the standard token price

    Provisioned Throughput (PT)

    Steady, predictable, high-volume production traffic

    Wasted spend if utilization is under ~40%; overflow to PayGo on spikes

    The dominant startup mistake is buying PT too early. Usually  this happens the  week after a big launch when it feels like traffic will only ever go up. PT is reserved capacity. You  pay whether you use it or not, and it only starts paying you back once your baseline is genuinely predictable, not just aspirational.

    Here’s a pragmatic sequence:

    1. Weeks one through four on Standard PayGo. Use it to measure your real request shape (tokens per minute at p50 and p99, request bursts, batchable vs. real-time split).

    2. When you get your first bad 429 storm, flip on Priority PayGo for the traffic that actually matters. It's a config change, not a purchase order,  nobody in procurement needs to be involved:

    code_block
    <ListValue: [StructValue([('code', '# Priority PayGo request: use the global endpoint + two extra headers.\r\nfrom google import genai\r\nfrom google.genai import types\r\n\r\nclient = genai.Client(vertexai=True, project="my-startup-prod", location="global")\r\nresp = client.models.generate_content(\r\n model="gemini-2.5-pro",\r\n contents="Rank these support tickets by urgency: ...",\r\n config=types.GenerateContentConfig(\r\n # Priority PayGo headers, per current GEAP docs.\r\n http_options=types.HttpOptions(headers={"X-Vertex-AI-LLM-Request-Type": "shared", "X-Vertex-AI-LLM-Shared-Request-Type": "priority"}),\r\n ),\r\n)'), ('language', ''), ('caption', <wagtail.rich_text.RichText object at 0x7f7dba9f2130>)])]>

    3. Once you can predict your baseline TPM, buy PT to cover the flat baseline and let anything above it overflow to PayGo. That's the combined pattern Google recommends for exactly this reason. Best of both worlds, not marketing spin.

     Sources: Priority PayGo docs, google-genai HttpOptions source, GEAP REST reference. 

    #7 Which of my requests actually need to be live, and which should be batch jobs?

    Most startup workloads are secretly batch jobs pretending to be real-time. Every one you move off the interactive path frees up DSQ headroom for the traffic that genuinely needs to be fast,  the traffic where a user is actually watching a spinner.

    Three questions to help you sort your traffic:

    • Does a human have to see the result within a second? That means:  Live inference.

    • Can the user wait a few seconds and see a spinner? That means:  Still live, but a candidate for streaming.

    • Would the user tolerate "we'll email you when it's ready" or "check back in a bit"?  That means: Batch prediction.

    Batch prediction on Agent Platform runs in a completely separate queue, does not consume your interactive DSQ, and is typically about half the price of on-demand inference. That's a rare double win: faster live traffic and a lower bill.

    code_block
    <ListValue: [StructValue([('code', '# Kick off a batch prediction job from a JSONL file in Cloud Storage.\r\n# Each line is one prompt; results land in another Cloud Storage prefix.\r\nfrom google import genai\r\nfrom google.genai import types\r\n\r\nclient = genai.Client(vertexai=True, project="my-startup-prod", location="us-central1")\r\n\r\njob = client.batches.create(\r\n model="gemini-2.5-flash",\r\n src="gs://my-startup-prod-batch/inputs/nightly-summaries.jsonl",\r\n config=types.CreateBatchJobConfig(\r\n dest="gs://my-startup-prod-batch/outputs/",\r\n ),\r\n)\r\nprint(job.name, job.state)'), ('language', ''), ('caption', <wagtail.rich_text.RichText object at 0x7f7dba9f2730>)])]>

    Common candidates: nightly document summarization, background classification of new signups, bulk translation, embedding backfills, evaluation runs against your test set. If any of those are on your live path today, moving them is often the single highest-leverage change you can make this week.

    Govern: Keep costs, keys, and agents under control.

    #8 How do I set spend caps that actually reduce cost, and not just send me polite emails while my bill triples?

    Until recently the honest answer was that budgets only notify, and you had to build your own brake pedal. That changed in July. There are now three mechanisms, and you should think of them as layers.

    1. A spend cap budget (Preview). Cloud Billing budgets can now enforce rather than just email. Set a spend cap on a project and, when usage costs cross 100% of the budget, Google pauses the service until you manually lift it. Agent Platform is explicitly on the eligible list, alongside the Gemini API, Cloud Run, and Cloud Run functions. Alerts still fire at 50% and 80%, so the pause isn't a surprise.

    Three things to know before you rely on it:

    • Each cap covers one project and one eligible service. It is not account-wide protection. If you want Agent Platform and Cloud Run both capped, that's two caps. 

    • Enforcement is not instant and is based on estimated costs. Overages past the cap are billed as normal, so set the number below your real ceiling. Lifting it is manual, and service resumption can take up to an hour. It also pauses Provisioned Throughput usage, so if you've prepaid for capacity, a cap hit stops that too.

    • It's in Preview as of publication, and the eligible-service list is documented as growing. Check the current list before you design around it.

    2. A billing budget with a Pub/Sub trigger that disables billing. Still the right tool when you need blast radius the spend cap can't give you: multiple services at once, an entire project, or a service that isn't eligible yet. When the budget hits a threshold, Pub/Sub fires a Cloud Function that detaches the billing account, which stops all billable activity within minutes. Blunter and more dangerous than the native cap — it can leave resources unrecoverable — so reach for it second, not first. Full walkthrough: Automatically respond to budget notifications.

    code_block
    <ListValue: [StructValue([('code', '# Sketch: create a budget SCOPED TO ONE PROJECT that publishes to Pub/Sub at 50%, 90%, 100%.\r\ngcloud billing budgets create \\\r\n --billing-account=012345-6789AB-CDEF01 \\\r\n --display-name="my-startup-prod hard stop" \\\r\n --budget-amount=2000USD \\\r\n --filter-projects=projects/my-startup-prod \\\r\n --threshold-rule=percent=0.5 \\\r\n --threshold-rule=percent=0.9 \\\r\n --threshold-rule=percent=1.0,basis=current-spend \\\r\n --notifications-rule-pubsub-topic=projects/my-startup-prod/topics/budget-alerts'), ('language', ''), ('caption', <wagtail.rich_text.RichText object at 0x7f7dba9f28b0>)])]>

    Sources:  Manage spend cap budgets, Set up programmatic notifications gcloud billing budgets create reference, Cloud Billing budgets concepts, Disable billing with notifications walkthrough, Programmatic notification payload schema.

    Two things to get ahead of  for, as the defaults can cause unexpected issues: 

    1. Limit your budget scope: Without --filter-projects, your budget applies to your entire billing account. A spike in any project will trigger the kill switch for everything. 

    2. Deploy locally: The budget notification doesn't specify which project is affected. To ensure the kill switch only affects the intended project, deploy your Cloud Function in the same project you're protecting (e.g., my-startup-prod).

    Then wire up a tiny Cloud Function to that topic that calls projects.updateBillingInfo to unlink the billing account when the 100% threshold fires. That is your circuit breaker.

    Mechanical ceilings via quota overrides. Even if you never set up the above kill switch, you can cap the rate at which cost can accumulate by setting explicit per-model, per-region quotas below the platform default. If your app never legitimately needs more than 500 requests per minute for gemini-2.5-pro, cap it there in the Cloud Quotas console; a leaked key can't burn what the quota flatly refuses to serve.

    #9 Where should I actually keep secrets? (Not in .env files!)

    The short answer is: Secret Manager. Not  in environment variables, not in .env files, and never in your repo. Grant read access via IAM only to the service account that needs it.

    code_block
    <ListValue: [StructValue([('code', '# Store a third-party API key (Stripe, OpenAI, whatever).\r\necho -n "sk_live_xxx" | gcloud secrets create stripe-live-key --data-file=-\r\n\r\n# Grant only the runtime service account access to read it.\r\ngcloud secrets add-iam-policy-binding stripe-live-key \\\r\n --member=serviceAccount:agent-runtime@my-startup-prod.iam.gserviceaccount.com \\\r\n --role=roles/secretmanager.secretAccessor'), ('language', ''), ('caption', <wagtail.rich_text.RichText object at 0x7f7dba9f2760>)])]>
    code_block
    <ListValue: [StructValue([('code', '# Application code fetches it at startup; nothing lives on disk.\r\nfrom google.cloud import secretmanager\r\nsm = secretmanager.SecretManagerServiceClient()\r\nresp = sm.access_secret_version(\r\n name="projects/my-startup-prod/secrets/stripe-live-key/versions/latest"\r\n)\r\nstripe_key = resp.payload.data.decode("utf-8")'), ('language', ''), ('caption', <wagtail.rich_text.RichText object at 0x7f7dba9f2100>)])]>

    Then two little disciplines that pay for themselves the first time you need them:

    • Rotation on a schedule and on suspicion. Secret Manager versions are cheap; treat them as immutable and roll forward. 

    • Detection when a secret leaks. Secret Manager notifications and Google Cloud's Sensitive Data Protection can catch keys checked into a repo or pasted into a log stream,  before an attacker does.

    For any AI application that acts on a user's behalf, calls Gmail on their behalf, reads a Drive folder, hits a third-party SaaS with the user's credentials, do not store a long-lived token. Use OAuth 2.0 with short-lived access tokens and a refresh flow, so that when a user rage-quits or a compromised account gets revoked, the agent loses access at the same time. 

    #10  How do I stop my brand new AI agent from doing something it absolutely shouldn't?

    An agent that can call tools, browse the web, or execute code needs the same defense-in-depth thinking as any other production service, arguably more, because it makes decisions that neither you nor the model can fully predict in advance.

    Four layers, none optional once you have real users:

    1. Identity for the agent itself. Give the agent its own service account, scoped only to the resources and tools it genuinely needs,  the exact same least-privilege principle as any other workload. Agent Engine supports first-class agent identity so every action can be attributed to a specific agent instance in your audit logs.

    2. Sandboxed code execution. If your agent runs generated code,  a common pattern for data-analysis or "run this Python for me" flows, do not run it in your application process. Use an isolated sandbox so a bad combination can't touch your production data.

    code_block
    <ListValue: [StructValue([('code', '# Enable server-side code execution inside a sandbox for a request.\r\nfrom google import genai\r\nfrom google.genai import types\r\n\r\nclient = genai.Client(vertexai=True, project="my-startup-prod", location="us-central1")\r\nresp = client.models.generate_content(\r\n model="gemini-2.5-pro",\r\n contents="Compute the correlation between these two columns: ...",\r\n config=types.GenerateContentConfig(\r\n tools=[types.Tool(code_execution=types.ToolCodeExecution())],\r\n ),\r\n)'), ('language', ''), ('caption', <wagtail.rich_text.RichText object at 0x7f7dba9f20a0>)])]>

    3. Prompt and response filtering. Model Armor sits in front of your model calls and screens for prompt injection, jailbreaks, sensitive-data exfiltration, and off-brand output,  all of which are essentially guaranteed the moment you have real users being real users.

    4. Behavioral monitoring. Security Command Center with threat detection flags anomalies in agent behavior,  a service account suddenly calling an API it's never touched before, an agent reaching out to an unfamiliar external host, an unexpected spike in privileged operations. In near-real-time.

    None of these are optional once your agent is acting on behalf of a real user or handling real money.

    Your homework, so to speak:

    1. Audit for raw API keys in your repo, your notebooks, and your production runtime. Rotate anything that shouldn't be there.

    2. Move any workload that doesn't need a synchronous response to the Batch API.

    3. Turn on the Model observability dashboard and put one alert on capacity errors, so the next 429 reaches you before it reaches a customer.

    4. Set a spend cap on the project, and keep an eye out for 50% and 80% alerts. If usage crosses 100% of the budget, Google will pause the service until you manually lift it.

    Do those four things this week and you're already ahead of most startups shipping AI features. 

    Have a scenario you'd like us to cover next? Reach us at Google Cloud for Startups.

    •  

    Introducing the Developer Device Platform for agentic mobile app development

    Most enterprises connect with their customers through a device. Whether it’s using a mobile app to order a product, contact customer service, view content, or manage their account, the customer experience depends on how well an app can run locally on the customer’s device.

    For this reason, building and testing applications across a wide variety of devices is critical for any enterprise launch that involves locally running components. However, procuring and hosting devices at scale is expensive and complex, and tests are often flaky, inconclusive, or just difficult to debug. This leaves many developers to test launches on the physical phones in their pockets and hope the results apply to most devices. 

    To solve this challenge, today we are excited to announce the public preview launch of Developer Device Platform (DDP) on Google Cloud. DDP is a fully managed cloud platform that provides instant, on-demand access to multiple hardware profiles across real physical devices and high-concurrency virtual emulators. DDP represents an evolution of Firebase Test Lab for Cloud developers, and is also the first device platform built for agentic development. With DDP, developers can now utilize their preferred agents to vibe code apps, run tests, debug, and optimize performance across devices efficiently and quickly.

    Build and test your apps to guarantee performance

    In the standard mobile development lifecycle, developers iteratively build new features, run QA tests to ensure performance across a variety of target devices, and ship the optimized and debugged feature to production for their users. Developer Device Platform offers two main functions to accelerate this cycle:

    Interactive debugging with Device Streaming: With our Device Streaming API, developers can directly access an emulator or physical device of their choice, and vibe code, iteratively test, debug and interact with the app remotely. Device streaming makes it simple to dive into your customer experience, and scroll and click in real time, all while also monitoring performance on the real device hardware.

    Parallel testing with Device Run: With our Device Run API, developers can write tests as part of their CI/CD pipelines and run them in parallel across hundreds of different devices at once. With the results, developers can pinpoint and debug specific device issues, and ship code to production with confidence that it will run across device tiers.

    Accelerate mobile app development with DDP agent skills and efficient tests

    The rise of coding agents in mobile development specifically opens up new possibilities when paired with physical devices. Coding agents can interact and test on the real hardware, helping them take advantage of unique phone screen sizes (e.g., foldable phone UI) and specialized hardware (e.g., CPUs vs GPUs). 

    Developer Device Platform will soon integrate with Android Studio and Android CLI, giving you direct access to physical devices via Device Streaming API. The DDP agent skill will also allow you to work with the AI coding agents of your choice to accelerate development. With DDP agent skill, coding agents can:

    • Execute multi-step user journeys independently

    • Spot visual artifacts

    • Analyze real-time chip performance on-device

    • Validate fixes to hardware specific bugs and/or optimize for unique phone features

    In addition to these agentic capabilities, DDP also enables developers to package apps and launch parallelized tests with smart sharding, giving you access to results across hundreds of devices in minutes. With smart auto-retries, DDP also retries specific tests that fail within your shards, helping you get past errors faster without rerunning your entire suite of tests.

    Start building with Developer Device Platform today

    Starting August 12, Developer Device Platform is available in public preview to all Google Cloud users. During public preview, users are charged based on a pay-per-minute model so you pay only for the active testing minutes you consume, with rates differing for emulator vs physical devices.

    We can’t wait to see how Developer Device Platform can help mobile developers across Google Cloud accelerate their development and take advantage of the growing number of unique device features and on-device AI possibilities.

    •