❌

Vue lecture

Google is a Leader in the 2026 Gartner Magic Quadrant for Container Management

We’re excited and proud to share that Gartner has recognized Google as a Leader for the fourth year in a row in the 2026 Gartner® Magic Quadrant™ for Container Management, based on its Completeness of Vision and Ability to Execute. Google was positioned highest in Ability to Execute of all vendors evaluated and we believe this validates the success of our mission to deliver a container platform that’s highly optimized for both performance and efficiency. We help global customers to build and run their most demanding and complex workloads at scale, including the next generation of AI and agentic applications. 

In the accompanying 2026 Gartner Critical Capabilities for Container Management report, Google Cloud was ranked first in every use case: New Cloud Native Applications, Containerized Existing Applications, AI Training, AI Inference, Edge Applications, and Hybrid Applications.

Gartner predicts1 that “By 2028, 95% of new AI deployments will use Kubernetes, up from less than 30% in 2025.” Containers power today’s most innovative apps and businesses — and deliver the infrastructure customers demand as they transform their businesses in the agentic era.

2026 Gartner Magic Quadrant for Container Management

Google Cloud spearheaded the industry-wide cloud-native revolution when we introduced Kubernetes in 2014 and launched Google Kubernetes Engine (GKE), the world’s first managed Kubernetes service, in 2015. Our commitment to container platforms and the vibrant, innovative Kubernetes ecosystem has only grown stronger and deeper since. Alongside GKE, our serverless container platforms GKE Autopilot and Cloud Run dramatically lower operational costs and help developers deliver amazing containerized apps faster than ever before. 

The massive acceleration in enterprise AI has inspired us to redefine infrastructure management for the AI era. In 2026 so far we’ve introduced a wide range of foundational improvements to shift GKE and Cloud Run into agent-native, high-performance platforms designed for autonomous AI systems, massive inference workloads, and secure runtime isolation. Whether you’re training AI at the frontier, launching an AI startup, or leading your enterprise AI transformation, we have the container platform you need. Important highlights include:

Delivering leading performance and efficiency for AI infrastructure

  • GKE predictive latency boost: Built into the GKE Inference Gateway, this ML-driven capability uses capacity-aware routing rather than static configurations to reduce Time-to-First-Token (TTFT) by up to 70%.

  • GKE automatic KV Cache storage tiering: Automatically shifts KV cache data across RAM, Local SSD, and Cloud Storage. This reduces memory bottlenecks, improving TTFT by 40% via RAM offloading and increasing throughput by 70% via Local SSDs for large prompt contexts. [1]

  • GKE accelerated container and model startups: GKE node spin-up times are up to 4x faster, and pod startup speeds have improved by up to 80%. Additionally, native run:AI Model Streamer integration pulls heavy models from Cloud Storage 5x faster.

  • Cloud Run on-demand serverless GPU scale-to-zero: Cloud Run supports NVIDIA RTX PRO 6000 Blackwell GPUs, allowing teams to serve 70B+ parameter models on-demand. Your services can go from zero to a fully provisioned GPU — with all drivers pre-installed — in under 5 seconds. Once active inference or fine-tuning runs complete, Cloud Run automatically scales instances back to zero, eliminating idle infrastructure costs.

Evolving Kubernetes for agentic infrastructure security and scale

  • GKE Agent Substrate: As an open-source, secure-by-default agent execution runtime, Agent Substrate is engineered to run millions of sandboxes with 10x higher density than standard container runtimes. Purpose-built for the era of autonomous agents, Substrate delivers sub-500ms resume operations at over 500 suspend/resume activations per second with a native zero-trust kernel and network isolation. Agent Substrate is available as an open-source solution that runs on any Kubernetes infrastructure and is optimized for GKE.

  • GKE Agent Sandbox: Built on gVisor kernel-isolation technology, Agent Sandbox isolates the host environment from untrusted, multi-agent AI code execution. It provides secure execution at scale, processing up to 300 sandboxes per second with sub-second latency and delivering up to 30% better price-performance when running on Axion processors than comparable hyperscaler cloud providers. 

  • GKE Dataplane V2 scalability limits: Architectural capacity bounds for GKE clusters implementing active NetworkPolicies doubled from 7,500 nodes to 15,000 nodes per cluster, supporting the massive infrastructure needs of large enterprise and AI customers.

  • GKE intent-based autoscaling: GKE can now natively autoscale horizontally using application intent and custom metrics beyond basic hardware metrics. This reduces resource allocation reaction times from 25 seconds down to just 5 seconds.

  • Filestore agent volumes: a new offering that attaches and detaches NFS mounts in milliseconds, allowing agents to start/resume near-instantaneously, along with native Read-Write-Many (RWX) access and POSIX-compliant file locking to enable safe multi-agent collaboration without write collisions. 

Next-gen developer experience with serverless containers

Whether you’re hosting a standard web API, running a heavy batch data job, processing an asynchronous message queue, or deploying a complex AI agent, Cloud Run handles it all under a single, unified serverless model that delivers an unmatched developer experience and maximum engineering velocity. 

  • One-click prototyping in Google AI Studio: You can build and deploy full-stack applications directly within Google AI Studio, making it an exceptional environment for rapid prototyping and experimentation. With a single click, you can instantly package and publish your vibe-coded applications to Cloud Run.

  • Cloud Run instances: This new primitive manages individual, addressable, long-running singleton resources with integrated Cloud Storage volume mounts, allowing persistent background agents like OpenClaw to be deployed cost-effectively. With baseline shared-CPU configurations starting at a highly predictable flat rate of ~$5.70 per month (for 1 vCPU and 1 GiB of RAM), Cloud Run instances delivers an always-on, VM-like experience while bypassing the idle-cost penalties and operational overhead of traditional VMs.

  • Cloud Run sandboxes: Hard-isolated environments spin up in under 500 milliseconds to safely execute untrusted, model-generated code, protecting the host system from unauthorized access.

Take the next steps

As we reach for new heights of performance, security, and scale for our container platforms, we continue to build the future in the open. We invite you to explore Agent Sandbox and Agent Substrate today. We can’t wait to shape the future of agent infrastructure together with our customers and partners. Check out these resources to continue your learning journey:


1. Gartner report: Critical Capabilities for Container Management, 8 September 2026

Gartner, Magic Quadrant for Container Management, Dennis Smith, et al, 2 September 2026
Gartner, Critical Capabilities for Container Management, By Tony Iams, Wataru Katsurashima, Lucas Albuquerque, Dennis Smith, Bhuvie Chhabra, 8 September 2026. 
Gartner and Magic Quadrant are trademarks of Gartner, Inc. and/or its affiliates.
Disclaimer: Gartner does not endorse any company, vendor, product or service depicted in its publications, and does not advise technology users to select only those vendors with the highest ratings or other designation. Gartner publications consist of the opinions of Gartner’s business and technology insights organization and should not be construed as statements of fact. Gartner disclaims all warranties, expressed or implied, with respect to this publication, including any warranties of merchantability or fitness for a particular purpose.

  •  

Introducing GKE agentic migration for AI-assisted EKS-to-GKE migrations with built-in governance

Enterprises are increasingly standardizing on Google Kubernetes Engine (GKE) to run their most critical and AI-driven workloads. From Cloud Storage FUSE for high-throughput data access to custom compute classes (CCC) and advanced GPU slicing, GKE provides the scale and efficiency required for modern applications.

However, migrating complex Kubernetes environments from AWS EKS to GKE has traditionally been a daunting, high-friction engineering endeavor. Your platform teams must manually dissect sprawling infrastructure-as-code (IaC), navigate cloud-specific architectural differences, and build custom translation scripts.

While your engineering teams often experiment with general-purpose LLMs to draft conversions, ad-hoc prompting quickly can become an operational trap. Raw models hallucinate non-existent resource properties, drop critical network or identity configurations, and lose context across interdependent files. The time platform engineers spend auditing, untangling, and debugging model errors ends up cannibalizing any upfront speed gains, creating manual toil and unpredictability. 

Today, we are excited to announce the open-source release of GKE agentic migration, a purpose-built agent plugin that replaces brittle, ad-hoc prompting with an AI-assisted migration pipeline protected by deterministic guardrails. 

“For large enterprise clients, the biggest barrier to cloud modernization is execution risk and unpredictability. Unlike raw chat prompts that lose context and hallucinate configurations, Google’s GKE agentic migration pairs the speed of generative AI with the deterministic guardrails enterprises need: structured state persistence, multi-persona boundaries between platform and app teams, and non-negotiable human approval gates. It gives our global engineering practice a provable, compiler-grade migration factory that slashes delivery risk.- Rahul Shrivastava, EVP, Persistent

The challenges of infrastructure migrations

When talking to customers about their infrastructure migration journeys, we consistently hear about several governance challenges:

  • The automation trust gap: Refactoring Kubernetes configurations manually can be agonizingly slow. Yet, using generic AI coding assistants introduces unacceptable risk. Standard LLMs can hallucinate infrastructure code, use deprecated API fields, or omit critical security rules. Generating code that is "almost right" simply shifts the bottleneck from writing code to debugging it.

  • The danger of live cluster mutability (ClickOps): Legacy migration tools often connect directly to live clusters and deploy via API calls. This bypasses the organization's Git repository (the true source of truth), breaks CI/CD pipelines, and makes rollbacks incredibly difficult.

  • The siloed handoff bottleneck: Migrations are often long-running, multi-week operations. Platform engineers build the landing zone and your application developers migrate the workloads. Standard AI tools lose context across the handoff.

  • The fragmented toolchain: Backup tools like Velero are excellent for disaster recovery but capture exact AWS-specific configurations (like ALBs) without translating them for Google Cloud. Reverse-engineering tools, meanwhile, generate flat configurations that strip away the developer's original logical intent.

Introducing the GKE agentic migration

The GKE agentic migration addresses these challenges by combining the reasoning capabilities of LLMs with strict, deterministic tooling. Designed as a compilation of agent skills and a local Model Context Protocol (MCP) server, it uses AI to translate complex AWS EKS IaC and Kubernetes manifests directly into GKE landing zones via automated Pull Requests.

Here are the key capabilities that set the GKE agentic migration apart:

1. Hybrid verification — LLM-generated, deterministically validated. To combat dangerous IaC hallucinations, LLM workers handle the complex authoring of Terraform and Kubernetes YAML, while the server runs deterministic transforms for exact mappings such as Workload Identity annotations and image registries. Crucially, these AI-generated translations are then submitted to strict deterministic validations (e.g., terraform validate, Kubernetes manifest contracts) before they are presented to the user. This approach helps maintain safety against hallucinations while gating everything behind human-in-the-loop (HITL) approval.

2. GitOps-native PR workflows: The plugin never applies changes directly to a live cluster. Instead, it reads your source of truth, generates the target state, and opens a Pull Request. This helps route all changes through your standard human-in-the-loop (HITL) CI/CD review process. No "ClickOps."

3. Protected separation of translation vs. transport: The plugin automates the tedious logic of architectural translation, but it intentionally does not transport stateful data. To protect your most sensitive assets, the plugin generates contextual runbooks that guide your team in using purpose-built, SLA-backed tools (like Google Cloud's Database Migration Service or Storage Transfer Service).

4. Multi-persona state management: Migrations are team efforts. The plugin persists the long-running migration state.  This enables protected, asynchronous handoffs: Platform engineers establish the baseline landing zone, while app developers independently join the workspace from their own machines to translate individual workloads within permission-isolated folders.

How it works: The migration lifecycle

Under the hood, the GKE agentic migration utilizes a migration state graph of executable functions, systematically passing context down the chain. Packaged as an open-source agent plugin, there are no custom CLI binaries to install and no central control planes to manage — your team collaborates through your existing development harness, delivering validated pull requests and actionable runbooks directly into your source repositories. This provides:

  • Deep EKS repository discovery: The plugin clones the source Git repository or performs a live scan of your EKS cluster, programmatically indexes the source manifests, maps dependencies, and builds an inventory
  • Assessment & blocker governance: It generates a readiness report identifying architectural incompatibilities. Before design can unlock, every blocker must have an assigned owner and target resolution date. The Platform Engineer signs off on the migration boundaries before translation begins.
  • Landing zone design: The plugin scaffolds the foundational Google Cloud Terraform modules (VPC, subnets, GKE cluster, org policies) based on explicit platform decisions (such as GKE Autopilot vs. GKE Standard).
  • AI-assisted cloud translation: The plugin handles proprietary shifts, including translating AWS IRSA to Workload Identity, mapping ALB ingress to the Gateway API, and converting Karpenter node claims to GKE Node Auto Provisioning (NAP) or Custom Compute Classes (CCC).
  • Offline validation: Generated modules and manifests are compiled and verified offline (terraform validate, manifest structure checks, and output contracts). 
  • Deployment via Pull Request: The finalized configuration is verified locally and opens a PR for review. 

Getting started

The GKE agentic migration transforms cloud migrations from disjointed refactoring exercises into predictable, AI-assisted, and reviewable GitOps workflows. Ready to accelerate your journey to GKE?

  •  

Scale your own way, using HPA with built-in support for PromQL metrics queries in GKE

Earlier this year, we announced native support for Google Kubernetes Engine (GKE) custom metrics. This milestone allowed you to scrap external adapters and instead collect autoscaling metrics directly from your pods. By routing these metrics straight to the Horizontal Pod Autoscaler (HPA), we cut metrics reading latency down to 5 seconds.

Today, we are excited to introduce built-in support for processing Prometheus metrics, allowing you to use expressive PromQL queries to customize autoscaling triggers. With this update, HPA can now directly process autoscaling metrics present in Cloud Monitoring using Google Managed Service for Prometheus. Reading metrics from these backends will not require third-party adapters, leveraging the AutoscalingMetric integration used to support pod-level metrics. After the preview, we plan to support self-hosted Prometheus servers as we move to general availability. 

The challenge: Setting up Cloud Monitoring metrics

Support for custom pod-level metrics made autoscaling more straightforward, but production workloads often need to scale on multiple, complex infrastructure metrics. Common examples include scaling:

  • a worker pool based on the number of unacknowledged messages in a Pub/Sub topic

  • an inference service based on query-per-second (QPS) metrics stored in Cloud Monitoring / Prometheus

  • a webserver farm based on the 95th percentile of their measured response time

To achieve this, you used to need to deploy an external adapter like the Stackdriver Custom Metrics Adapter or the Prometheus adapter to retrieve the metrics from an external logging environment. While this sounds straightforward at first, these adapters introduce a lot of operational friction:

  • Management overhead: Platform teams have to install, configure, patch, and monitor these third-party components.

  • Reliability and inefficiency: Intermediate adapter pods reading from external systems introduce failure points in critical autoscaling loops. 

  • IAM complexity: Enabling secure cross-component communication requires setting up Kubernetes service account mappings to Cloud service accounts including their permissions.

And while setting up this system and maintaining it not impossible, it’s complex and features a complicated architecture:

1

How processing Prometheus Metrics in GKE can help

Extending the AutoscalingMetric object drastically simplifies this setup. Now you can read metrics from monitoring directly via PromQL and provide them to HPA via a high-performance, low-latency autoscaling pipeline, resulting in a simplified environment.

2

To prevent inefficiencies, we built this feature with minimal resource consumption in mind. The controller runs on the GKE control plane. It monitors your AutoscalingMetric custom resources and only deploys the system pod on your user nodes when a PromQL metric is actively requested. If no Prometheus metrics are configured, the controller is shut down, so there’s no resource overhead.

Configuring built-in Prometheus metrics

Configuring GKE to use PromQLl metrics is easy; here’s a sample configuration file providing PubSubs message queue depth as scaling metric:

code_block
<ListValue: [StructValue([('code', 'apiVersion: autoscaling.gke.io/v1beta1\r\nkind: AutoscalingMetric\r\nmetadata:\r\n name: gmp-metric\r\nspec:\r\n metrics:\r\n - promql:\r\n name: pubsub-queue-depth\r\n query: |\r\n {\r\n "pubsub.googleapis.com/subscription/num_undelivered_messages",\r\n subscription_id="my-subscription"\r\n }'), ('language', ''), ('caption', <wagtail.rich_text.RichText object at 0x7f1273c8ead0>)])]>

Linking Prometheus metrics to your HPA

Once defined in your AutoscalingMetric resource, you can reference the metric in your standard HorizontalPodAutoscaler using the same intuitive format as raw custom metrics: autoscaling.gke.io|<custom-resource-name>|<metric-name>.

Scaling globally (Prometheus metric)

For global metrics like a queue size that returns a single aggregate value:

code_block
<ListValue: [StructValue([('code', 'apiVersion: autoscaling/v2\r\nkind: HorizontalPodAutoscaler\r\nmetadata:\r\n name: worker-hpa\r\nspec:\r\n scaleTargetRef:\r\n apiVersion: apps/v1\r\n kind: Deployment\r\n name: worker-deployment\r\n maxReplicas: 10\r\n metrics:\r\n - type: External\r\n external:\r\n metric:\r\n name: autoscaling.gke.io|gmp-metric|pubsub-queue-depth\r\n target:\r\n type: AverageValue\r\n averageValue: 100 # maintain queue size at ~100 per pod'), ('language', ''), ('caption', <wagtail.rich_text.RichText object at 0x7f127e890990>)])]>

Scaling on Cloud Monitoring per-Pod metrics

GKE natively supports scale based on the most recent gauge metric values, but PromQL offers greater flexibility, allowing you to scale across time windows and calculate rates or histogram percentiles.

To use this capability, configure your PromQL metric to include a label for the pod name, then assign type: Pods within your AutoscalingMetric manifest. Below is an example that calculates a Pod's average memory usage over a five-minute rolling window.

code_block
<ListValue: [StructValue([('code', 'apiVersion: autoscaling.gke.io/v1beta1\r\nkind: AutoscalingMetric\r\nmetadata:\r\n name: per-pod-stored-metric\r\nspec:\r\n metrics:\r\n - promql:\r\n name: container-memory-metric\r\n query: |\r\n sum by ("pod")\r\n (avg_over_time({"container_memory_working_set_bytes"}[5m]))\r\n type: Pods # The promql query returns per-pod metrics'), ('language', ''), ('caption', <wagtail.rich_text.RichText object at 0x7f127e893290>)])]>

Key benefits

  • No adapter maintenance: No pods to install, configure, or upgrade. The entire lifecycle is fully managed within GKE.

  • Streamlined security: Out of the box, the Kubernetes Default Node Service Agent has read permissions to Cloud Monitoring and Google Managed Prometheus in the same project. No extra IAM service accounts, keys, or federation parameters are required.

  • Low latency and fast scalability: The new Autoscaling Metric system polls the backend every 15 seconds, helping ensure fast scaling reactions.

  • Rich query capabilities: Leverage the full power of PromQL (including rate calculations, averages, and percentiles) to translate high-level business and user-experience objectives directly into scaling.

  • Support for the new HPA scale-to-zero capability: Utilize it for scaling workloads to zero replicas when demand hits zero (e.g., Pub/Sub queue size) and, more crucially, back up from zero replicas quickly using CapacityBuffers API.

Try it today 

By natively supporting both custom container metrics and Prometheus metrics, GKE now  offers a more robust, performant, and low-friction autoscaling experience. Built-in support for Prometheus Metrics is in preview now. To learn more about setting up your first AutoscalingMetric resource, check out the latest GKE autoscaling documentation.

  •  

GKE becomes more elastic: Scale to zero, save costs, and keep workloads responsive

True elasticity has long been the holy grail of cloud-native engineering. And while Kubernetes has revolutionized resource management, workloads that run sporadically (e.g., batch processors, event-driven workers, and development environments) still consume compute resources while they wait for work, driving up costs.

We’re addressing this head-on in Google Kubernetes Engine (GKE) 1.37 with a native way to scale to and from zero. A new collection of features allows you to scale down your workloads completely to zero replicas so that they stop consuming resources. At the same time, you can quickly and easily restart these workloads on GKE capacity buffers when demand returns, so you waste less infrastructure. This isn't just about saving money, but about decoupling the cost of always-on infrastructure from workload readiness.

The evolution: HPA-based scale-to-zero vs. KEDA

For years, Kubernetes Event-Driven Autoscaling (KEDA), an optional Kubernetes component, was the go-to solution for scaling to zero. While powerful, KEDA adds complexity to an environment. 

Feature

GKE scale-to-zero

KEDA-based setups

Operational toil

Managed service; no extra components.

Requires management of ScaledObject CRDs & operators.

Configuration

Native HPA & CRDs (minimal YAML).

Can exceed 10,000 lines of YAML for large fleets.

Latency

Internalized signal path reduces reaction time.

Polling intervals and hop-counts increase cold-start delays.

By baking scale-to-zero directly into the GKE control plane, we eliminate the need for add-on operators and thousands of lines of configuration. The logic moves from "sidecar management" to a native attribute of the workload.

Under the hood: HPA with AutoscalingMetric and KEP-2021

The magic behind scaling to zero within GKE lies in the integration of two critical components:

  1. HPA with AutoscalingMetric: This is the managed metrics signal pipeline that now supports direct reading of external signals from Google Cloud Managed Service for Prometheus. HorizontalPodAutoscaler (HPA) with AutoscalingMetric provides a unified, high-performance path for metrics from Pub/Sub, Cloud Monitoring, or Load Balancer signals to reach the autoscaler, without the complexity of an adapter.

  2. KEP-2021: Built on the Kubernetes Enhancement Proposal that enables minReplicas: 0 in the HPA, this mechanism allows the HPA to stop all pods when metrics fall below a threshold. It also ensures the HPA can "wake up" the deployment as soon as the metric indicates pending work.

Configuring your first scale-to-zero workload

To implement native scale-to-zero, you need two primary objects: a metric definition and an HPA. In the following example, we scale a worker based on the number of undelivered messages in a Pub/Sub subscription.

Define the metric source

Use the AutoscalingMetric CRD to map an external Cloud Monitoring metric to your cluster.

code_block
<ListValue: [StructValue([('code', 'apiVersion: autoscaling.gke.io/v1beta1\r\nkind: AutoscalingMetric\r\nmetadata:\r\n name: my-autoscalingmetric\r\nspec:\r\n metrics:\r\n - promql:\r\n name: pubsub-undelivered\r\n query: >\r\n {\r\n "pubsub.googleapis.com/subscription/num_undelivered_messages",\r\n subscription_id="my-subscription"\r\n }'), ('language', ''), ('caption', <wagtail.rich_text.RichText object at 0x7f12737bc910>)])]>

Configure the HPA with minReplicas: 0

Reference the metric in your HPA and explicitly set the minimum replicas to zero.

code_block
<ListValue: [StructValue([('code', 'apiVersion: autoscaling/v2\r\nkind: HorizontalPodAutoscaler\r\nmetadata:\r\n name: worker-hpa\r\nspec:\r\n scaleTargetRef:\r\n apiVersion: apps/v1\r\n kind: Deployment\r\n name: worker-deployment\r\n minReplicas: 0\r\n maxReplicas: 50\r\n metrics:\r\n - type: External\r\n pods:\r\n metric:\r\n name: autoscaling.gke.io|my-autoscalingmetric|pubsub-undelivered\r\n target:\r\n type: AverageValue\r\n averageValue: 10'), ('language', ''), ('caption', <wagtail.rich_text.RichText object at 0x7f1273975650>)])]>

There you go — you’ve allowed your workload to scale to and from zero based on an external metric.

Scale-to-zero capabilities are made possible by support in GKE for external metrics from Cloud Monitoring. By extending the AutoscalingMetric custom resource, you can now query metrics from Google Managed Service for Prometheus, without complex, third-party adapters. This reduces latency, simplifies security, and serves as a key foundation for configuring native scale-to-zero workloads. To learn more about this integration, read our companion blog post on native support for external metrics in GKE.

Managing startup latency with capacity buffers

The biggest challenge with scaling from zero is the so-called cold start — the time it takes for GKE to provision a node and for the container to pull it and start it. This is where GKE capacity buffers come in.

Capacity buffers act as pooled warm capacity. By maintaining a small amount of warm compute resources that can be shared by multiple workloads that can all scale to zero, GKE ensures that when your HPA jumps from 0 to 1, the pod has resources that it can claim immediately. This eliminates the 60-90 second wait for a new GKE node to spin up, reducing startup latency from minutes to an instant, all while maintaining zero cost for the workload. 

Capacity buffers come in two flavors: active and standby. A small active buffer can serve hundreds of workloads that are scaled to zero; instead of each of the workloads maintaining a replica, the active buffer acts as wildcard capacity that serves the whole cluster. A larger standby buffer, which costs a fraction of an active buffer, quickly refills the active buffer for any sustained load encountered by the cluster. By using them together, you get both instant scaling and can maintain low costs. 

What’s ahead

We continue to expand our roadmap for GKE elasticity. For example, imagine you want your development environments to scale to zero at 8:00 PM and scale back up at 7:00 AM. Be on the lookout for methods to exert finer-grained control over recurring scaling, so you can proactively define your scale-to-zero windows. 

Get started with scaling-to-zero today

The days of paying for idle resources are numbered. By enabling GKE's native scale-to-zero capabilities for event-driven and sporadic workloads, you can slash costs without sacrificing startup performance. To get started with scale-to-zero, follow these steps:

  1. Identify a workload with fluctuating demand that has periods of idleness.

  2. Configure your AutoscalingMetric, and set your minReplicas to zero. 

  3. Add capacity buffers to your cluster or workload to keep response times snappy.

For more, check out the documentation on Scaling GKE workloads to and from zero using HPA.

  •  

Scale your AI workloads faster and more efficiently with GKE Pod snapshots

When running modern AI workloads, there’s often a conflict between performance and cost. Workloads like large language models (LLMs) load massive files, and may serve thousands of AI agents that need to execute code instantly. If each component is starting “cold” with a full data-load process, all this provisioning takes time, often forcing organizations to overprovision their infrastructure just to meet scaling requirements.

To solve this, we introduced Google Kubernetes Engine (GKE) Pod snapshots, a new feature that lets you save the running state of your workload, including CPU and GPU memory, and restore it on demand.

GKE Pod snapshots reduce AI inference start-up by as much as 89%, loading 70B parameter models in just 37 seconds and 8B parameters models in just 15 seconds. This speed allows your infrastructure to scale as fast as your demand, significantly reducing the need for overprovisioning.

1

The high cost of cold starts — resuming instead of restarting

The cold start problem isn't unique to AI; it’s a challenge for any application that requires significant initialization time — from game servers to complex Java monoliths. However, the cold start problem is particularly acute in AI workloads. Inference servers must initialize, then download and load gigabytes of model weights into GPU memory — a process that can take several minutes. Further, many agentic AI workloads, including code execution and computer use tools, require isolated sandboxes for each request, and they need to be started quickly and suspended when idle.

In both scenarios, startup latency degrades the user experience and prevents rapid auto-scaling during traffic spikes. Consequently, engineers often resort to overprovisioning expensive infrastructure, or building sophisticated, custom systems to quickly restore state at the application level.

Scaling AI inference without the wait

For generative AI, GKE Pod snapshots solves the linear scaling penalty of model loading. Typically, every new replica you add to a cluster must independently download model weights and load them into accelerator memory. For models with tens of billions of parameters, this step alone often accounts for the majority of the startup time.

With Pod snapshots, you perform this initialization once to create the initial snapshot. GKE captures the fully loaded state including the CPU and GPU memory and persists it in high-throughput Cloud Storage. When the workload needs to scale up, new replicas restore directly from this state, bypassing the initialization phase entirely. In our benchmarks this approach reduced startup latency by as much as 89% for large models like llama3-70b. This speed allows platform teams to shift from expensive overprovisioning strategies to on-demand autoscaling, to help you meet service level objectives while significantly reducing idle GPU costs.

2

Optimizing agentic workflows and sandboxes

GKE Pod snapshots also provide distinct advantages for agentic workflows where agents delegate code execution and computer use to isolated sandboxes. Isolating untrusted, LLM-generated code and commands means one sandbox per user or discrete workflow. In these scenarios, both startup latency and idle sandboxes can result in significant overprovisioning and underutilization. 

Pod snapshots addresses both of these challenges:

  1. To improve startup latency, a snapshot can be captured once of the initial agent sandbox environment, and later used to quickly initialize new sandboxes.

  2. To reduce idle sandboxes, a sandbox can be suspended when idle, capturing its entire compute resources. Later it can be resumed nearly instantly when the environment is needed.

This approach is showing significant success by our customers. For instance, Retake, an AI-powered photo editing platform built by Codeway, faced a significant performance bottleneck with its GPU workloads. By adopting Pod snapshots, they were able to replace a complex custom caching layer and reduce startup time to seconds.

"At Retake, serving personalized models to millions of users requires a massive, unified pipeline for both fine-tuning training and real-time inference on A3 H100 GPUs. We initially engineered a complex custom caching layer for compiled artifacts, which reduced startup time to 1 minute. However, this solution added significant maintenance overhead and still limited our ability to autoscale aggressively. We resolved this by replacing that complexity with GKE Pod snapshots, slashing startup latency to just 8 seconds. By eliminating the initialization penalty, we can now dynamically spin up H100s for specific fine-tuning or inference jobs instantly and shut them down immediately after, drastically reducing idle GPU costs and simplifying our codebase." - Ahmet Furkan Çomak, Lead DevOps Engineer, Codeway

Flexible configuration for any workload

We designed Pod snapshots to improve startup performance and fit naturally into existing Kubernetes workflows. Adopting Pod snapshots to your workload is easy: just define a new declarative policy using Pod snapshot CRDs. The policy allows you to define which Pods to snapshot and where to store the data, and handles the end-to-end storage lifecycle and management. 

You can take snapshots at any stage of the workload — either at workload startup using a workload signal, or during the lifecycle of the Pod using an on-demand trigger. You can further control storage and  restore behavior, setting snapshots retention for cost optimization, choosing between the default behaviour of restoring from the last taken snapshot, or specifying an explicit snapshot during a new Pod deployment.

While the primary use cases for GKE Pod snapshots are AI inference and agent sandboxes, this feature is workload-agnostic. You can use it to speed up any application with a long initialization phase, such as complex Java applications, game servers, or legacy monoliths.

Get started

You can begin optimizing your startup latency today with GKE Pod snapshots. Check out the documentation to learn how to get started and we look forward to your feedback.

  •  

Global AI routing with <1% overhead on multi-cluster GKE Inference Gateway

Demand for AI infrastructure is at an all-time high. Global accelerator shortages mean engineering teams can rarely get all the compute they need from just one data center — capacity comes a cluster here, a cluster there, often an ocean apart. At the same time, workloads are getting hungrier: Today’s long-running agentic workloads often have context windows of 100k to 800k+ tokens, which consume accelerator memory faster than any previous generation of AI traffic.

In this environment, the goal is to maximize "intelligence per dollar." Fragmented, poorly balanced infrastructure is rarely up to the task though, allowing expensive accelerators to sit idle, while requests queue up somewhere else.

To close that gap, we built a layered routing architecture that makes globally scattered capacity behave like a single pool behind a single entry point. At the edge, the multi-cluster GKE Inference Gateway focuses on global, multi-region traffic distribution and high availability. Beneath that, the LLM-d router handles the complex, memory-aware scheduling algorithms that keep utilization high. 

This architecture is deliberately runtime-, model-, and accelerator-agnostic — it works across serving frameworks, model families, and GPU or TPU hardware. To make the results concrete rather than abstract, we recently benchmarked managing production-level global request routing at scale across a multi-region GKE deployment of 17,000 compute nodes spread across the US and Europe. The deployment served a leading Mixture of Experts (MoE) foundation model using SGLang. 

The results: Scaling to three clusters achieved a near-linear throughput boost while maintaining a 99.9% success rate under heavy multi-client concurrency. Additionally, routing traffic through the multi-cluster GKE Inference Gateway added less than 1% overhead, delivering 99.5% of the throughput of a direct, local cluster call.

Read on to learn how it works, more on the benchmark results, and what it means for your own distributed inference deployment.

Three regions, one endpoint

The deployment spanned three GKE clusters in three geographic regions: us-east5 (the config cluster), us-west8, and europe-west4. However, from the client’s perspective, none of that geography exists. Requests hit a single global virtual IP, and the gateway decides — in real time — which cluster should serve each one. 

What makes that decision smart rather than blind is telemetry. Instead of traditional round-robin routing at the network layer, the multi-cluster load balancer is configured to route traffic based on live application signals. Specifically, the Endpoint Picker Proxy (EPP) reads the KV-cache token utilization natively exposed by the underlying inference engines and emits it as a metric for the load balancer. When the load balancer sees a region running hot based on this emitted metric, it spills traffic to the next healthy region.

1

Multi-cluster GKE Inference Gateway topology. The config cluster holds routing configuration but sits outside the request path; each target cluster runs its own EPP and reports KV-cache utilization back to the load balancer.

Distributed LLM engines also operate differently than standard web apps. In a typical inference engine's distributed mode (such as tensor parallelism across multiple nodes), only the master (rank-0) pod serves the API. GKE already handles local routing using standard Service selectors and LeaderWorkerSet (LWS) to direct traffic exclusively to leader pods. The multi-cluster Inference Gateway also integrates with this foundation: It routes global traffic to the correct regional services, helping your cross-region load balancing respects your underlying multi-node topologies out of the box.

The net effect: Three isolated regional data centers start behaving like one cohesive global accelerator fleet, with failover and load balancing driven by what the models are actually doing. 

Measuring the routing overhead 

The first question every team asks about a global routing tier is almost always, ‘How much throughput am I giving up for cross-region capability?’ 

The benchmarks answer this directly: Deploying the multi-cluster GKE Inference Gateway to maximize your accelerator fleet doesn't have to come at the cost of throughput. Routing traffic through the Gateway added less than 1% overhead, delivering 99.5% of the throughput of a direct, local cluster call.

2

That’s the whole trade-off. All the benefits of global load balancing, essentially for free.

Linear scaling across regions 

A bigger test is scale. In our test, growing the fleet from one cluster to three, spanning the US and Europe, while every client request originated from a single region (us-east5), put real pressure on the Gateway: If it couldn’t distribute load efficiently across those distances, throughput would flatten as hardware was added. 

Instead, throughput multiplied almost exactly in line with capacity: 

Fleet topology 

Request 

throughput

Token 

throughput

Success 

rate

1 cluster (us-east5-a) 

0.72 req/s 

2,898 tok/s 

99.87%

2 clusters (+ us-west8-a) 

1.40 req/s 

6,380 tok/s 

99.95%

3 clusters (+ europe-west4- b) 

2.10 req/s 

8,457 tok/s 

99.90%

3

Scaling to three clusters achieved a near-linear throughput boost while maintaining a 99.9% success rate under heavy multi-client concurrency.

Memory-aware routing in action 

Round-robin load balancing is inadequate for serving LLMs because it treats every request as equal. They aren’t. Heavy prompts saturate GPU compute cores, long generations stress memory bandwidth, and long-context conversations quietly eat VRAM until the engine can’t schedule anything new. 

Here, the pressure on memory bandwidth came from the routing signal chosen for this deployment. By mapping Inference Engine's native token-usage metric onto the Gateway’s KV-cache signal, the routing plane gained a real-time view of memory pressure across the entire 17,000 fleet. (Depending on the workload, the Gateway can route on other signals too, like queue depth or running concurrency.) 

Under live production loads, as the primary region climbed toward its high-bandwidth memory (HBM) limits, the Gateway detected the saturation the moment the cluster crossed its 40% KV-cache utilization threshold; it then automatically began routing the overflow to the next healthy region. No operator intervention was needed. The complexity of running in multiple regions simply never reached the user. 

The payoff

By routing traffic based on live KV-cache utilization, this GKE Inference Gateway setup effectively pools globally scattered compute capacity into one unified engine. For this deployment, the result was a near-linear throughput boost across three global regions, with virtually zero routing overhead.

This translates directly into maximizing 'intelligence per dollar,' extracting near-perfect proportional performance out of every accelerator you add to your fleet, rather than letting capital go to waste.

What this means for your team 

If you’re planning your own distributed inference deployment, five lessons from this work stand out:

  • Smarter load balancing pays for itself. Round-robin routing wastes expensive GPU capacity because it can’t see memory or compute pressure. Routing on real-time application signals turns fragmented regional clusters into one efficient fleet — the difference between stranded hardware and 90%+ utilization of scarce compute.

  • Agentic workloads change the bottleneck. Long-running agents with extreme context windows exhaust memory long before there’s no more compute. If your routing layer can’t see memory pressure, your compute will strand compute behind full VRAM. Make KV-cache utilization a first-class routing signal.

  • AI traffic breaks web-era assumptions. Traditional load balancers are tuned for sub-second transactions; LLM requests can run for minutes. Plan connection limits and timeouts for AI-scale latency early, or expect aborted connections in production.

  • Your routing layer must integrate with native serving patterns. Distributed LLM engines have master-worker topologies where only certain pods can serve traffic. By pairing your Gateway with native Kubernetes constructs like LeaderWorkerSet (LWS), your global routing respects local pod topologies out of the box, saving your team from building custom proxy infrastructure.

  • For large foundation model builders, bet on an open, portable stack. Teams operating at frontier scale face the most acute capacity fragmentation, forcing them to hunt for compute resources across whichever regions have availability capacity. An open, portable inference stack such as LLM-d on GKE lets you absorb that capacity wherever it lands, rather than hard-wiring your serving architecture to any single cluster, region, or bespoke infrastructure.

Next steps 

Ready to maximize your distributed accelerator efficiency and set up global cross-region load balancing with multi-cluster GKE Inference Gateway? 

  1. Deploy it yourself: Set up the multi-cluster GKE Inference Gateway. 

  2. Understand the architecture: About multi-cluster GKE Inference Gateway. 

  3. Learn about the cross-region spillover behavior featured in this post: About elastic cross-region high availability and Configure elastic cross-region high availability.

  •  

For SeaVerse, GKE Agent Sandbox reduces infrastructure costs by 60%

Editor’s note: Today we hear from SeaVerse, a gaming startup from SeaArt that is building a platform for playable AI experiences, where users can open lightweight games, character chats, and interactive apps, or create their own experiences from a prompt. To support that creative loop, SeaVerse needed infrastructure that could run dynamic, multi-tenant sandbox workloads with strong isolation, low latency, better observability, and more flexible costs. Google Kubernetes Engine (GKE) and GKE Agent Sandbox gave SeaVerse the managed foundation from which to execute these AI workloads, helping the team reduce their infrastructure costs by up to 60%, while giving creators a faster path from idea to playable experiences. Read on to learn more.


What if AI were a playground? Welcome to SeaVerse, a creation-first platform for playable AI experiences. Here, an AI creation can be as peaceful as drawing a path for a snake to follow, or as chaotic as a music-backed stickman simulation. Some people come to play lightweight games. Others come to chat with AI characters, try interactive apps, create visual patterns, share what they made, or remix an idea into something new. 

We built SeaVerse around a simple promise: Every experience should feel immediate and easy to share. A creator should be able to describe an idea in plain language, refine the result, and publish it in moments, without a traditional coding workflow. 

Delivering that simplicity requires serious infrastructure. Every creation that users make moves through the same chain: generate, run, preview, debug, publish, remix. If any part of that chain is slow, unstable, or poorly isolated, users feel it immediately. That’s why we turned to GKE and GKE Agent Sandbox. 

The infrastructure challenge of instant interaction 

What looks effortless to a user is anything but on our end. Every creation on SeaVerse runs as a distinct workload and is expected to behave reliably from the first interaction. 

Because each workload runs in its own environment, we needed clear security boundaries between users, creations, and sandboxes. But overly strict isolation could slow the very creative loop we were trying to protect, and when something went wrong, diagnosing it was costly. Our engineers had to trace problems across multiple parts of the execution chain with little visibility into what was happening inside the environment. 

We explored existing sandbox approaches, but needed deeper kernel-level isolation and native observability at scale to support fast diagnosis across multi-tenant environments. Something had to change.

Building on GKE and GKE Agent Sandbox 

We chose GKE because we needed a reliable, secure way to operate Kubernetes without turning our engineering team into a cluster maintenance team. GKE brought together the proven ecosystem and operational tooling we needed, freeing us to focus on building the platform rather than managing the infrastructure beneath it. 

As a Kubernetes primitive designed for agent code execution and computer use, GKE Agent Sandbox addressed our requirement for strong isolation, enforcing strong security boundaries without slowing down the creation experience. By utilizing GKE Agent Sandbox with Kata Containers+Cloudhypervisor (microVM), we’ve achieved the perfect balance of multi-cloud flexibility and robust security, option to switch isolation runtime between microVM and gVisor, running our AI sandboxes safely. GKE empowers us to scale toward our long-term vision of supporting over a million sandboxes. Built on gVisor, it provides kernel-level isolation for dynamic sandbox workloads while preserving the Kubernetes orchestration model, so that they can be managed through the same scheduling, monitoring, and operations as the rest of the cluster.  

With SeaVerse, users can generate interactive experiences from a single prompt. After an experience is generated, GKE Agent Sandbox supports the run, test, integration, and verification steps needed to make it ready to preview, refine, and publish. At general availability, it supports allocating up to 300 sandboxes per second, per cluster, with 90% of allocations completing in 200 milliseconds. Together, GKE and GKE Agent Sandbox gave us a reliable foundation for AI-generated interactive workloads that helped keep our team focused on the product experience. 

From black box to glass box 

Before GKE Agent Sandbox, a failed sandbox workload could feel like flying blind. We could often see that something had gone wrong, but didn’t have enough runtime status, metrics, or failure signals to understand why. 

Now, Google Cloud’s native logging and monitoring reach directly into those sandboxed environments, giving us a clearer view of workload behavior, faster issue resolution, and a stronger foundation for managing multi-tenant workloads. 

That visibility matters to developers, but it also matters to the platform’s users: A creator never sees the logs, the cluster, or the orchestration layer. They see whether an experience opens quickly, whether it responds when they draw, click, chat, or share, and whether they can keep building without friction. 

Flexibility that translates to savings

GKE Agent Sandbox also changed how we think about cost. Previously, running secure sandboxed environments meant stronger dependencies on specific server types, which limited how precisely we could match resources to each workload. With GKE Agent Sandbox, we can run secure, isolated workloads on appropriately sized cloud VMs. This gives us greater flexibility in resource allocation and helped us cut our infrastructure costs by up to 60%. 

That same flexibility extended to storage. Not all SeaVerse creations are built in a single session. Some evolve over time as creators return to refine them, build on earlier ideas, or invite others to remix what they’ve made. Our previous architecture didn’t support the persistent file-system capabilities those more complex use cases demanded, but that gap is gone now. We can attach persistent storage where workloads require it while maintaining the isolation boundaries that multi-tenant AI experiences need. For creators, that means experiences that are fast to open and easier to refine, revisit, and build on over time. 

The next remix 

Supporting creations that can evolve and deepen is central to what we’re building. It’s still early in what playable AI can become. As the platform grows, we need to keep strengthening what matters most: stability, observability, elastic scaling, and cost efficiency, all in service of a creator experience that stays fast, reliable, and expressive. 

We’re also exploring additional Google Cloud tools to support smarter analytics and creation assistance. Gemini and agent models could help operators and creators better understand how experiences perform. BigQuery AI and ML capabilities can support use cases such as churn prediction, LTV and ROI prediction, and user segmentation. Multimodal tools such as Imagen and Veo on Gemini Enterprise Agent Platform open up new possibilities for material analysis, creative generation, and AI interactive content production. 

Our goal is to make AI experiences feel immediate, expressive, and connected. With GKE and GKE Agent Sandbox, we have a stronger foundation for the next generation of playable AI.

  •  

Agent Substrate brings high-density, scalable, trusted infrastructure to GKE

Today, we are announcing the availability of Agent Substrate on Google Kubernetes Engine (GKE). Agent Substrate is an open-source, secure-by-default agent execution runtime engineered to run millions of sandboxes with 10x higher density than standard container runtimes. Purpose-built for the era of autonomous agents, Substrate delivers sub-500ms resume operations at over 500 suspend/resume activations per second with native zero-trust kernel and network isolation.

Agent Substrate is available as an open-source solution that runs on any Kubernetes infrastructure and is optimized for GKE. Leading AI teams are already building on it: Nous Research, the team behind the Hermes Agent, is actively building on top of Agent Substrate. Hermes is currently ranked the #1 AI agent globally by OpenRouter usage across productivity, coding, CLI, and personal agents.

From local to 1M-agent scale

Developers already run Antigravity, Claude Code, Codex, OpenClaw, Hermes, and other harnesses locally, but that’s fundamentally different than running hundreds of thousands of concurrent, long-lived agents that generate code, interact with tools, and drive automated execution — challenges that existing architectures often struggle to meet.

Scaling an agent platform from a local prototype to running agents at scale fundamentally changes your infrastructure constraints, which can include:

  • Opaque trust boundaries: Models can generate and run arbitrary code on the fly. Without kernel-level isolation and dynamic network controls, running untrusted code that no human has ever looked at risks host escape, credential theft and data exfiltration.

  • Tool access friction: Agents need full computer environments to invoke command-line tools, headless browsers, and filesystem workspaces. Running these safely needs to be fast and easy.

  • Massive bursts: Agent harnesses, benchmarks, and reinforcement learning rollouts can generate thousands of sandboxes per minute. General-purpose schedulers struggle under this churn, and repeatedly decompressing container images can cause severe disk contention.

  • Idle compute: Autonomous agents spend the vast majority of their time dormant while waiting on model inference, tool responses, or human feedback. Reserving dedicated CPU and RAM for idle containers wastes valuable resources.

A substrate purpose-built for agents

When platform teams hit these challenges, they face an unacceptable trade-off: sacrifice control and isolation, or deal with the high latency and inefficiency of VMs. We believe that teams shouldn’t have to choose. 

Agent Substrate avoids this by decoupling agent execution from machine management. Built on top of cloud-native Kubernetes infrastructure, Agent Substrate offers a new execution layer that’s purpose-built for agentic workloads.

1

From there, the execution layer directly manages the lifecycle of sandboxed agent environments with:

  • Security by default: Hardware-isolated Cloud Hypervisor microVMs or gVisor sandboxes, paired with egress proxies that enforce granular network policies and inject credentials outside the reach of the agents themselves, preventing credential theft.

  • Sub-second activation: Millisecond dispatch of activated agents onto pre-warmed workers, on demand, without container boot delays.

  • High efficiency: Idle actors are suspended and unscheduled in hundreds of milliseconds, freeing up compute resources.

  • Open source and portable: Runs on any Kubernetes cluster in any compute environment and works with any agent framework or harness, including Claude Code, OpenClaw, and Hermes.

Core architectural principles

We adhere to four core architectural principles to guide how Agent Substrate solves these challenges:

1. Secure by default at the kernel and the network

AI agents generate and run untrusted code and terminal commands as a core function. Running that code on a shared server creates serious risks for breakouts and unintended data leakage either at the shared kernel or network level.

2

Agent Substrate takes a secure by default position for both the host kernel and network layers. Teams can choose between hardware-isolated Cloud Hypervisor microVMs, which provides full Linux kernel compatibility, or gVisor sandboxing, with even lower-overhead kernel isolation. Agent Substrate’s integrated gateway manages all egress and ingress requests, enabling fine-grained and extensible control over network access.

2. A control plane and data plane built for low-latency activation

To optimize density for isolated, long-running agent workloads, you need a purpose-built control plane and data plane that enables the lowest possible latency and the highest possible rate of suspend and resume operations. Agent Substrate introduces a dedicated control plane that handles data-aware scheduling with minimal latency. Meanwhile, the data plane handles hundreds of suspend/resume operations per second directly on pre-warmed workers, reducing the overhead of preparing the environment. Snapshots are written to local disk and Google Cloud Storage for durable state persistence. In less than 500ms, a sandboxed environment can be resumed to its previous state, and immediately re-suspended once it’s idle again.

3

3. High-density and active-only compute economics

Agents spend most of their time waiting on model inference, tool responses, or user input. Reserving physical CPUs and RAM for idle containers can lock up expensive and scarce capacity and make running agent fleets at scale unsustainable.

Agent Substrate can release resources the moment an agent pauses. It snapshots the guest hypervisor’s state to the local disk and Cloud Storage, freeing up RAM and CPU to run other agents, while keeping the state intact. When the next turn or tool call arrives, Agent Substrate resumes the snapshotted session in milliseconds. This zero-idle model can pack over 1,000 dormant agents per host, delivering 10x higher compute density than traditional compute. For workloads that need shared filesystems across turns, an optional Filestore agent volume controller provides persistent NFS storage — more on that below.

4. Kubernetes as a foundation: scale and reliability

Building a custom sandbox orchestrator on standard VMs forces teams to maintain tedious operational tooling: node recovery, autoscaling, multi-zone scheduling, and network policy. But routing each sub-second tool invocation through the standard Kubernetes Pod lifecycle adds seconds of delay to each request.

Agent Substrate combines both approaches. The high-frequency suspend-resume runs directly on local workers through a purpose-built data plane. Meanwhile, Kubernetes manages the machines, handling self-healing nodes, fleet autoscaling, and cluster reliability, as well as drives the lifecycle of the worker pods themselves. For workloads that need standard Pod semantics, existing primitives like Agent Sandbox and kernel-isolated Pods continue to work side by side.

Optimized for Google Cloud infrastructure

Building an agent platform that can achieve 1M agent scale depends on having the right underlying compute and storage infrastructure. Agent Substrate on GKE maximizes machine obtainability and flexibility with custom ComputeClasses to dynamically manage machine pools across shapes and families, including spot and on-demand pools. This includes native support for Google Axion, our custom Arm-based processors, which deliver up to 30% better price-performance for sandbox workloads compared to competitive cloud offerings. For stateful workspaces, Agent Substrate on GKE can be optionally integrated with Filestore agent volumes, a new offering that attaches and detaches NFS mounts in milliseconds, allowing agents to start/resume near-instantaneously, along with native Read-Write-Many (RWX) access and POSIX-compliant file locking to enable safe multi-agent collaboration without write collisions. 

Build your agent platform on a scalable foundation

When building production agent applications, you shouldn’t have to compromise between strong security, low latency, and operational scale.

Nous Research builds Hermes, the number-one AI agent in the world by usage according to OpenRouter, where it also ranks first in productivity, coding, personal and CLI agents. Nous Research has been an early design partner on Agent Substrate, evaluating how the runtime handles the isolation and identity requirements that agent workloads introduce.

“We built Hermes Enterprise to enable customers to deploy into their existing infrastructure, while handling per-agent isolation and extensible access control. Agent Substrate addresses both at the platform layer in a way that also preserves valuable compute resources. Our experience with Agent Substrate gives us confidence the architecture can scale efficiently as agent workloads grow.” - Hervé Bizira, Chief Business Officer, Nous Research

By pairing the machine resilience, self-healing nodes, and declarative management of Kubernetes with an agent-native data plane built for kernel isolation, active-only compute, and sub-second execution, Agent Substrate gives engineering teams a clear path to scale.

Agent Substrate is open source and available to all GKE customers for non-production workloads. GA support for production is available via allowlist. To deploy it on your GKE clusters, see Agent Substrate on GKE documentation. To learn more, see About Agent Substrate or visit the open-source repository.

  •  

What’s new in cloud-native apps?

Developers and IT operations pros of all stripes come to Google Cloud to build modern, cloud-first and cloud-native applications. Here’s the latest from Google Cloud on everything app dev, containers, Kubernetes, DevOps, serverless and open source, all in one place.

Week of Apr 11 - Apr 15, 2022

Listen to a Prodcast
Google’s SRE team has launched a “Prodcast” focusing on concepts from its SRE book. Available from wherever you get your podcasts. 

Run Apache Spark on a modern container base
Dataproc, our managed version of Apache Spark, is now generally available on Google Kubernetes Engine (GKE), allowing you to create a Dataproc cluster and submit Spark jobs on a self-managed GKE cluster. Read all about it. 

Loads of new runtimes in App Engine and Cloud Functions
Java, Ruby, Python and PHP developers, rejoice! You can now update or develop new App Engine apps and Cloud Functions using Java 17, Ruby 3, Python 3.10 and PHP 8.1.

BeReal shows you how modern app development is done
Social media company BeReal discusses how it uses Google Cloud services including Firebase, Cloud Functions and GKE to build its app.  

Build fast without breaking things
In this three-part series, learn about the Supply-chain Levels for Software Artifacts (SLSA) framework designed to improve the integrity of your software packages and infrastructure. Start with, How to SLSA Part 1 - The Basics, then move on to part 2 and part 3.

Week of Apr 4 - Apr 8, 2022

How to migrate a container from a VM to Cloud Run
With Cloud Run, you can migrate a legacy VM to a container and save money – even if you don’t know Kubernetes. This video shows you how. 

Receive Error Reporting notifications through Slack and Webhooks
Error Reporting can analyze, aggregate, and notify DevOps teams about crashes that happened in their cloud services, right to their preferred channels. Learn more in this blog. 

Cloud-native architecture is in the cards at NCR
Earlier this year, NCR Authentic Cards talked about how it built a transaction processing platform on Google Cloud. NCR and its consulting partner Opus Systems are back for part two of the migration story, taking a detailed look at all the components that went into the cloud-based architecture. 

How to easily share a service with Cloud Run 
Have you ever written a script that you wanted to make available to others? Cloud Run makes it easy to deploy a processing service quickly and easily. In this blog post, Developer Advocate Laurent Picard creates an image processing service that generates coloring pages, then makes it available to others — all in under 200 lines of Python and JavaScript. Follow along in this tutorial.

Week of Mar 28 - Apr 1, 2022

Another cool thing you can do with Cloud Functions
Got data you want to ingest from Cloud Storage to BigQuery? Cloud Functions can help with that. This tutorial shows you how.  

Add custom severity levels to Cloud Monitoring alert policies
Not all alerts are created equal. In this blog post, learn how to add static and dynamic severity levels to a Cloud Monitoring alert policy, with enhanced notification channels including email, webhooks, Cloud Pub/Sub and PagerDuty. 

Learn how to use CPU allocation controls in Cloud Run
Last fall, we added “always-on CPU” capabilities to Cloud Run, making it a better fit for running background- and other asynchronous-processing tasks. In this post, Developer Advocate Wesley Chun uses a weather alerting app to demonstrate how to use the feature, and along the way, reduces the app’s average user response latency by over 80%.

Week of Mar 21 - Mar 25, 2022

Get Going with latest Go 1.18 release
With the release of version 1.18, the Go programming language now includes support for generic code using parameterized types, integrated fuzz testing, and a new Go workspace mode that makes it simple to work with multiple modules. Learn more here.

Week of Mar 14 - Mar 18, 2022

Create EventArc triggers with Terraform
In addition to the Google Cloud Console or gcloud, you can also use a Terraform resource to create an Eventarc trigger. Mete Atamel shows you how. 

Scaling to new markets with Cloud Run
French publisher Les Echos Le Parisien Annonces switched from dedicated on-prem infrastructure to Cloud Run to supplement its main news site with regional variations. Les Echos shares its website architecture here. 

The serverless way to celebrate Pi Day
In honor of Pi Day, Google Cloud Developer Advocate Emma Haruka Iwao shows you how to use the new Cloud Functions (2nd gen) to calculate π — serverlessly.

Week of Mar 07 - Mar 11, 2022

Rhode Island moves to Google Cloud-based job board
When the pandemic hit, the State of Rhode Island moved its workforce development operations entirely online on a foundation of Google Workspace and Google Cloud resources, including Firestore, Cloud Functions, and Kubernetes, among others. Check out how they did it. 

Containerized microservices at Lowe’s
Lowe’s already told us how they use SRE. They’re at it again, describing how they built an e-commerce website using a containerized microservices architecture and Kubernetes, with Istio for service mesh and Cloud Operations for good measure.

Cruise AVs hit the road with Google Cloud services
Autonomous Vehicle (AV) startup Cruise detailed how it’s using data analytics and machine learning on a foundation of Google Kubernetes Engine (GKE) and other services to develop and test its self-driving cars. Read the guest post. 

L’Oréal’s data analytics gets a makeover with serverless
We’re hurtling toward a programmable cloud — a world where developers use cloud-native serverless tools like Cloud Functions to quickly prototype and build powerful, data-driven business insights. L’Oréal is a great example.  

Better telemetry for your Anthos clusters
Anthos Service Mesh Dashboard is now available (public preview) on the Anthos clusters on Bare Metal and Anthos clusters on VMware. Now, you can get out-of-the-box telemetry dashboards to see a services-first view of your application on the Cloud Console.

Instrument your Java apps
With the new version of the Google Cloud Logging Java library, you can wire your application logs with more information — without adding a single line of code.

Visualize metrics from Cloud Spanner
Building an app on top of Cloud Spanner but can’t assess how well it’s operating? The new OpenTelemetery receiver for Cloud Spanner provides an easy way for you to process and visualize metrics from Cloud Spanner System tables, and export these to the APM tool of your choice. Read more here.

Week of Feb 28 - Mar 4, 2022

Introducing Cloud SDK
The rebranded Cloud SDK is a collection of all the libraries and tools (including Google Cloud CLI) you need to interact with Google Cloud products and services. Learn more here. 

Cloud CLI, meet Terraform
Google Cloud CLI’s new Declarative Export for Terraform allows you to export the current state of your Google Cloud infrastructure into a descriptive file compatible with Terraform (HCL) or Google’s KRM declarative tooling, and is now available in preview. 

Knative graduates to incubating project 
Congratulations to Knative, which has been accepted by the Cloud Native Computing Foundation, or CNCF, as an incubating project, enabling the next phase of serverless architecture. 

We manage Prometheus so you don’t have to
Google Cloud Managed Service for Prometheus is now generally available! Get all the benefits of open source-compatible monitoring with the ease of use of Google-scale managed services. Learn more here.

  •  

Hands-on learning lab: Stream Google Cloud data into Splunk Cloud

Splunk and Google Cloud customers, this one’s for you: The first Hands-on-Lab of Splunk on Google Cloud is now live and ready for enrollees. 

If you haven’t tried it yet, Google Cloud Skills Boost provides hands-on educational experiences so you can learn what you need to know about operating in the cloud. Labs from Google Cloud Skills Boost give users more than just a sandbox environment — they offer live Google Cloud projects for truly interactive learning. Users get to pick experiences ranging from short, 30-minute labs all the way up to multi-day quests to help them tailor learning to their specific needs. 

Splunk offerings on Google Cloud Platform (GCP) provide rich capabilities that cover a broad set of security scenarios, including end-to-end visibility across cloud, on-premises, and hybrid environments. Using Splunk on GCP, you can gain real-time visibility across Google Cloud events, logs, performance metrics, and billing data. Splunk also enables fast security investigations, alerting, and deeper forensic analysis to accelerate incident resolution. You can better build your security infrastructure using Splunk Phantom Apps for Google Vault, Google Workspace, Google Workspace for Gmail, and Safe Browsing. 

Now, the “Getting Started with Splunk Cloud Getting Data In (GDI) on Google Cloud” hands-on-lab is available to take you through core scenarios for data ingestion and data input in Google Cloud, enabling you to get practical, hands-on experience for all scenarios in just 90 minutes or less.

With this hands-on-lab, you’ll learn how to get streaming data from your Google Cloud environment into Splunk Cloud so your organization can leverage Splunk’s Data-to-Everything platform. The lab guides users through the installation of key Splunk components that enable you to stream data into Splunk Cloud platform:

The lab also guides you through managing the following Google Cloud resources:

As you begin the lab, you’ll launch a Dataflow job using the Splunk-specific template, configure the data inputs in Technical Add-on for Google Cloud Platform, perform sample Splunk searches across ingested data, and monitor and troubleshoot Dataflow pipelines. This enables Splunk admins to collect, analyze, and extract insights from all of your Google Cloud data in an easy-to-use and powerful way. 

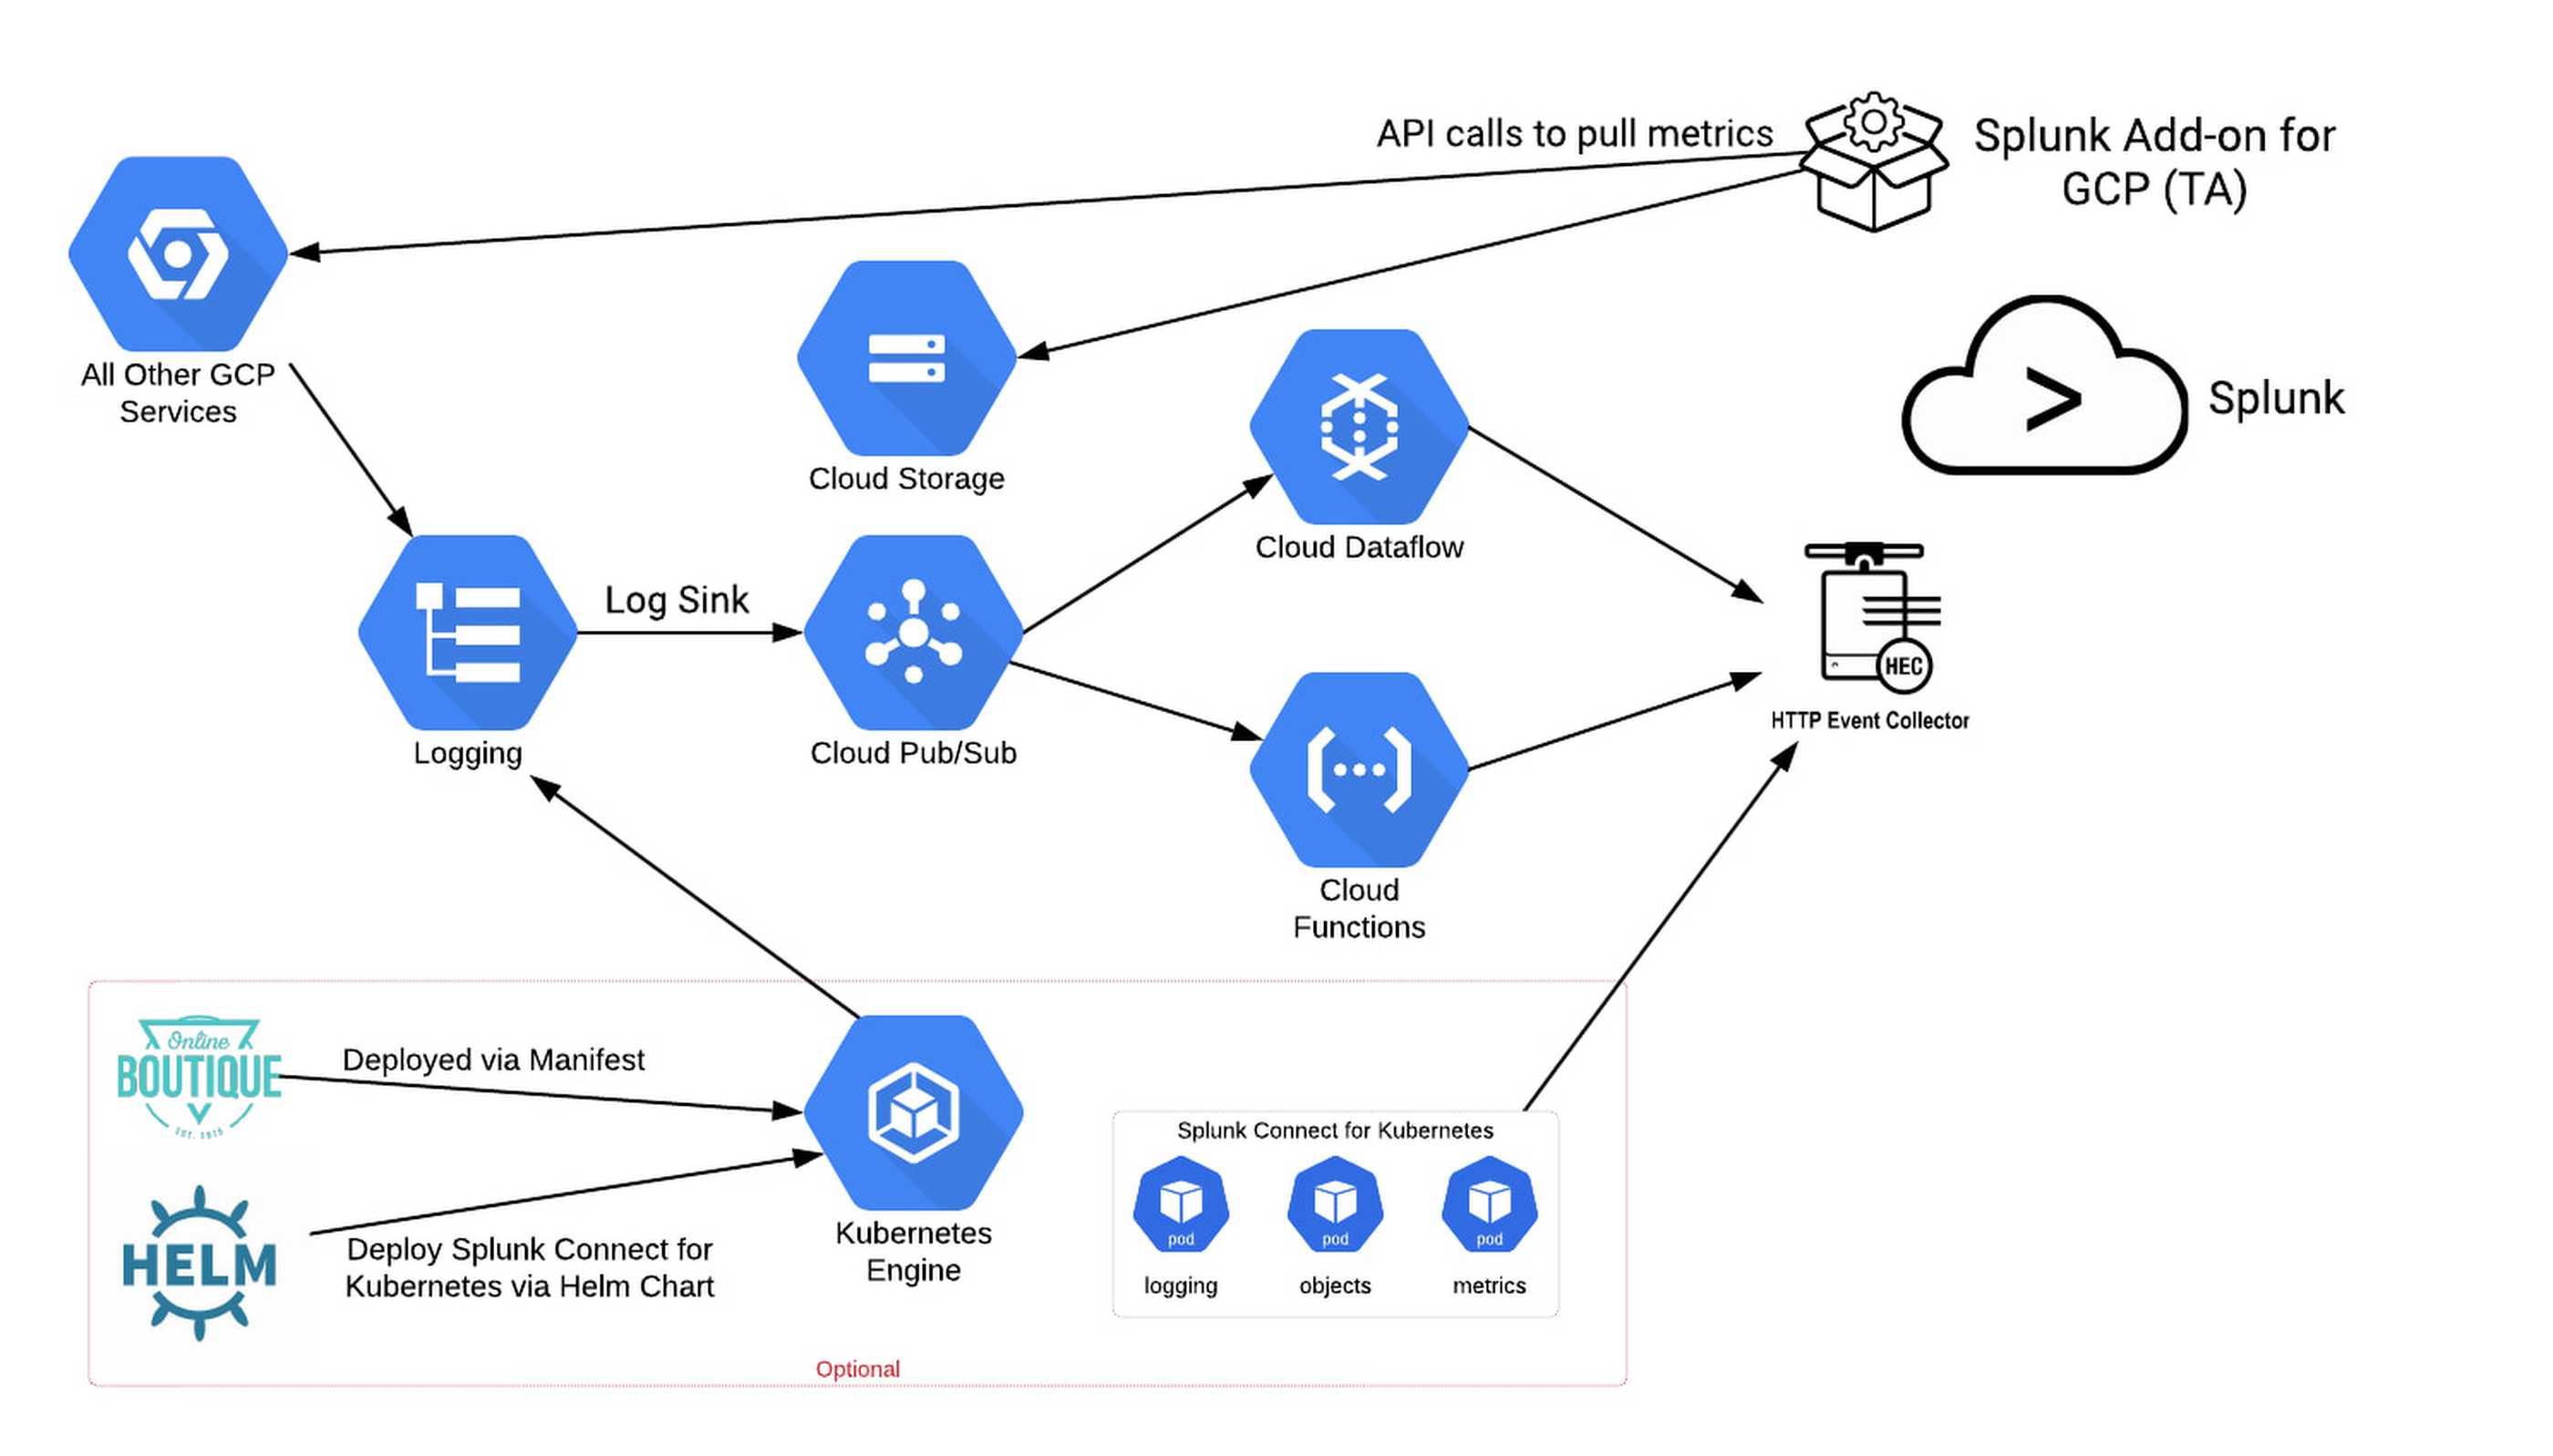
Below is an architecture diagram showing the principal components and the API relationship used in the lab. In addition to Dataflow-based ingestion for Splunk, you’ll practice with Pub/Sub and K8s connector, as well as pulling data using Splunk Add-on for GCP.

This hands-on-lab provides a full-stack practice experience with Splunk on Google Cloud as part of data ingestion and processing. If you’re interested in getting started, please follow the guide here:

Getting Started with Splunk Cloud GDI on Google Cloud  

Looking Ahead with GCP and Splunk 

Stay tuned for the next Google Cloud and Splunk hands-on lab announcement, and in the meantime, check out our official Getting Data In (GDI) guide to learn about the integration after completing the lab. To take a step further and learn more about automating the process, take a look at our export Terraform module with Splunk.

  •  

Bringing gVisor sandboxes to distributed Ray clusters

The reinforcement learning (RL) ecosystem is rapidly adopting Ray as the unified compute runtime for complex post-training workflows. Across Google Cloud, we see customers using Ray for workloads ranging from multimodal data pipelines to frontier RL. But as agentic and reasoning models evolve, a critical bottleneck has emerged: orchestrating secure, isolated sandboxes at scale to safely execute dynamic rollouts, code generation, and multi-turn tool interactions. Today, in partnership with Anyscale, we are excited to introduce an experimental library for Ray that leverages agentic AI technologies being developed at Google to bring native, high-performance sandboxing directly into distributed Ray clusters.

Sandboxes as Ray Primitives

Ray has become a common runtime for orchestrating post-training workloads. Frameworks including veRL, NeMo-RL, SLIME, MILES, and SkyRL already use Ray to coordinate distributed trainers, inference engines, rollout workers, and other components.

When we designed Ray Sandboxing, an important goal was to make it fit naturally into the existing Ray programming model rather than introduce a separate abstraction for isolated execution. A sandbox has many of the same properties as other resources managed by Ray: it needs to be placed on a machine, assigned resources, created and destroyed, recovered from failures, and scaled with the surrounding workload. This led us to represent each high-level sandbox through a Ray Actor:

image1

The Ray scheduler decides which node should run a sandbox and reserves the corresponding CPU and memory resources. The sandbox Actor manages its lifecycle, while gVisor provides the isolated execution environment on that node.

Starting in Ray 2.58, framework authors and researchers can manage sandboxed environments using the same Ray APIs and patterns they already use for the rest of their workload. For example:

code_block
<ListValue: [StructValue([('code', 'import ray\r\nfrom ray.experimental import sandbox\r\n\r\nray.init()\r\n# Create a gVisor sandbox environment and return an actor handle for a proxy actor\r\nsb = sandbox.create(\r\n cpu=1.0,\r\n memory="512Mi",\r\n image="python:3.12-slim"\r\n)\r\n# Execute code inside the sandbox\r\nresult = ray.get(sb.exec.remote("python -c \'import sys; print(sys.version)\'"))\r\nprint(result.stdout)'), ('language', ''), ('caption', <wagtail.rich_text.RichText object at 0x7f094035b130>)])]>

This creates a gVisor sandbox from an OCI-compatible image and returns a Ray Actor handle. Calls to exec are normal Ray Actor calls, so the sandbox can live anywhere in the cluster. The created actor is a proxy that will forward the operations to gVisor.

The sandbox API covers the basic lifecycle needed by agentic workloads:

  • Create environments from OCI container images

  • Set CPU and memory limits

  • Configure environment variables, working directories, and networking

  • Execute commands

  • Read, write, upload, and download files

  • Inspect sandbox state

  • Terminate or delete environments.

For lower-level use cases, SandboxRuntime provides direct access to local gVisor sandboxes and lets users modify the OCI specification before it is handed to gVisor. Here is an example how this API can be used to build a pool of local sandboxes inside of an actor:

code_block
<ListValue: [StructValue([('code', 'import ray\r\nfrom ray.experimental.sandbox.runtime import SandboxRuntime\r\n\r\n@ray.remote\r\nclass SandboxPool:\r\n def __init__(self, size: int = 3, image: str = "python:3.10-slim"):\r\n self.runtime = SandboxRuntime()\r\n self.sandboxes = [\r\n self.runtime.create(image=image, memory="512Mi")\r\n for _ in range(size)\r\n ]\r\n\r\n def run_command(self, index: int, command: str):\r\n return self.runtime.exec(self.sandboxes[index], command)\r\n\r\n def close(self):\r\n for sb_id in self.sandboxes:\r\n self.runtime.delete(sb_id)\r\n\r\n# Deploy an actor managing a pool of local sandboxes\r\npool = SandboxPool.remote(size=3)\r\nresult = ray.get(pool.run_command.remote(0, "python3 -c \'print(\\"Hello from pool!\\")\'"))\r\nprint(result.stdout)\r\nray.get(pool.close.remote())'), ('language', ''), ('caption', <wagtail.rich_text.RichText object at 0x7f094035b1c0>)])]>

Why gVisor?

Running model-generated code means treating the code inside the environment as untrusted. Ray Sandboxing uses gVisor, Google's open-source application kernel, as its initial sandbox runtime. gVisor implements a substantial portion of the Linux system-call interface in userspace, putting an additional isolation boundary between workloads and the host kernel. It is OCI-compatible, works with standard container images, and does not require exposing a Docker daemon or host Docker socket to the sandbox.

This combination is particularly useful for agentic workloads: environments remain lightweight enough to create dynamically while providing stronger isolation than executing generated code directly in ordinary containers. gVisor also provides sub-second sandbox startup and low per-sandbox memory overhead, making it possible to use sandboxes as relatively fine-grained distributed resources.

In future versions of Ray, we plan to extend support to other sandboxing runtimes such as Agent Substrate or Kata Containers.

Try Ray sandboxing on GKE

Check out the Ray documentation to learn more about Ray Sandboxes. To try out these sandboxing capabilities on GKE, head over to the Ray sandboxing User Guide. Have feedback or ideas? Join the discussion on the GitHub issue to collaborate on the future of Ray for reinforcement learning.

  •  

ClusterNetworkPolicy in GKE: Balancing control and autonomy for your microservices

Managing network security in a multi-tenant Kubernetes environment typically requires balancing two distinct needs: developers need their microservices to communicate effectively, while platform and security teams must maintain compliance, prevent lateral movement, and establish cluster-wide guardrails.

Historically, the standard Kubernetes NetworkPolicy has been the primary tool for this. While effective for single-namespace isolation, standard NetworkPolicy is scoped strictly to individual namespaces and designed around developer self-service. When cluster administrators attempt to use it for global security enforcement, it can lead to policy conflicts and operational challenges.

To address this, we introduced ClusterNetworkPolicy (CNP), an open-source standard developed by the Kubernetes SIG-Policy Working Group (WG), to Google Kubernetes Engine (GKE). Designed for scale, CNP is a cluster-wide resource that allows administrators to manage network security centrally, providing a mechanism for those responsible for global security to implement consistent, non-bypassable policies.

Read on for technical details about CNP, some common use cases, an example policy, and how to get started. 

Structuring policies with tiers

A core capability of ClusterNetworkPolicy is its hierarchical tier system. Rather than attempting to reconcile flat, conflicting peer rules simultaneously, CNP establishes a deterministic, top-to-bottom evaluation hierarchy:

  1. The admin tier: The highest precedence level. Rules here are enforced before any other policies.

  2. The network policy tier: The standard namespace level, where developers manage their specific application policies.

  3. The baseline tier: The lowest precedence, establishing the cluster’s default behavior when no other policies apply. This can be overridden using namespace scoped policies.

tiers

This tiered structure helps align network security with organizational roles. Using standard role-based access control (RBAC), you can manage the admin tier to enforce compliance mandates, while platform teams can use the baseline tier to set a default "deny-all" zero-trust posture across the cluster. At the same time, developers can write standard network policies for their applications without overriding core security mandates.

This deterministic, top-to-bottom evaluation method resolves conflicts between different teams' policies. The admin tier introduces an explicit Pass action. This allows security teams to inspect traffic against global rules and then delegate the final Accept or Deny decision down to the developer's namespace policy, facilitating both central oversight and distributed management.

Common network security scenarios

This tiered architecture translates complex security requirements into centralized rules. Here are common scenarios where ClusterNetworkPolicy provides a practical solution:

  • Isolating sensitive workloads: You can apply an admin-tier global deny rule to isolate specific namespaces — such as those used for payment processing or compliance data — from the rest of the cluster. This action overrides any permissive developer policies that might otherwise expose these environments.

  • Protecting core services: To prevent configurations that might disrupt internal operations, administrators can create an admin-tier global allow rule for critical services like kube-dns. This allows these services to remain accessible regardless of any misconfigured namespace policies.

  • Managing external egress: By utilizing IP address range matching, egress traffic can be controlled at the cluster level. This functionality allows you to explicitly restrict or permit access to corporate intranets or external IP ranges, serving as a safeguard against unauthorized data exfiltration.

Example scenario

Consider a common enterprise requirement: Application workloads across all namespaces must be permitted to reach central platform infrastructure (such as shared authentication and telemetry services), while access to sensitive environments — like a restricted vault namespace — is strictly prohibited. Meanwhile, routine microservice traffic is delegated to developer-managed, namespace-scoped policies.

ClusterNetworkPolicy makes this straightforward. A platform administrator simply defines an admin-tier guardrail centrally:

code_block
<ListValue: [StructValue([('code', 'apiVersion: policy.networking.k8s.io/v1alpha2\r\nkind: ClusterNetworkPolicy\r\nmetadata:\r\n name: platform-isolation-guardrail\r\nspec:\r\n tier: Admin\r\n priority: 10\r\n subject:\r\n # Target all application tenant namespaces, excluding system and core infrastructure\r\n namespaces:\r\n matchExpressions:\r\n - key: kubernetes.io/metadata.name\r\n operator: NotIn\r\n values: ["kube-system", "shared-services", "restricted-vault"]\r\n egress:\r\n # 1. Mandate access to central shared platform services\r\n - name: allow-shared-services\r\n action: Accept\r\n to:\r\n - namespaces:\r\n matchLabels:\r\n kubernetes.io/metadata.name: shared-services\r\n\r\n # 2. Enforce strict block on accessing the restricted vault namespace\r\n - name: block-restricted-vault\r\n action: Deny\r\n to:\r\n - namespaces:\r\n matchLabels:\r\n kubernetes.io/metadata.name: restricted-vault\r\n\r\n # 3. Explicitly delegate all remaining traffic to developer namespace policies\r\n - name: delegate-remaining-egress\r\n action: Pass\r\n to:\r\n - namespaces: {}\r\n - networks:\r\n - 0.0.0.0/0\r\n - ::/0'), ('language', ''), ('caption', <wagtail.rich_text.RichText object at 0x7f2488c1ef50>)])]>

Extending open-source foundations

Instead of building this functionality as proprietary extensions, we worked with the Kubernetes community to design the ClusterNetworkPolicy API (policy.networking.k8s.io), distinguishing it from the namespace-scoped NetworkPolicy API (networking.k8s.io). Furthermore, we collaborated closely with the Cilium community to build its implementation of the API.

Because it is built on open-source standards, GKE helps ensure that security configurations remain portable across different environments. The ClusterNetworkPolicy API natively supports tier selection, enabling clear and deterministic policy evaluation. This approach lets administrators enforce robust security guardrails while maintaining the operational flexibility that development teams depend on.

ClusterNetworkPolicy on GKE elevates workload network security — shifting operations from namespace-scoped rules to unified, cluster-wide governance. It is currently in preview in version 1.36 and later. To learn more and get started, check out:

  •  

What’s new in AI infrastructure and orchestration in August

Welcome back to What’s new in AI infrastructure and orchestration this month, a collection of product updates, how-tos, customer stories, research and other resources about all the AI compute, networks, storage, frameworks, and orchestration software that you can find at Google Cloud. To be honest, we thought August would be a slow month, but nothing could be further from the truth. Read on and you’ll see what we mean.

August 2026

Product, technology, and tools updates

  • Product update: Filestore, Google Cloud’s first-party, secure, scalable NFS file service, has emerged as a popular storage platform for AI and agentic workflows, and now, it’s even better suited to the task, with a new backend storage layer built directly on Colossus, Google’s foundational distributed storage system. This new backend lets you provision IOPS independently from storage capacity, and is deeply integrated with GKE. In AI environments, this can help you service so-called agentic swarms — large groups of agents that need to read and write to a common dataset — without a drop off in performance. For more, check out the blog post. 

  • New feature: gVisor sandboxes are now available in distributed Ray clusters on GKE. In partnership with Anyscale, we introduced an experimental library for Ray that brings gVisor, Google’s open-source application kernel, directly into distributed Ray clusters. gVisor provides lightweight environments with stronger isolation than ordinary containers, plus fast startup times and low memory overhead. To try out these sandboxing capabilities on GKE, head over to the Ray sandboxing User Guide.

  • Product update: Looking for high-performance, easy-to-use infrastructure on which to run a personal AI agent, but don’t want to spend a lot of money? New Cloud Run instances are dedicated, singleton compute runtimes on Cloud Run that won’t shut down when the agent is idle. Better yet, the cost to run a Cloud Run instance with 1 vCPU and 1 GiB of memory continuously for 30 days is just $5.70.  

Practitioner guides, documentation and how-tos

  • How-to guide: Big news in Model Context Protocol (MCP) land: As of the 2026-07-28 specification, the protocol core is “completely stateless. The handshake is gone. The initialize / initialized handshake (SEP-2575) and the logical Mcp-Session-Id header (SEP-2567) have been removed entirely. Instead, every request is now self-describing and independent.” Whoa. Learn more about the changes that the latest MCP specification brings, and more importantly, how to implement them, in this Google Developers blog.  
  • Guide: Real-time AI systems make a mess of traditional network load balancing techniques. “Instead of handling isolated requests, the backend has to manage a continuous, live bidirectional stream. You’re dealing with a constant stream of audio chunks, transcripts, model outputs, and synthesized speech flowing back and forth simultaneously.” Things only get worse when the user gets involved. “The server has to immediately halt its current speech generation, pivot to update the context, maybe trigger a new tool, and start drafting a different response; this must be done without dropping the connection.” For a new approach to managing load in the AI era, read Scaling real-time AI agents with session-aware load balancing.
  • How-to: Learn how to build an elastic, scalable LLM inference platform on GKE, even with a mix of different GPU accelerators. The proposed architecture combines Capacity Advisor and Compute Advisor, plus high-performance storage like RunAI:model streamer or GCPFuse with parallel downloads. Get all the details here.
  • Documentation: The thing about hosts with GPUs or TPUs is that you can’t use live migration to update them, setting up a maintenance challenge. In this new docs page, learn how to update accelerator-equipped hosts according to your tolerance for downtime for your training and inference workloads.    
  • Documentation: Advanced Compute Images, or ACIs, are standardized image stacks for AI/ML and HPC infrastructure, so you don’t need to manually build your own custom images. In this new docs page, learn how to create an ACI image using the Google Cloud CLI, console, or SchedMD's Slurm workload manager. 
  • Guide: AI workloads are notoriously difficult to architect, resource-intensive, and bursty, which can also lead to scaling bottlenecks and large pools of underutilized — or misutilized — compute resources. A new blog outlines the three main ways to achieve dynamic capacity management in Google Cloud: 1) scheduling capacity for planned downtime; 2) maintaining automated fallback capacity for unplanned downtime; and 3) relying on GKE’s core orchestration capabilities to automate resource allocation. 

Customer and partner updates

  • Business orchestration software provider UiPath was dealing with spiky workloads, and wanted more predictable costs. To get there, it re-architected its infrastructure, moving from isolated clusters to a shared Google Cloud GPU fleet that included both A3 VM instances (NVIDIA H100 GPUs) for training with G4 VM instances (NVIDIA RTX PRO 6000 Blackwell Server Edition GPUs) for inference. You can read more about their architecture here. 

  • Mirendil, an frontier AI lab focused on accelerating AI development, announced that it is using AI Hypercomputer with both TPUs and NVIDIA GPUs to support its model pre-training and post-training applications. 

  • Replenit, a retail CRM provider, built its AI decision engine in Google Cloud, using BigQuery, Gemini Enterprise Agent Platform, and open-source Gemma models that it runs on Cloud TPUs. This latter combination provided Replenit with 90% lower pipeline costs than their previous cloud provider, the company reports. Read the full case study for more. 

  • Malachyte architected its AI-powered e-commerce recommendation platform on top of Bigtable, Managed Service for Apache Kafka, Pub/Sub, Compute Engine, and last but not least, GKE. See how it all comes together in this blog.


July 2026

Product, technology, and tools updates

  • Product update: Google Cloud Managed Lustre is now GA, and available in four distinct performance tiers that deliver throughput ranging from 125 MB/s, 250 MB/s, 500 MB/s, to 1000 MB/s per TiB of capacity — with the ability to scale up to 8 PB of storage capacity. The Managed Lustre solution is powered by DDN’s EXAScaler, combining DDN's decades of leadership in high-performance storage with Google Cloud's expertise in cloud infrastructure.

  • Product update: C4N network and storage optimized VMs are now GA. C4N is our first network- and block-storage-optimized VM series built to eliminate data-transfer bottlenecks. Powered by 5th Gen Intel Xeon Scalable processors and built on Google's Titanium offloading hardware, it achieves 400 Gbps network bandwidth, 95 million packets per second (MPPS), and up to 25 GiB/s of block storage throughput when paired with Hyperdisk Extreme.

  • New feature: GKE Dataplane V2 up to 15K Nodes with Network Policies (GA). This capability enables standard GKE clusters to scale up to 15,000 nodes while maintaining full active Network Policy enforcement, supporting the massive infrastructure needs of large enterprise and AI/ML customers.

  • New feature: Co-operative time-slicing in llm-d. If you’re running reinforcement learning (RL) workloads, you can now interleave independent RL jobs onto shared physical hardware, increasing aggregate accelerator duty cycles from a ~40% baseline up to 70% without impacting model convergence or accuracy. 

  • New AI security tool: Looking to secure your AI supply chain on GKE, deploy AI workloads safely, and cut down on shadow AI? We open-sourced k8s-aibom, a lightweight, unprivileged Kubernetes controller that continuously monitors container clusters to automatically detect running AI runtimes (like vLLM and Triton) and generate standard CycloneDX Machine Learning Bill of Materials (ML-BOMs). Check out the k8s-aibom project and get involved.

Practitioner guides and how-tos

  • How-to guide: On July 27, Google announced Day 0 support for Moonshot AI’s Kimi K3 2.8-trillion-parameter open-weight model, the day weights were released. Whichever your preferred deployment path — via Model Garden, custom orchestration, or GKE with llm-d recipes — this guide offers detailed step-by-step instructions to help you evaluate and pilot Kimi K3 in Google Cloud. 

  • How-to guide: Google Kubernetes Engine (GKE) managed DRANET supports both GPUs and TPUs. There are several configurations to use this implementation, including standard cluster (where you have full control) and autopilot cluster (where Google does the heavy configs for you). Take a deeper dive in the hands-on lab, GKE Autopilot clusters with TPUs, GKE managed DRANET and Gemma 4.

  • How-to guide: Learn to run Ray on TPUs, not GPUs. In Part 1 of this two-part series, we discuss TPU slices (hint: Ray thinks of them as just another accelerator on which to schedule), then walk through Ray’s various AI libraries (Part 2).

  • How-to guide: Evaluate TPUs for sample workloads using a new microbenchmark suite that helps you accurately assess whether a device is achieving its theoretical performance specifications, and to identify specific performance gaps or architecture-specific bottlenecks. Dive in here. 

  • How-to guide: Scale your agents without killing your budget. Learn how GKE orchestration can help you safely pack more agents onto a fixed compute footprint with GKE Agent Sandbox and Pod snapshots. Whether your goal is performance or cost optimization, we teach you how to turn the right dials for optimal agent efficiency. 

  • Technical blueprint: Inside the optimization of Mistral 3 large inference on Ironwood. This blog outlines how one Google team optimized Mistral 3 large MoE model inference on Google’s Ironwood (TPU v7x), achieving a 1.5x performance gain. They did so with hybrid sharding, replacing linear VPU summations with tree reductions, optimizing GMM/MLA kernels, and adopting asynchronous scheduling. As a result, they boosted throughput by up to 48% while maintaining benchmark accuracy neutrality. Read the full blog here.

Research, reports and deep-dives

  • Report: Google was named a Leader in the inaugural GartnerⓇ Magic Quadrant™ for AI Infrastructure, positioned highest for ‘Ability to Execute’ and furthest for ‘Completeness of Vision’. Gartner called out Google’s proprietary scalable compute, integrated AI Hypercomputer architecture, and the scale of our AI compute capacity as key strengths. Download a copy here.

  • Report: We recently surveyed more than 1,400 senior IT leaders for our State of AI Infrastructure report, and a resounding pattern emerged: The gap between AI ambition and infrastructure reality is widening. In fact, 83% of organizations say they require infrastructure upgrades to support production-grade agentic AI. Read the accompanying blog to understand how adapting your infrastructure to meet the demands that agentic applications place on your systems will help you move from pilot to production.


June 2026

Product, technology and tool updates

Practitioner guides and how-tos

  • How-to guide: Learn how to build high availability into an AI inference workload running on GKE Inference Gateway with TPUs, Cloud Storage FUSE and Dynamic Resource Allocation (DRA). This blog provides an overview, or you can get all the technical details in the hands-on codelab.

  • How-to guide: Did you know you can connect your AI agents to unstructured data in Cloud Storage via Model Context Protocol (MCP)? In this blog, learn about why would want to do that from three customer examples, then how to do it, choosing either a fully managed service, or a self-managed local server for more customization and control. 

Research, reports and deep-dives

  • Report: According to an independent benchmark report, GKE Inference Gateway outperforms the next leading managed Kubernetes service with 15.7% higher throughput, 92.8% shorter wait times, and 62.6% lower inter-token latency. This performance can be attributed to its use of prefix caching, which optimizes LLM performance by storing the KV cache (activation states) of long, repetitive prompt prefixes. Learn more in the blog. 

  • Architecture deep dive: A closer look at the cold start problem, this time for TPUs and GKE, and how the Run:ai Model Streamer can help change the dynamic. 

Customer and partner updates


May 2026

Product, technology and tool updates

  • Product update: GKE Agent Sandbox is now generally available.

  • New open-source project: Agent Substrate is a new open-source project aimed at continuing to push the limits of agentic infrastructure density

  • New feature: Google AI Edge Portal, a solution for testing and benchmarking on-device machine learning (ML) at scale, now supports benchmarking and debugging on-device LLMs. Read more here. 

  • Product deep dive: We went into depth about Cloud Storage Rapid, a new family of high-performance storage offerings for AI workloads. At launch, offerings include Rapid Bucket (formerly Rapid Storage), a high-performance zonal object storage offering, and Rapid Cache (formerly Anywhere Cache), which accelerates reads on-demand and colocates compute and data for workloads in existing buckets. 

Research, reports and deep dives

Customer and partner updates

  •  

Do more with less: How GKE can reduce your cost per agent by 75%

In today’s agentic era, modern cloud applications are evolving from a set of passive tools to fleets of autonomous digital workers that reason, plan, and take action across a wide range of tasks. 

For platform engineering teams designing these environments, the simplest approach is often to deploy an agent on to an open-source framework like OpenClaw and Hermes running on  a virtual machine (VM). But as those workloads move into production and scale to support additional users or use cases, teams quickly hit a critical challenge: AI agents tend to operate in bursts; for a while they actively process requests or execute code, followed by long periods of inactivity while awaiting user input or external triggers. If you rely on static compute allocations, idle agents are still consuming valuable CPU and memory. 

The question becomes: how do you safely pack more agents onto a fixed compute footprint without sacrificing reliability, scalability, or efficiency?

The answer is to incorporate orchestration upfront as a holistic part of your architecture. Orchestration helps you unlock dramatically improved unit economics and scalability, ease of use, and reliability from day one. Google Kubernetes Engine (GKE) offers sophisticated orchestration capabilities. To help you make the most of your compute capacity, we tested the maximum number of AI agents that can be packed onto a single GKE node running on a fixed Google Compute Engine VM instance (n2-standard-48) — without performance degradation, or repeated failures. Using an OpenClaw profile, we applied progressive optimizations to demonstrate the meaningful role that orchestration can play in running agentic workloads at scale — read on to learn more.

agent_density_blog_img_1

Baseline: Running OpenClaw on microVMs 

Running untrusted, multi-agent workloads securely requires strong isolation. A common approach is to run each agent inside a dedicated microVM (such as Kata containers) on a Kubernetes deployment, which provides strong hardware-level isolation. 

While this provides the necessary security boundary, it hits a scaling wall almost immediately. Every microVM requires its own guest operating system that consumes memory and CPU resources, limiting the actual resources available for your actual agents. In this baseline scenario, we hit a scaling wall at 61 OpenClaw agents on a standard GKE node before reliability dropped and workload health checks began to fail regularly.

Optimization 1: Pushing density with GKE Agent Sandbox

To address this, we migrated the same agent workload from microVMs to GKE Agent Sandbox, a Kubernetes primitive that’s designed specifically for the security and performance requirements of running agents.

Instead of relying on heavy guest operating systems, GKE Agent Sandbox leverages the open-source secure container sandbox, gVisor. gVisor uses a user-space kernel (the Sentry) to intercept and filter system calls. This provides secure, production-grade isolation for untrusted code execution while maintaining the lightweight footprint of standard Kubernetes containers.

This reduced overhead improves the efficiency of the sandbox itself, resulting in being able to deploy 88 OpenClaw agents inside the same VM before failure — a 44% increase in the number of agents you can run on the same fixed capacity while maintaining a highly reliable security perimeter.

It’s no surprise then, that when GKE Agent Sandbox reached General Availability in May, its usage grew more than 7x in under four weeks.

Key takeaway: In our tests, migrating OpenClaw-type agents to GKE Agent Sandbox enabled us to run more than 40% more agents per vCPU, and reduced the cost per agent by more than 30%, all while maintaining a similar performance profile.

Optimization 2: The value of orchestration

While the GKE Agent Sandbox optimizes active workloads, solving the problem of idle AI agents requires making workload orchestration a central part of your agent architecture.

Rather than keeping idle agents running in the background, you can use GKE Pod snapshots to checkpoint (freeze) them to persistent storage, which releases their physical CPU and memory resources back to the cluster. When a new task trigger arrives, a lightweight Kubernetes controller or event gateway intercepts the request and signals GKE to resume the agent from the snapshot. This happens in milliseconds. 

This pattern lets you reliably oversubscribe physical compute resources based on workload behavior, so you can fit more agents on the same node. However, oversubscription isn’t a one-size-fits-all approach and comes with a set of tradeoffs: Different AI agents have different latency requirements and execution models. If you treat all agents the same, you will either degrade your user experience with latency, or bankrupt your project with over-provisioned VMs.

With GKE, you can run an agent platform that supports tailored deployments for different types of agents and use cases, each fine-tuned to their unique performance and cost requirements.

image1

GKE supports a spectrum of agent workload behaviors, balancing latency sensitivity against resource density.

Here are some examples of agentic workloads with very different performance requirements:

  • Real-time coding assistant (latency-sensitive): Direct developer-facing agents need sub-second startup times (<1s) and have zero tolerance for queueing. By pairing GKE Pod snapshots with Agent Sandbox Warm Pools, GKE maintains pre-warmed, isolated sandboxes that can be executed nearly instantaneously.

  • Autonomous teammate (balanced): Interactive background agents can tolerate average startup times (a few seconds). GKE suspend and resume functionality restores these agents on demand, so they don’t consume compute resources while they are idle.

  • Headless background agent (latency-tolerant): Scheduled daily research or analysis cron jobs can tolerate queueing delays; you’re not going to compromise business outcomes by waiting to execute these jobs for an hour while cluster capacity becomes available. To save on costs for these kinds of agents, go ahead and use maximum resource oversubscription.

In other words, rather than forcing you into a single cluster-wide strategy, GKE supports different behaviors simultaneously across node pools and workload configurations.

Consider the "thundering herd" problem, where a surge of agents all wake and demand compute simultaneously. GKE offers a tunable dial with features like Agent Sandbox warm pools and suspend and resume to balance potential cost savings against guaranteed performance based on your specific requirements — performance- or cost-optimized:

  • Performance-optimized: If your use case requires guaranteed, sub-second performance during massive, sudden traffic spikes, you can provision buffers using Agent Sandbox warm pools. In this configuration, we were able to run 133 OpenClaw agents on the same node.

  • Cost-optimized: For workloads that are latency-tolerant or that can be staggered, higher oversubscription ratios significantly increase node density. In this configuration, we ran 274 agents on the same node (>3x more agents than the baseline) while keeping startup times under five seconds.

Key takeaway: By combining GKE Agent Sandbox with GKE’s suspend and resume capabilities, you can freeze idle agents to oversubscribe fixed compute capacity. For agents with intermittent activity, this can enable up to 3.5x greater agent density and cost reductions of up to 75% per agent.

Scale your agents, not your budget

Scaling your agents shouldn’t mean linearly scaling your infrastructure budget. As our examples show, adopting the right platform features and considering orchestration from the get-go can dramatically alter the value you get from your compute capacity. GKE allows you to easily align your infrastructure with your business goals — whether that means prioritizing aggressive cost savings or optimizing for performance.

And this is just the beginning. At Google Cloud, we’re continuously innovating new ways to help you manage the demands of the agentic era. Ready to get more out of your compute capacity? Check out the GKE Agent Sandbox documentation and learn how GKE is helping teams innovate faster for less.

  •  

Minimize idle accelerators: Native RL job interleaving with co-operative time-slicing in llm-d

The math behind reinforcement learning (RL) post-training for large language models (LLMs) is notoriously unforgiving. As frontier AI labs push the boundaries of reasoning and coding models using RL post-training algorithms like Group Relative Policy Optimization (GRPO), they routinely hit hard architectural and infrastructure constraints. While much of the industry's focus remains on acquiring raw accelerator capacity, infrastructure efficiency is equally critical for achieving the high velocity needed to run multiple RL jobs and drive models to higher levels of intelligence. At scale, distributed RL suffers from severe resource bottlenecks because synchronous sampling and training run as strictly sequential phases, causing trainer and sampler resources to alternate sitting idle. Meanwhile, asynchronous architectures attempt to overlap these phases, but trainers still experience frequent idle gaps while waiting for specific trajectory batches to finish before starting the next cycle. 

Today, we are introducing a solution to this structural waste: co-operative time-slicing through the llm-d project. By treating discrete RL steps — such as sampling rollouts and gradient training — as dynamic, schedulable entities, we can interleave independent RL jobs onto shared physical hardware. Our initial benchmarks show that this platform-level multiplexing increases aggregate accelerator duty cycles from a ~40% baseline up to 70% without impacting model convergence or accuracy. This improves price-performance and lowers TCO significantly by eliminating wasted compute accrued over time.

For synchronous setups, the platform interleaves both samplers and trainers to minimize alternating idle windows, while asynchronous workloads leverage time-slicing to dynamically reclaim and utilize the fragmented idle gaps between RL-trainer iterations.

image_1

Throughout this blog, we will describe the time-slicing solution, detailing the technical flows, current release and future roadmap. 

llm-d for RL infrastructure efficiency (the bigger picture)

From the get-go, we anticipated the severe infrastructure bottlenecks of large-scale RL post-training and invested in addressing infrastructure inefficiency for RL workloads. 

We have built llm-d into a highly composable infrastructure stack for inference, agentic and RL workloads focused on eliminating accelerator idle time. The llm-d stack for RL features:

  1. Throughput-driven inference (llm-d-router): A mature, production-tested engine deployed across RL workloads and focused on maximizing rollout generation throughput to continuously saturate the pipeline.

  2. High-velocity Agent Sandbox (recipe): Tested for scale and density, and helping deliver secure, sub-second tool-use and isolated code execution during rollout generation and evals. Agent Sandbox serves as the high-speed intake manifold for reward signal generation, helping ensure the Sandbox never becomes the latency bottleneck that starves your time-sliced NVIDIA GPUs.

  3. Core pipeline primitives: To combat reliability and speed in weight transfer, we are building Weight Propagation Interface (WPI), as well as focusing on improving overall observability and reliability for RL. 

The efficiency problem with RL loops

Distributed RL post-training operates as a fragmented, continuous cycle alternating between generation (sampling rollouts) and optimization (gradient updates). Because traditional cloud infrastructure is designed for continuous, steady-state workloads, standard Kubernetes clusters can’t adapt to this alternating cadence.

image_2

At scale, this structural cadence introduces two massive systemic inefficiencies:

  • Idle accelerators: Because these phases occur sequentially, GPU clusters sit completely idle (0% utilization) for 40% to 60% of their lifecycle. Trainers sit idle waiting for sampling rollouts to finish; samplers sit idle during gradient updates and weights distribution. This could represent millions in wasted capital annually.

  • Locked-in context: RL training and samplers hold their accelerator allocations for the entirety of their runtime even during idle phases because the NVIDIA CUDA context and all device memory needs to remain resident. Standard schedulers treat these pods as static, siloed allocations rather than aligning them to the alternating, phase-level states of the live RL loop, leaving valuable hardware locked up even during inactive phases.

Importantly, this is not just a synchronous RL problem. Asynchronous variants overlap generation and training, but they do not fully mitigate idle time. Generation remains the inherent bottleneck of the RL loop, meaning trainer accelerators still starve while waiting for rollout data to accumulate. The closer an asynchronous job runs to on-policy, the larger those idle windows become — bounded staleness limits how far generation and training can drift apart, stalling the pipeline whenever fresh rollouts are not ready. 

How co-operative time-slicing (RL job interleaving) helps

To eliminate idle accelerators during RL jobs, co-operative time-slicing under the llm-d project allows the infrastructure to dynamically interleave independent RL jobs onto shared hardware blocks rather than forcing hardware to wait on upstream phases. This helps drive aggregate accelerator utilization up without altering the underlying model convergence or accuracy.

When Job A goes idle at a phase boundary in synchronous RL (or stalls on fresh rollout data in asynchronous RL), the infrastructure time-slices the physical accelerators, swapping in the active sampling or training phase of Job B. Under the hood, a swap is a checkpoint/restore: Job A's entire device state is checkpointed out of accelerator memory into host DRAM, and Job B's previously saved state is restored in its place. Because only one job's state ever occupies the accelerator at a time, steps alternate safely without framework-level interference or out-of-memory (OOM) faults.

image_3

Time-slicing: High-level architecture 

The time-slicing system architecture is organized into three layers: workload-scoped (application logic), cluster-scoped (coordination), and node-scoped (hardware management).

Workload-scoped layer (application runtime)
This is where the user's code runs — training loops, inference servers, and RL frameworks. The new addition is the time-slice client library, which exposes two gRPC APIs on the time-slice orchestrator: acquire() to request exclusive accelerator access, and yield() to release it. The user wraps any accelerator-touching phase with these calls to signal phase boundaries to the orchestrator. Everything else — the ML framework (PyTorch FSDP, vLLM, etc.), the CUDA context, the accelerator memory allocations — runs unmodified.

Cluster-scoped layer (control and orchestration plane)
This layer decides which job gets accelerator access, and when. Jobs that share the same physical accelerators — for example, two RL jobs interleaving on the same set of GPU nodes — are placed into a group. For each group, the time-slice orchestrator maintains a lock queue — an ordered list of jobs waiting for exclusive access to that group's accelerators. Only the job at the head of the queue holds the lock and runs on the hardware; all the other jobs wait, blocked on their acquire() call. When the running job calls yield(), the orchestrator passes the lock to the next job in the queue and triggers a coordinated context switch across every node in the group. In the future, a workload placement optimizer will be able to profile workload phase patterns and automatically pair jobs with complementary idle phases, removing the need for the user to explicitly indicate job groupings.

Node-scoped layer (hardware and data plane isolation)
This layer performs the checkpoint/restore swap on each accelerator node. The snapshot agent, a privileged DaemonSet, receives directives from the orchestrator and translates them into hardware-level operations — pausing accelerator processes, serializing device state to host DRAM, and restoring it when the job regains access. The agent is built around a pluggable backend interface, with cuda-checkpoint as the first implementation (more to come). Future backends will introduce faster snapshot mechanisms and more selective approaches, such as offloading specific memory addresses like LoRA adapters instead of full device state. The agent itself is designed to run standalone outside Kubernetes for bare metal and Slurm environments.

The flow: How it all comes together

image_4

When a workload finishes its current accelerator phase, its time-slice client library calls yield() to the time-slice orchestrator to release access. The orchestrator initiates the context switch by sending directives to the snapshot agent on each node in the group. The agent freezes the yielding workload's processes and moves its device state from accelerator memory into host DRAM.

With the accelerators vacated, the orchestrator grants the group lock to the next workload waiting in the queue. It directs the Snapshot Agents on those nodes to restore that workload's previously saved state from host DRAM back into accelerator memory, then unblocks the workload's pending acquire() call. The workload resumes execution exactly where it left off — no container restart, no framework reinitialization, no model reload from storage.

The yielding workload remains warm in host DRAM. When the orchestrator grants it the lock again, the Snapshot Agents perform the same swap in reverse.

Developer experience (client-side)
Researchers want to focus on core modeling logic rather than wrestling with low-level CUDA context switching or custom scheduling loops. If you use Ray or a similar platform to orchestrate your RL job, using time-slicing will have a minimal impact on the client side. In fact, there may not be any impact on the client side at all if you are queuing the training and sampling jobs separately at the platform level.

code_block
<ListValue: [StructValue([('code', 'from timeslice import TimeSliceOrchestratorClient\r\n\r\norchestrator = TimeSliceOrchestratorClient(target="orchestrator:50051")\r\n\r\n@orchestrator.on_accelerators(group_id="trainer-group")\r\ndef train_phase(model, trajectories):\r\n return model.update(trajectories)\r\n\r\n@orchestrator.on_accelerators(group_id="sampler-group")\r\ndef generate_phase(model, prompts):\r\n return model.generate(prompts)\r\n\r\n# Standard sequential loop — interleaved with other jobs under the hood\r\nfor epoch in range(EPOCHS):\r\n trajectories = generate_phase(policy, dataset)\r\n rewards = compute_rewards(trajectories)\r\n train_phase(policy, rewards)'), ('language', ''), ('caption', <wagtail.rich_text.RichText object at 0x7fa062f02cd0>)])]>

Current release and future outlook

Today we are releasing the full time-slicing stack: the Snapshot Agent, the Accelerator Orchestrator, and the Python client libraries, each with a user guide for integrating time-slicing into your RL workloads. 

Key roadmap highlights include:

  • Latency and state optimization: Expanding the Snapshot Agent with faster checkpoint/restore backends to minimize context-switch overhead, alongside application-aware backends for selective memory region snapshotting (e.g., swapping LoRA adapters instead of full model weights).

  • Automated scheduling and onboarding: Introducing an automated scheduler to profile running processes, identify time-sliceable structures, and handle job placement dynamically. 

  • Cross-hardware compatibility: Extending data plane support beyond GPUs to TPUs and custom accelerator architectures.

Get started 

Building robust, highly optimized RL infrastructure requires tight collaboration with the engineers and researchers running these workloads at scale.

If you are currently wrestling with low GPU utilization, synchronization stalls, or complex scheduling logic in your post-training pipelines, time-slicing can help. To get started, check out the following resources, and don’t forget to leave us your feedback!

  • Start using time-slicing during your RL run immediately with these user guides.

  • Try llm-d-router (kubernetes native) or the RL Scheduler (python library) user-guide for improved sampling throughput during the RL generation phase.

  • Explore the Weight Propagation Interface repo. 

  • Join the discussion in the #sig-rl channel in the llm-d Slack.

  • Contribute by sharing your reference implementations, benchmarks, and edge cases to help us refine this path.


Thank you to Dolev Ish Am and Bogdan Berce for their contributions to this blog post.

  •  

Securing the AI supply chain on GKE: Introducing k8s-aibom for automated AI BOMs

How should your security team manage shadow AI? Workloads deployed by developers without formal registration can often evade traditional security scanners, because organizations are reluctant to slow down development and compromise stability by demanding privileged Daemonsets, kernel-level access, and manual pod-spec edits.

To break this deadlock, today we are open-sourcing k8s-aibom. This lightweight, unprivileged Kubernetes controller continuously monitors the cluster API and container environments to automatically detect running AI runtimes (like vLLM and Triton) and generate standard CycloneDX Machine Learning Bill of Materials (ML-BOMs). 

By providing automated, audit-grade visibility directly from runtime execution — regardless of whether the workload was formally registered — k8s-aibom can help teams safely move AI projects from pilot to production without developer integration friction.

The architecture of zero friction

k8s-aibom is designed from the ground up to respect both the CISO mandate for total visibility and the SRE mandate for cluster stability. It deploys as a single, unprivileged Deployment in the k8s-aibom-system namespace. It involves zero developer friction — no sidecars, no eBPF kernel modules, no privileged DaemonSets, and no modifications to existing developer pod specifications.

k8s-aibom

k8s-aibom watches for AI workloads and produces BOMs.

The discovery pipeline executes through four clear stages:

  1. Scrape cluster workloads: The controller continuously monitors KServe resources, Deployments, StatefulSets, DaemonSets, and Jobs across the cluster.

  2. Identify AI stacks: Advanced pattern matching inspects container images, environment variables, and command-line arguments to detect serving runtimes (vLLM, Triton Inference Server, TGI, Ollama), autonomous agent frameworks (LangChain, AutoGen, CrewAI), vector databases and RAG stores (Milvus, Qdrant, pgvector), as well as distributed training jobs and evaluation harnesses.

  3. Generate standard manifests: The controller compiles the discovered artifacts into formal OWASP CycloneDX 1.6 Machine Learning Bill of Materials (ML-BOM) documents.

  4. Export to sinks: The controller attaches the resulting ML-BOM directly to the custom resource status (status.bomDocument) of an in-cluster AIBOM Custom Resource (CR) and routes it to optional external sinks, including Google Cloud Storage buckets and external webhook endpoints.

Application teams do not need to modify their pod specifications, inject sidecar containers, or alter their continuous integration and continuous delivery (CI/CD) pipelines. Furthermore, k8s-aibom treats the Kubernetes cluster state as a pure functional input: Identical cluster inputs produce byte-identical ML-BOM documents. This deterministic property makes k8s-aibom an ideal fit for GitOps workflows, enabling site-reliability engineers (SREs) to perform exact diffs and trigger precise change-detection alerts when AI dependencies drift.

Where existing AIBOM tooling falls short

Many AI BOM solutions offer build-time scanners producing BOMs from artifacts at rest. These tools help you track the code that was intended to be deployed. 

Commercial AI security platforms extend the picture with cloud-native posture management, but typically through external scanning shaped around vendor-specific data models. Few, if any, of these tools help compliance reviewers, security operations (SecOps) teams, and platform engineers understand what is running right now, what is it connected to, and how can we verify those assertions. 

We purpose-built k8s-aibom to bridge that gap. It produces BOMs from live cluster observation rather than artifact scanning, emits standards-conformant CycloneDX 1.6 ML-BOMs that integrate with the broader OWASP and Open Source Security Foundation (OpenSSF) supply-chain ecosystem rather than vendor-proprietary formats, and runs as an unprivileged controller on any conformant Kubernetes cluster — making it complementary to existing build-time and posture-management tooling rather than a replacement for either.

The Confidence Model: Separating intent from inference

For compliance auditors and SecOps engineers, raw telemetry is often noise. Standard monitoring tools indicate that a container is running, but can’t prove whether an AI model was explicitly configured by a platform engineer or dynamically pulled by an autonomous script at runtime. k8s-aibom solves this ambiguity through its deterministic Confidence Model, categorizing discovered assets into distinct tiers:

  1. Declared: Explicitly defined by the customer or developer in the workload configuration (For example, explicitly passed container arguments such as --model meta-llama/Llama-2-7b.) A “declared” confidence detection represents clear human intent.

  2. Inferred: Derived autonomously by the controller's pattern-matching engine through deep inspection of container images, environment variables, and execution profiles. (For example, identifying ^vllm/.* container signatures.)

  3. Unresolved: Applied to workloads where an active AI presence is detected, but exact model parameters, weights, and versions can’t be deterministically established. An “unresolved” confidence detection immediately flags the workload for targeted security review.

This structured taxonomy allows compliance reviewers to instantly separate explicit engineering intent from machine inference, establishing an unassailable chain of trust during audits.

Immutability and least privilege: Building an audit-grade security model

Auditors remain deeply skeptical of standard observability telemetry because logs and metrics can be modified, dropped, and tampered with by compromised nodes or elevated administrators. k8s-aibom establishes an audit-grade evidence trail built on strict least-privilege isolation and data immutability.

The controller operates under a dedicated Kubernetes service account bound to a minimal Identity and Access Management (IAM) Workload Identity. It acts as the sole identity authorized to write BOM records to external storage sinks, requiring only roles/storage.objectCreator permissions.

To satisfy the most stringent audit and evidentiary standards, the Google Cloud Storage external sink implementation enforces DoesNotExist preconditions on object creation. Once an ML-BOM is written to the Cloud Storage bucket, the object becomes cryptographically immutable. 

It can’t be silently overwritten, modified, or retroactively tampered with by compromised cluster actors or rogue workloads. SecOps teams gain absolute assurance that the historical audit log presented to regulators represents an unalterable record of cluster execution.

Accelerating governance readiness: Mapping to global regulatory frameworks

By automating the generation of standardized CycloneDX 1.6 ML-BOMs, k8s-aibom directly bridges the gap between low-level Kubernetes runtime state and high-level governance frameworks. It unblocks stalled GKE AI deployments by providing the foundational empirical data essential to major global standards:

  • EU AI Act: Designed to help organizations align with Article 12 (automated logging and record-keeping for continuous traceability) and Article 50 (transparency obligations for AI systems). By automatically cataloging serving runtimes and agent stacks, the tool helps simplify the gathering of technical evidence that may be needed during compliance audits.

  • NIST AI Risk Management Framework (AI RMF): Provides continuous, empirical asset visibility that can help support the Govern, Map, Measure, and Manage functions, helping shift compliance workflows from purely manual checks toward more automated asset inventory tracking.

  • ISO/IEC 42001:Supports compliance efforts for AI management system asset discovery and tracking, reducing the reliance on manual spreadsheets or periodic snapshot audits for inventory validation.

Getting started

It’s rare that a technical solution like k8s-aibom can help mitigate the multi-faceted problem of shadow AI, impacting CISOs, governance, risk, and compliance teams, SecOps teams, platform engineers, and developers.

To learn more by inspecting the controller, review the CRD definitions, and contribute to the open-source k8s-aibom project, please visit the k8s-aibom GitHub Repository.

  •