❌

Vue lecture

Introducing enhanced custom event buses in Amazon EventBridge for enterprise-scale event-driven applications

Organizations building event-driven applications on Amazon EventBridge typically start with a single custom event bus in one account. This works well when a single team owns the architecture. As adoption grows across the organization, though, things get complicated. AWS best practices recommend a multi-account structure, which means each team runs in its own account. To route events between them, teams create multiple event buses connected through cross-account rules or bus-to-bus configurations. This workaround reintroduces the operational complexity that serverless architectures are meant to eliminate. Platform teams lose visibility into who is subscribing to which events, cross-account and bus-to-bus routing charges compound quickly, and teams that need capabilities like event ordering are forced to build complex workarounds or adopt entirely different technologies.

Today, we are announcing an enhanced custom event bus in Amazon EventBridge, purpose-built for organizations scaling event-driven applications across teams and accounts. With the new enhanced custom event bus, you can deploy a single, centralized event bus shared across all AWS accounts in your organization, with ordering guarantees, a simplified Subscriber resource, and a new pricing model that delivers improved economics at scale and cost allocation for publishers and subscribers.

Let’s try it out
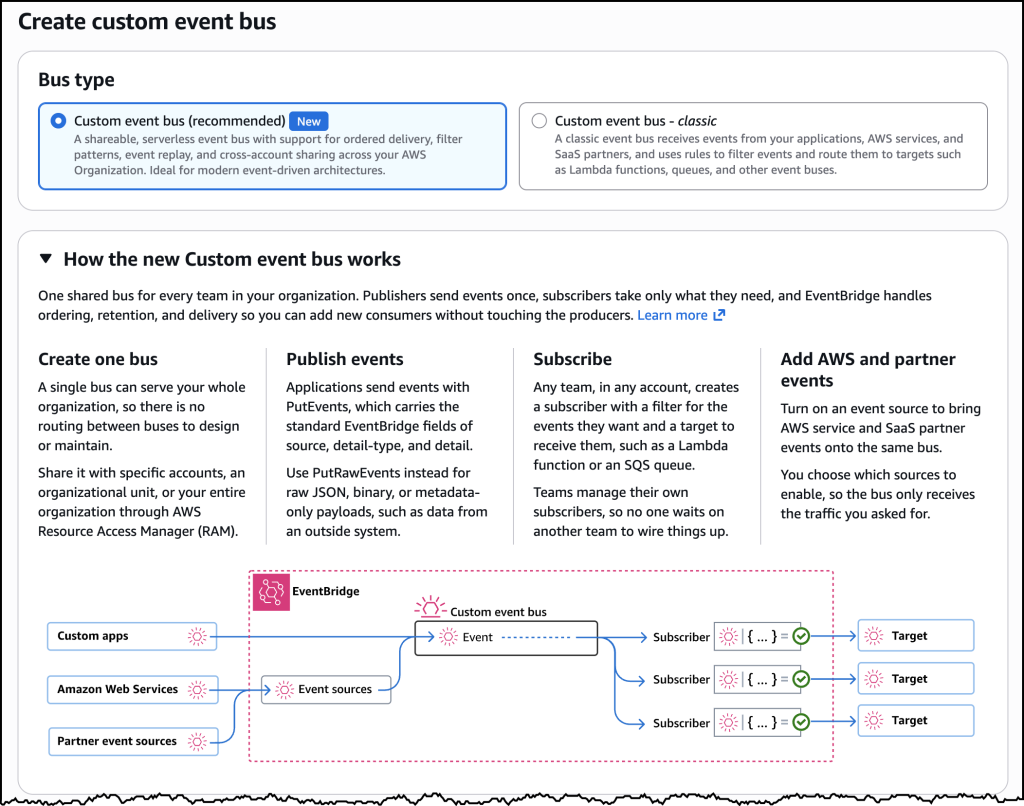
To get started with an enhanced custom event bus, I navigated to the EventBridge console in the AWS Management Console and opened the Create custom event bus page. I selected Custom event bus, the recommended option labeled New. The page also offered Custom event bus – classic, which continues to receive events and route them with rules and targets. Below the selection, EventBridge showed how the new bus works. One shared bus serves every team in the organization. Publishers send events, subscribers consume only what they need, and EventBridge handles ordering, retention, routing, and delivery.

The Create custom event bus page. Custom event bus is the recommended new option, with ordered delivery, filter patterns, event replay, and sharing across your AWS organization. Custom event bus – classic remains available for existing workloads.

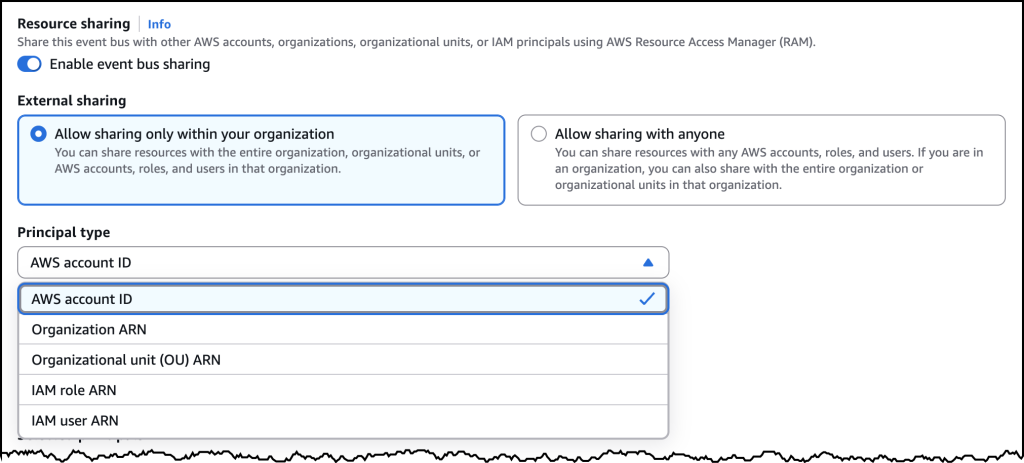
Next, I configured resource sharing. I turned on Enable event bus sharing and selected Allow sharing only within your organization. I chose AWS account ID as the principal type. I could also share with an organization, an organizational unit, or an AWS Identity and Access Management (IAM) role or user. Sharing uses AWS Resource Access Manager (AWS RAM), so I did not have to set up cross-account permissions or bus-to-bus routing myself.

Resource sharing on the new custom event bus. I enabled sharing within my organization through AWS RAM and selected an AWS account as the principal, which is how teams publish and subscribe on the same bus without extra routing.

Organization-wide sharing
With the new enhanced custom event bus, you can create a single event bus and share it across all AWS accounts in your organization. Platform teams deploy one bus and establish it as the central event backbone, eliminating the need to configure cross-account permissions or bus-to-bus routing. Application teams across your organization can publish and subscribe to events on the same bus without waiting for infrastructure provisioning.

Publishers send events without needing to know which teams consume them, and subscribers create their own Subscriptions independently. Platform teams maintain visibility into all event flows and fine-grained control over who can publish and consume events. The new enhanced custom event bus has a default quota of 10,000 Subscribers per bus, and you can request a higher quota. That reduces the fragmentation that occurs when subscriber limits force you to split across multiple buses.

Event ordering
Event-driven architectures work best when consumers are designed around asynchronous patterns, where the order of events does not matter. There are a few cases where order does matter. In a logistics application, driver location updates must arrive in sequence. Out-of-sequence events cause routing algorithms to make decisions based on stale data.

The enhanced custom event bus supports both patterns on the same bus. Publishers can include an EventGroupId when sending events. EventBridge delivers events that share the same EventGroupId in sequence to Subscribers that chose ordered delivery. Other subscribers on that bus can receive the same events without ordering. You can keep events for each driver in the correct order without building complex workarounds, while the rest of your consumers stay fully asynchronous.

To support ordered processing, the enhanced custom event bus includes synchronous invocation for targets like AWS Lambda. Synchronous mode confirms successful processing before acknowledging the event, eliminating the common pattern of placing Amazon Simple Queue Service (Amazon SQS) between an event bus and Lambda to ensure reliability.

Subscriptions
The enhanced custom event bus introduces the Subscriber resource, which combines event filtering, target configuration, retry policies, and dead-letter destinations into a single, manageable unit. Today, achieving the same outcome with EventBridge requires configuring separate rules, targets, and retry settings across multiple resources. Subscribers simplify this by giving each consumer one resource that defines what events they want, where to deliver them, and how to handle failures.

Subscribers also include variable start time options, making it easier for teams to onboard new consumers or replay events to recover from application errors or hydrate new applications.

Event evaluation
Publishers can turn on content-based deduplication so EventBridge detects and drops retries of the same event from the payload itself. You do not have to generate and track a deduplication ID when a timeout or a partial failure sends the same event twice. EventBridge hashes the meaningful parts of the event and collapses matches that arrive within five minutes, which gives those retries exactly-once delivery semantics instead of EventBridge’s usual at-least-once model. If you already stamp your own idempotency token, keep using it. Content-based deduplication is for sources that cannot reliably identify the same event on a retry.

Subscribers can use JSONata expressions to reshape an event before it reaches a target, extracting fields, renaming them, or computing new values when a downstream API expects a different shape. If you already produce Apache Avro or Protocol Buffers events, EventBridge can deserialize those payloads to JSON, allowing subscribers fine grained filtering and routing on the full event payload without having to consume, deserialize, and match or discard on their own.

New pricing model
The enhanced custom event bus uses a new ingress and egress throughput pricing model. Publishers pay for events ingested, and subscribers pay for events delivered. This replaces the per-event model where cross-account and bus-to-bus routing charges compound in multi-bus architectures. For pricing details, visit the EventBridge pricing page.

Existing EventBridge custom event buses continue to work as they do today with no changes required. They now appear as Custom event bus – classic. The enhanced custom event bus is a new resource that you adopt at your own pace. In the console, it appears as Custom event bus.

Now available
The enhanced custom event bus is available today in the US East (N. Virginia, Ohio), US West (Oregon), Europe (Ireland, Frankfurt, Stockholm, Spain), and Asia Pacific (Hong Kong, Malaysia, Mumbai, Singapore, Sydney, Thailand, Tokyo) Regions. You can create your first enhanced custom event bus through the AWS Management Console, AWS Command Line Interface (AWS CLI), or EventBridge APIs. To get started, visit the EventBridge documentation or try it out directly in the EventBridge console.

  •  

Google is a Leader in the 2026 Gartner Magic Quadrant for Container Management

We’re excited and proud to share that Gartner has recognized Google as a Leader for the fourth year in a row in the 2026 Gartner® Magic Quadrant™ for Container Management, based on its Completeness of Vision and Ability to Execute. Google was positioned highest in Ability to Execute of all vendors evaluated and we believe this validates the success of our mission to deliver a container platform that’s highly optimized for both performance and efficiency. We help global customers to build and run their most demanding and complex workloads at scale, including the next generation of AI and agentic applications. 

In the accompanying 2026 Gartner Critical Capabilities for Container Management report, Google Cloud was ranked first in every use case: New Cloud Native Applications, Containerized Existing Applications, AI Training, AI Inference, Edge Applications, and Hybrid Applications.

Gartner predicts1 that “By 2028, 95% of new AI deployments will use Kubernetes, up from less than 30% in 2025.” Containers power today’s most innovative apps and businesses — and deliver the infrastructure customers demand as they transform their businesses in the agentic era.

2026 Gartner Magic Quadrant for Container Management

Google Cloud spearheaded the industry-wide cloud-native revolution when we introduced Kubernetes in 2014 and launched Google Kubernetes Engine (GKE), the world’s first managed Kubernetes service, in 2015. Our commitment to container platforms and the vibrant, innovative Kubernetes ecosystem has only grown stronger and deeper since. Alongside GKE, our serverless container platforms GKE Autopilot and Cloud Run dramatically lower operational costs and help developers deliver amazing containerized apps faster than ever before. 

The massive acceleration in enterprise AI has inspired us to redefine infrastructure management for the AI era. In 2026 so far we’ve introduced a wide range of foundational improvements to shift GKE and Cloud Run into agent-native, high-performance platforms designed for autonomous AI systems, massive inference workloads, and secure runtime isolation. Whether you’re training AI at the frontier, launching an AI startup, or leading your enterprise AI transformation, we have the container platform you need. Important highlights include:

Delivering leading performance and efficiency for AI infrastructure

  • GKE predictive latency boost: Built into the GKE Inference Gateway, this ML-driven capability uses capacity-aware routing rather than static configurations to reduce Time-to-First-Token (TTFT) by up to 70%.

  • GKE automatic KV Cache storage tiering: Automatically shifts KV cache data across RAM, Local SSD, and Cloud Storage. This reduces memory bottlenecks, improving TTFT by 40% via RAM offloading and increasing throughput by 70% via Local SSDs for large prompt contexts. [1]

  • GKE accelerated container and model startups: GKE node spin-up times are up to 4x faster, and pod startup speeds have improved by up to 80%. Additionally, native run:AI Model Streamer integration pulls heavy models from Cloud Storage 5x faster.

  • Cloud Run on-demand serverless GPU scale-to-zero: Cloud Run supports NVIDIA RTX PRO 6000 Blackwell GPUs, allowing teams to serve 70B+ parameter models on-demand. Your services can go from zero to a fully provisioned GPU — with all drivers pre-installed — in under 5 seconds. Once active inference or fine-tuning runs complete, Cloud Run automatically scales instances back to zero, eliminating idle infrastructure costs.

Evolving Kubernetes for agentic infrastructure security and scale

  • GKE Agent Substrate: As an open-source, secure-by-default agent execution runtime, Agent Substrate is engineered to run millions of sandboxes with 10x higher density than standard container runtimes. Purpose-built for the era of autonomous agents, Substrate delivers sub-500ms resume operations at over 500 suspend/resume activations per second with a native zero-trust kernel and network isolation. Agent Substrate is available as an open-source solution that runs on any Kubernetes infrastructure and is optimized for GKE.

  • GKE Agent Sandbox: Built on gVisor kernel-isolation technology, Agent Sandbox isolates the host environment from untrusted, multi-agent AI code execution. It provides secure execution at scale, processing up to 300 sandboxes per second with sub-second latency and delivering up to 30% better price-performance when running on Axion processors than comparable hyperscaler cloud providers. 

  • GKE Dataplane V2 scalability limits: Architectural capacity bounds for GKE clusters implementing active NetworkPolicies doubled from 7,500 nodes to 15,000 nodes per cluster, supporting the massive infrastructure needs of large enterprise and AI customers.

  • GKE intent-based autoscaling: GKE can now natively autoscale horizontally using application intent and custom metrics beyond basic hardware metrics. This reduces resource allocation reaction times from 25 seconds down to just 5 seconds.

  • Filestore agent volumes: a new offering that attaches and detaches NFS mounts in milliseconds, allowing agents to start/resume near-instantaneously, along with native Read-Write-Many (RWX) access and POSIX-compliant file locking to enable safe multi-agent collaboration without write collisions. 

Next-gen developer experience with serverless containers

Whether you’re hosting a standard web API, running a heavy batch data job, processing an asynchronous message queue, or deploying a complex AI agent, Cloud Run handles it all under a single, unified serverless model that delivers an unmatched developer experience and maximum engineering velocity. 

  • One-click prototyping in Google AI Studio: You can build and deploy full-stack applications directly within Google AI Studio, making it an exceptional environment for rapid prototyping and experimentation. With a single click, you can instantly package and publish your vibe-coded applications to Cloud Run.

  • Cloud Run instances: This new primitive manages individual, addressable, long-running singleton resources with integrated Cloud Storage volume mounts, allowing persistent background agents like OpenClaw to be deployed cost-effectively. With baseline shared-CPU configurations starting at a highly predictable flat rate of ~$5.70 per month (for 1 vCPU and 1 GiB of RAM), Cloud Run instances delivers an always-on, VM-like experience while bypassing the idle-cost penalties and operational overhead of traditional VMs.

  • Cloud Run sandboxes: Hard-isolated environments spin up in under 500 milliseconds to safely execute untrusted, model-generated code, protecting the host system from unauthorized access.

Take the next steps

As we reach for new heights of performance, security, and scale for our container platforms, we continue to build the future in the open. We invite you to explore Agent Sandbox and Agent Substrate today. We can’t wait to shape the future of agent infrastructure together with our customers and partners. Check out these resources to continue your learning journey:


1. Gartner report: Critical Capabilities for Container Management, 8 September 2026

Gartner, Magic Quadrant for Container Management, Dennis Smith, et al, 2 September 2026
Gartner, Critical Capabilities for Container Management, By Tony Iams, Wataru Katsurashima, Lucas Albuquerque, Dennis Smith, Bhuvie Chhabra, 8 September 2026. 
Gartner and Magic Quadrant are trademarks of Gartner, Inc. and/or its affiliates.
Disclaimer: Gartner does not endorse any company, vendor, product or service depicted in its publications, and does not advise technology users to select only those vendors with the highest ratings or other designation. Gartner publications consist of the opinions of Gartner’s business and technology insights organization and should not be construed as statements of fact. Gartner disclaims all warranties, expressed or implied, with respect to this publication, including any warranties of merchantability or fitness for a particular purpose.

  •  

What’s new in cloud-native apps?

Developers and IT operations pros of all stripes come to Google Cloud to build modern, cloud-first and cloud-native applications. Here’s the latest from Google Cloud on everything app dev, containers, Kubernetes, DevOps, serverless and open source, all in one place.

Week of Apr 11 - Apr 15, 2022

Listen to a Prodcast
Google’s SRE team has launched a “Prodcast” focusing on concepts from its SRE book. Available from wherever you get your podcasts. 

Run Apache Spark on a modern container base
Dataproc, our managed version of Apache Spark, is now generally available on Google Kubernetes Engine (GKE), allowing you to create a Dataproc cluster and submit Spark jobs on a self-managed GKE cluster. Read all about it. 

Loads of new runtimes in App Engine and Cloud Functions
Java, Ruby, Python and PHP developers, rejoice! You can now update or develop new App Engine apps and Cloud Functions using Java 17, Ruby 3, Python 3.10 and PHP 8.1.

BeReal shows you how modern app development is done
Social media company BeReal discusses how it uses Google Cloud services including Firebase, Cloud Functions and GKE to build its app.  

Build fast without breaking things
In this three-part series, learn about the Supply-chain Levels for Software Artifacts (SLSA) framework designed to improve the integrity of your software packages and infrastructure. Start with, How to SLSA Part 1 - The Basics, then move on to part 2 and part 3.

Week of Apr 4 - Apr 8, 2022

How to migrate a container from a VM to Cloud Run
With Cloud Run, you can migrate a legacy VM to a container and save money – even if you don’t know Kubernetes. This video shows you how. 

Receive Error Reporting notifications through Slack and Webhooks
Error Reporting can analyze, aggregate, and notify DevOps teams about crashes that happened in their cloud services, right to their preferred channels. Learn more in this blog. 

Cloud-native architecture is in the cards at NCR
Earlier this year, NCR Authentic Cards talked about how it built a transaction processing platform on Google Cloud. NCR and its consulting partner Opus Systems are back for part two of the migration story, taking a detailed look at all the components that went into the cloud-based architecture. 

How to easily share a service with Cloud Run 
Have you ever written a script that you wanted to make available to others? Cloud Run makes it easy to deploy a processing service quickly and easily. In this blog post, Developer Advocate Laurent Picard creates an image processing service that generates coloring pages, then makes it available to others — all in under 200 lines of Python and JavaScript. Follow along in this tutorial.

Week of Mar 28 - Apr 1, 2022

Another cool thing you can do with Cloud Functions
Got data you want to ingest from Cloud Storage to BigQuery? Cloud Functions can help with that. This tutorial shows you how.  

Add custom severity levels to Cloud Monitoring alert policies
Not all alerts are created equal. In this blog post, learn how to add static and dynamic severity levels to a Cloud Monitoring alert policy, with enhanced notification channels including email, webhooks, Cloud Pub/Sub and PagerDuty. 

Learn how to use CPU allocation controls in Cloud Run
Last fall, we added “always-on CPU” capabilities to Cloud Run, making it a better fit for running background- and other asynchronous-processing tasks. In this post, Developer Advocate Wesley Chun uses a weather alerting app to demonstrate how to use the feature, and along the way, reduces the app’s average user response latency by over 80%.

Week of Mar 21 - Mar 25, 2022

Get Going with latest Go 1.18 release
With the release of version 1.18, the Go programming language now includes support for generic code using parameterized types, integrated fuzz testing, and a new Go workspace mode that makes it simple to work with multiple modules. Learn more here.

Week of Mar 14 - Mar 18, 2022

Create EventArc triggers with Terraform
In addition to the Google Cloud Console or gcloud, you can also use a Terraform resource to create an Eventarc trigger. Mete Atamel shows you how. 

Scaling to new markets with Cloud Run
French publisher Les Echos Le Parisien Annonces switched from dedicated on-prem infrastructure to Cloud Run to supplement its main news site with regional variations. Les Echos shares its website architecture here. 

The serverless way to celebrate Pi Day
In honor of Pi Day, Google Cloud Developer Advocate Emma Haruka Iwao shows you how to use the new Cloud Functions (2nd gen) to calculate π — serverlessly.

Week of Mar 07 - Mar 11, 2022

Rhode Island moves to Google Cloud-based job board
When the pandemic hit, the State of Rhode Island moved its workforce development operations entirely online on a foundation of Google Workspace and Google Cloud resources, including Firestore, Cloud Functions, and Kubernetes, among others. Check out how they did it. 

Containerized microservices at Lowe’s
Lowe’s already told us how they use SRE. They’re at it again, describing how they built an e-commerce website using a containerized microservices architecture and Kubernetes, with Istio for service mesh and Cloud Operations for good measure.

Cruise AVs hit the road with Google Cloud services
Autonomous Vehicle (AV) startup Cruise detailed how it’s using data analytics and machine learning on a foundation of Google Kubernetes Engine (GKE) and other services to develop and test its self-driving cars. Read the guest post. 

L’Oréal’s data analytics gets a makeover with serverless
We’re hurtling toward a programmable cloud — a world where developers use cloud-native serverless tools like Cloud Functions to quickly prototype and build powerful, data-driven business insights. L’Oréal is a great example.  

Better telemetry for your Anthos clusters
Anthos Service Mesh Dashboard is now available (public preview) on the Anthos clusters on Bare Metal and Anthos clusters on VMware. Now, you can get out-of-the-box telemetry dashboards to see a services-first view of your application on the Cloud Console.

Instrument your Java apps
With the new version of the Google Cloud Logging Java library, you can wire your application logs with more information — without adding a single line of code.

Visualize metrics from Cloud Spanner
Building an app on top of Cloud Spanner but can’t assess how well it’s operating? The new OpenTelemetery receiver for Cloud Spanner provides an easy way for you to process and visualize metrics from Cloud Spanner System tables, and export these to the APM tool of your choice. Read more here.

Week of Feb 28 - Mar 4, 2022

Introducing Cloud SDK
The rebranded Cloud SDK is a collection of all the libraries and tools (including Google Cloud CLI) you need to interact with Google Cloud products and services. Learn more here. 

Cloud CLI, meet Terraform
Google Cloud CLI’s new Declarative Export for Terraform allows you to export the current state of your Google Cloud infrastructure into a descriptive file compatible with Terraform (HCL) or Google’s KRM declarative tooling, and is now available in preview. 

Knative graduates to incubating project 
Congratulations to Knative, which has been accepted by the Cloud Native Computing Foundation, or CNCF, as an incubating project, enabling the next phase of serverless architecture. 

We manage Prometheus so you don’t have to
Google Cloud Managed Service for Prometheus is now generally available! Get all the benefits of open source-compatible monitoring with the ease of use of Google-scale managed services. Learn more here.

  •  

How AWS Lambda logs every flow across thousands of microVMs per host with eBPF and Rust

Abstract dark geometric corridor with glowing purple and blue neon lines, representing high-density network flow architecture in AWS Lambda.

On any compute platform, when a security alert fires, the question is always the same. Which workload talked to that endpoint, when, and how much? So, you dig through logs and hope they hold up. The hard part is knowing what to look for and where to find it. On a single server, thousands of microVMs run for a few hundred milliseconds, then shut down. 

Each one belongs to a different customer running a different function. Within milliseconds, the workload is done, and the logs captured during those few milliseconds are the only witness left.

“Within milliseconds, the workload is done, and the logs captured during those few milliseconds are the only witness left.”

That was our situation at AWS Lambda. We needed a complete network ledger for every tenant workload, no matter how short its life or how much traffic it generates. This is the story of how we replaced an aging capture system with a purpose-built pipeline written in eBPF and Rust: why the old architecture ran out of road, and the decisions that let the new one hold up at Lambda’s scale.

The job: a record you’re not allowed to touch

Every Lambda worker is a bare-metal EC2 instance packed with microVMs, each an isolated Firecracker guest. They all talk over the network to S3, other AWS services, the public internet, and back into a customer’s VPC. Something has to keep an honest, complete account of it all.

That is where a network flow log comes in. A network flow log helps with investigation, incident response, audit, and reconstructing what happened with a workload. Imagine it as the system of record for what happened to a network packet flowing across the system. The same records also feed into network usage and metering services that demand accuracy above all else. Lastly, all records must be persisted for audit and compliance purposes.

Two properties matter more than the rest. The record must be complete and correctly attributed, and capturing it must add almost no overhead to both the network flow and the platform.

Correct attribution means every packet/flow is associated with the microVM where it landed and the tenant that produced it. Completeness means no missed packets. A missing or misattributed record can cause billing, observability, and monitoring problems at scale. Imagine this happening for every microVM when Lambda serves millions of requests per second. Overhead matters for a reason that isn’t readily visible to customers but plays a major role in how you run a service at Lambda’s scale. Every extra megabyte of RAM and every microsecond of CPU consumed adds up at Lambda’s density, lowering utilization, operating margin, and the ability to serve requests under load.

Why the old way ran out of road

While building the new multi-tenant, Firecracker microVM-powered Lambda, we started with a system borrowed from the older, less-dense single-tenant EC2-era design. It had two parts: a kernel-side extension that counted packets and matched them to tenants and sandboxes per flow, and a userspace daemon that read those counters, batched them into records, serialized them, and frequently uploaded the files. This solution worked well for a small number of VMs. However, the solution broke at Lambda’s density for two mutually exclusive reasons.

First, rule explosion. iptables walks its rules more or less linearly for every packet, and each new microVM piled more rules onto the chain. One worker running a couple of thousand microVMs needed well over a hundred thousand iptables rules just to keep the record. Every packet paid a tax proportional to how crowded the host was and what slot it received. So a packet’s bookkeeping slowed as the host got busier, which is exactly the wrong direction, since the whole plan was to pack more microVMs onto a host, not fewer.

“A record that can’t see half the address space isn’t one you can trust, and the moment dual-stack IPv6 support was proposed for Lambda, the old approach was finished.”

The second reason was harder: the borrowed kernel module did not speak IPv6. A record that can’t see half the address space isn’t one you can trust, and the moment dual-stack IPv6 support was proposed for Lambda, the old approach was finished, no matter the performance improvements.

Design considerations

As we embarked on the rewrite, we had a few non-negotiable design considerations: correct attribution, meaningful overhead reduction, and support for IPv6 as a first-class citizen. Dozens of internal systems already knew how to read the Amazon Ion records the old daemon produced. If we could emit byte-for-byte identical records, we could rip out the whole capture engine and no consumer, flow-log, or metering would notice the swap.

To solve for correct attribution, we implemented isolation at the microVM level. Each microVM already had its own network: a namespace with its own virtual devices. That network is the unit everything else organizes around.

The shape of the new system

The replacement is three cooperating pieces. We’ll give each a plain name based on their role.

 ONE WORKER HOST

   control plane
       |
       |  gRPC over a Unix domain socket
       v
   orchestrator ....... one privileged process per host
       |                (loads eBPF, configures TC,
       |                 spawns one tagger per network)
       v
   --- per network (one microVM) ------------------------------

   eBPF capture  -->  ring buffer  -->  tagger  -->  Ion records
   TC hooks on        one per           Rust,
   the network's      network           userspace
   devices

   ------------------------------------------------------------
       |
       v
   same billing + flow-log pipeline as before

At the bottom sits the kernel capture layer. It’s a set of small eBPF programs attached to the traffic-control(tc) hook on each network’s relevant virtual Linux devices. They intercept packets and emit one compact event per packet into a ring buffer. They just watch. Nothing in these programs can copy, block, drop, or rewrite a packet; there’s literally no code path for it.

In the middle is the tagger: an unprivileged userspace process written in Rust, one per network. It drains its own dedicated ring buffer, rolls the raw per-packet events up into per-flow records, and writes them to disk in the legacy Amazon Ion format. On top is the orchestrator, one privileged process per host. It owns everything that needs elevated permissions: loading the eBPF programs, wiring up traffic control, spawning and supervising the fleet of taggers. It exposes a small lifecycle API over a Unix domain socket so the control plane can create, assign, recycle, and tear down tagging as microVMs come and go.

The decoupled design lets capture happen in the kernel, aggregation in userspace, and one process per host orchestrates it all. The captured records go to the existing downstream consumers unchanged.

Capturing in the kernel, without getting in the way

The capture programs attach to the clsact qdisc in traffic control(tc), on both the ingress and egress side of each of a network’s devices. A network spans two devices, so that’s four attach points per network. Traffic control is a good place to stand. It sees every packet early, before anything downstream has touched it. Every eBPF program reads the packet and returns the “keep going” action. We never drop or modify a customer’s packet, and nothing we do adds meaningful latency.

For each packet, the program walks the headers- Ethernet, then IPv4 or IPv6, then TCP, UDP, or ICMP and writes one fixed-size event into that network’s BPF ring buffer. The event is small on purpose, about two dozen bytes for IPv4. A simplified version looks like this:

/* one event per packet, ~24 bytes for IPv4 */
 struct flow_event {
     u8  ip_version;       /* 4 or 6 */
     u8  protocol;         /* TCP / UDP / ICMP */
     u8  direction;        /* ingress or egress */
     u8  device_id;        /* which of the network's devices */
     u16 local_port;       /* "local" is always the sandbox side */
     u16 remote_port;
     u32 flags_and_bytes;  /* TCP flags in bits [31:24], byte count in [23:0] */
     u32 local_addr;       /* 16 bytes for IPv6 */
     u32 remote_addr;
     u32 received_time_ms;
 };

One packet, one event, one byte count. We don’t count packets in the kernel. The flags and the byte count share a single 32-bit word: eight bits of TCP flags on top, a 24-bit byte count underneath. Doing less work per packet in the kernel is the entire point, so aggregation is somebody else’s job.

The local and remote fields get normalized by direction before the event ever leaves the kernel. Arriving or departing, local always means the sandbox side and remote means the outside world. That one small normalization means userspace never has to reason about direction when it groups flows, and the record reads the same way regardless of which way the packet was headed.

“Doing less work per packet in the kernel is the entire point, so aggregation is somebody else’s job.”

Let’s look at how eBPF plays a key role in simplifying the architecture. The eBPF program here works in a reserve-then-commit order. Each eBPF program maintains a dedicated ring buffer to record packet metadata. You ask the ring buffer for space, add the event in place, and submit. This avoids copying data through a syscall, consumes minimal CPU, and needs no per-CPU bookkeeping. Just a single consumer that drains it in order.

However, all this complex logic for parsing and event submission past the eBPF verifier took work. The eBPF verifier has a critical job: proving a program is safe before the kernel can load it, and that requires strict memory bounds checks and instruction limits. We had to make sure it could verify and load programs quickly, so we did the following: First, we made the header parser a shared subroutine, so the verifier proves it once instead of re-proving it inline at every attach point in the eBPF program. Then, we bounded the IPv6 extension-header walk to a fixed number of hops so the verifier can ensure it terminates. We also had to make sure packet fragments past the first IPv4 fragment report zero ports and flags rather than vending garbage into the ring-buffer events. We also had to make sure any coalesced super-packets from segmentation and receive offload (GSO/GRO) have their byte counts handled correctly. A garbage port or an over-counted byte would create a false log entry, so we keep the record honest at the source and byte-identical with the old system.

However, we don’t trust the verifier as the sole source of correctness, because this code produces a record critical to billing, compliance, and auditing systems; each eBPF program is written in C and runs through a formal model checker (CBMC) during every build. Its harnesses assert, among other things, that the event struct’s byte layout stays compatible with what every attached program expects. A struct that silently shifts by a byte is the kind of bug that quietly corrupts every record it touches, and nobody notices until the day they need the log.

Sizing the ring buffer from first principles

The ring buffer is the one thing the kernel producer and the userspace consumer share, and its size is a real tradeoff. Too small and you drop events under a burst, which means missing records, which is a hole in the log right when traffic matters. Too large and you waste memory, and you pay for that waste on every ring buffer on the host.

So we didn’t guess. We derived the floor from each microVM’s packet rate; for example, if the ceiling is 100,000 packets per second per direction. We drain the ring roughly every 100 milliseconds. Multiply the peak rate by the drain interval, by the event size, and by two directions:

ring bytes =~ 62,500 pps x 0.1 s x ~24 bytes x 2 directions
            =~ 300 KB

The ring buffer API requires a power of two, so the design defaults to 512 KiB. That’s the smallest buffer that can’t overflow between drains at the guest’s own maximum packet rate. Put another way, the floor ensures a guest can’t outrun the recorder, even when it’s trying to. The size is configurable per network. In the running deployment, we currently provision it more generously than that floor, on the order of a couple of megabytes, while we finish tuning the right per-workload value. The number to defend is the floor, and the floor comes from a hard system limit, not a guess.

The drain cadence has another nice property: waking a userspace process isn’t free, and a fleet of thousands of processes all waking constantly would thrash the CPU. So the kernel decides when to bother. It checks how full the ring is and only forces a wakeup once the ring crosses about one percent full. Below that, it stays quiet and lets events pile up. Userspace, on its end, won’t come back to read more than once every 100 milliseconds. A quiet flow just sits there until the next drain, basically free. A busy one trips that one-percent threshold and gets read almost right away. Nothing’s on a fixed timer, so neither case gets the timing wrong.

Draining and aggregating in Rust

The tagger turns raw per-packet events into the per-flow records the pipeline stores. One tagger per network, running unprivileged.

We picked Rust for boring, practical reasons. At this density, thousands of these processes run on a host, each holding a small amount of state that has to be correct. A garbage-collected runtime would give us pause times and memory that balloon under load, and a pause in the wrong place could create a gap in the record. Rust gives us predictable memory and no collector, plus a compiler that flat-out refuses to build whole categories of bugs that turn into misattribution. Each tagger runs in a few hundred kilobytes of RAM against a budget of about a megabyte. That’s what makes thousands of them per host affordable.

Inside, it’s a small set of cooperating tasks on a single-threaded async runtime. One task reads the ring, another owns the flow state, and a third writes parcels. The only work we fence off onto a blocking pool is the couple of operations that genuinely block: receiving the ring descriptor and serializing Ion, since the Ion writer isn’t async. It reads the ring through epoll, so it sleeps when there’s nothing to do and wakes when there is.

As events arrive, the tagger drops them into a flow map keyed by device, the five-tuple, and a tenant attribution handle. That handle comes from the metadata the control plane handed over when the flow was activated. Matching events accumulate bytes, packet counts, and OR’d TCP flags. Grouping happens as the events are read, so the hot path stays a lookup and an add.

Where does attribution actually come from? That’s because mapping is the most important property for the record. The kernel event carries no identity, and it doesn’t need to. Every network has its own dedicated ring and devices, so packets are separated long before the tagger sees them. The tagger isn’t pulling one tenant’s packets out of some shared firehose. The stream it reads was only ever that one tenant’s, because the ring and the devices feeding it belong to that tenant alone.

Once a minute, on a fixed interval lined up to the top of the second to match the old system it replaced, the tagger serializes the completed flows into Amazon Ion records in exactly the schema the old daemon produced. Each file gets written to a temporary name, flushed to disk, and renamed into place. A reader sees a complete record or nothing, never a torn one. A separate flush loop, with a little random jitter at startup so thousands of processes don’t all write at the same instant, drains completed flows even after a microVM has gone quiet. A workload that goes silent still leaves a finished record behind it.

Because the records are byte-compatible with the old format, the entire downstream world kept working untouched. And when we ran the two systems side by side, we could compare their output record for record and confirm they agreed. That’s about as direct a completeness check as you can get.

Least privilege, enforced by a file descriptor

This is the part of the design I’m most fond of, because it uses an old Unix trick to get a strong security property for almost nothing.

The processes that do the actual packet work, the thousands of taggers, hold no elevated privileges. They can’t load eBPF or touch traffic control. They can’t even open the ring buffer map on their own. All of that power lives in one place: the per-host orchestrator, and even it runs with just the two capabilities it needs rather than as root.

“Passing a file descriptor over a socket is a decades-old Unix feature, and it lets us keep thousands of processes powerless while concentrating privilege in one small place.”

So how does an unprivileged tagger read a ring buffer it isn’t allowed to open? The orchestrator opens it and hands the open file descriptor to the tagger over a Unix domain socket, using the kernel’s SCM_RIGHTS mechanism to pass descriptors between processes. The tagger gets a ready-to-use handle to the ring and nothing else. It never had, and never needs, permission to create one. The privileged surface of the whole system is one small process per host. The thousands of processes touching customer traffic are about as powerless as we can make them.

A lifecycle API, and why it has two doors

MicroVMs come and go constantly, so the control plane needs a way to tell the orchestrator when to start and stop recording a network. It does that through gRPC APIs over a Unix domain socket, with a handful of methods: create a set of flows, activate a flow, recycle one, tear one down, plus a health check.

Starting to record is split into two calls, a heavy one and a light one, and the split is deliberate. Create is a heavy call, the expensive path: it loads and attaches the eBPF programs, configures traffic control, and spawns the tagger. Attaching to network devices takes a kernel lock that every such operation on the host contends for, so when a host is standing up many networks at once, we batch these to keep everyone from serializing behind that one lock. Activate is the lighter call. By the time it runs, the machinery already exists, so it just hands over the customer metadata and flips the flow into steady-state recording. Its latency budget is tight: under 2 milliseconds at p90, under 10 milliseconds at p99.9, matching the baseline of the system it replaced.

An honest tradeoff: kill it, or reuse it

Not every decision came out clean. These are lessons for anyone building something similar.

The original design had a strict rule for recycling a network: always destroy the tagger and spawn a fresh one. From a correctness standpoint, the reasoning was airtight. A brand-new process can’t carry stale metadata from a previous tenant, so a flow from one tenant landing in another’s record across a recycle becomes structurally impossible. Kill it, don’t try to clean it. We were sure that was the right call.

Reality under Production workloads showed us that forking and exec’ing a new process thousands of times as networks churned turned into a real source of CPU spikes at scale. The safest choice showed up as a flame graph. So the shipped system needed a new knob. A workload that reuses its networks can reuse the tagger after a recycle, trading off a little of that structural guarantee for a lot less CPU churn. A workload that wants the strict, cross-tenant-proof behavior leaves the knob off. I still think the strict version is the more correct design, but the fleet’s CPU budget just didn’t allow it.

What it bought us

Start with the number that killed the old design. One host needed more than a hundred thousand firewall rules to keep the record for two thousand microVMs, and each additional microVM piled on more, taxing every packet a little further. The eBPF version swaps that linear rule walk for constant-time map lookups whose cost doesn’t climb as the host fills up. The linear tax is gone. That puts the density target, roughly double the microVMs per host, within reach, and without the burst-time gap a per-packet tax invites.

The rest of the payoff falls out of the constraints we started with:

  1. IPv6 flows, invisible to the old tool, get recorded like anything else, so the log covers the whole address space instead of half.
  2. Each tagger lives in a few hundred kilobytes of RAM against a roughly one-megabyte budget, small enough that thousands per host is practical.
  3. Activating a flow into steady-state recording stays under 2 milliseconds at p90 and under 10 milliseconds at p99.9.
  4. The capture layer is observe-only and formally checked, and the processes touching customer traffic hold no privileges. We added significant visibility while shrinking the trusted, privileged surface that could corrupt the record. 
  5. The output records are byte-for-byte identical to the old format, so every downstream flow-log and metering consumer kept working with no change

Lessons worth carrying to other systems

A few of these travel well beyond Lambda. Kubernetes pods, edge runtimes, the sandboxes people are spinning up now to run AI agents. Anywhere you’ve got many tenants sharing a host and need a trustworthy record of their traffic, the same shapes hold.

First: observe from outside the hot path. The moment your recording logic sits inline in packet forwarding, its cost becomes a tax on every packet, and that tax is heaviest right when the record matters most. That same pressure pushes teams to drop or sample data, and an audit trail can’t survive sampling. eBPF lets you watch from the side and emit a compact event, while everything expensive happens elsewhere.

Second: size buffers from something real. A buffer sized by an actual rate limit times an actual drain interval is a number you can defend in a review, and it’s what lets you promise no dropped events under a burst. We could’ve picked 512 KB because it felt about right, and it probably would’ve held most of the time, right up until some burst it wasn’t sized for.

Third: keeping tenants apart at the point of capture is the part I’d argue hardest for. Give each tenant its own ring and its own devices, and the streams never touch, so you’re labeling clean traffic instead of guessing after the fact.

Fourth: old primitives are underrated. Passing a file descriptor over a socket is a decades-old Unix feature, and it lets us keep thousands of processes powerless while concentrating privilege in one small place.

Last one, and it’s the cheapest to get wrong: when you swap out an engine, keep the bolt pattern. Byte-for-byte identical output let us replace the entire capture path with zero downstream migration, and it handed us a record-for-record way to prove the new system saw everything the old one did.

The post How AWS Lambda logs every flow across thousands of microVMs per host with eBPF and Rust appeared first on The New Stack.

  •  

Deploy personal AI agents with Cloud Run instances

Need a low-cost, high-performance way to run long-lived, stateful workloads such as AI agents? Today, we introduced Cloud Run instances, which let you do just that.  

Consider AI agents such as OpenClaw or Hermes, which are intended for individual developers or personal use. Because these agents often work continuously and tend to serve only one user at a time, their infrastructure requirements look quite different from stateless, high-throughput web services that typically run on Cloud Run services.

Cloud Run services scale to zero when requests stop, so they aren’t ideal for a long-lived agent that expects exactly one copy to be running continuously. On the other hand, the alternative — running a dedicated VM — means paying for full compute 24/7, managing operating system updates, opening firewall ports, and provisioning your own HTTPS endpoints.

Cloud Run instances provide dedicated, singleton compute runtimes on Cloud Run. They have the following attributes:

  • Runs just one instance with no autoscaling

  • Up to 7-day continuous runtime, with automatic restart policy configured by default

  • Every instance gets a HTTPS URL that remains unchanged across updates and restarts.

  • You can stop each instance when you aren't using it and resume it whenever you need it

The cost to run a Cloud Run instance with 1 vCPU and 1 GiB of memory continuously for 30 days is $5.70. Cloud Run instances use shared vCPU with vCPU burst budgets to run continuously for a low, predictable price. This model is also ideal for long-lived agents that aren’t doing compute-intensive work all the time, and only spike in usage when asked to perform a task.

Example: Deploy OpenClaw on a Cloud Run instance

OpenClaw is an open-source personal AI agent that can perform various tasks on your behalf, and become a better assistant over time. Many OpenClaw users start out running it on their own laptops, until they realize they need somewhere to run it where it won’t shut down every time their laptop goes to sleep.

Deploying OpenClaw to a Cloud Run instance is easy. Once you’ve uploaded OpenClaw’s configuration files to a Cloud Storage bucket, you can deploy your OpenClaw agent to a Cloud Run instance with just one command:

code_block
<ListValue: [StructValue([('code', 'gcloud beta run instances create openclaw-instance \\\r\n --image ghcr.io/openclaw/openclaw:latest \\\r\n --port 18789 \\\r\n --public \\\r\n --add-volume mount-path=/home/node/.openclaw,type=cloud-storage,mount-options="uid=1000;gid=1000;file-mode=0700;dir-mode=0700",bucket=${BUCKET} \\\r\n --set-env-vars "OPENCLAW_GATEWAY_PASSWORD=${PASSWORD},GEMINI_API_KEY=${GEMINI_API_KEY}"'), ('language', ''), ('caption', <wagtail.rich_text.RichText object at 0x7febd4c1b4f0>)])]>

Once deployed, you can keep this OpenClaw instance running for as long as you want. You can interact with it over Telegram, WhatsApp, or the social media platform of your choice, and connect it to any tools you want it to use, as well.

For the full instructions on how to deploy OpenClaw, refer to this codelab.

Coming soon, we’re also launching SSH access for both Cloud Run instances and Cloud Run services. Sign up for private access here.

What users are saying

Cloud Run instances are helping Google Cloud users achieve their goals for running AI agents and other long-lived workloads at low cost and high performance.

OffDeal, an AI-powered investment bank for small businesses, is running long-lived agents on Cloud Run instances:

“We're currently using Cloud Run instances as our primary infrastructure for our long-running agent. It reduced cold starts by 88%. Everything was very straightforward to implement, and it has been very reliable.” - Luis Ruiz Morel, Member of Technical Staff @ OffDeal

Learn more

Currently in preview, Cloud Run instances are a cost-effective way to run a new kind of workload, without sacrificing performance. For more information about Cloud Run instances, check out the following resources:

  •  

Google is a Leader in the 2026 Gartner® Magic Quadrant™ for Cloud-Native Application Platforms

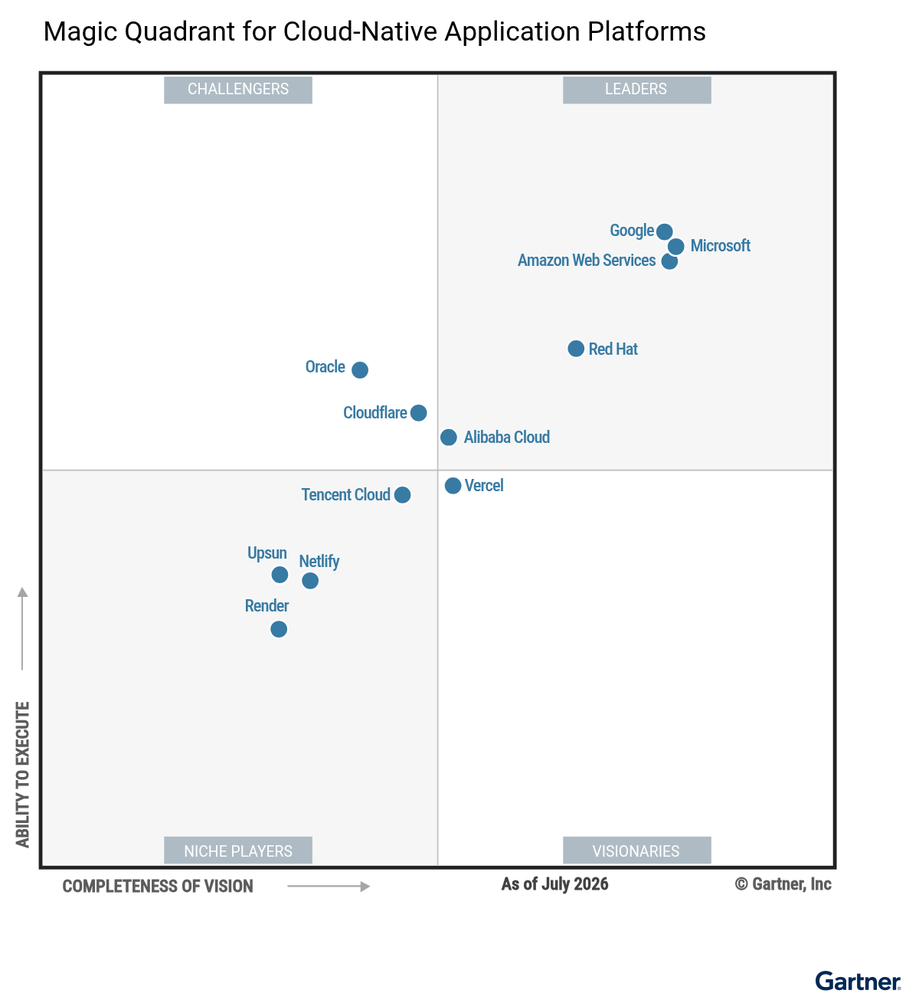
We are thrilled to announce that Google has been recognized as a Leader for the third year in a row in the 2026 Gartner® Magic Quadrant™ for Cloud-Native Application Platforms (CNAP). We believe this placement in the Leaders quadrant validates our commitment to providing an accessible, developer-centric platform that accelerates onboarding and supports rapid prototyping across modern workloads.

Figure_1_Magic_Quadrant_for_CloudNative_Application_Platforms

Our vision for an application-centric cloud focuses on enabling developers to prioritize writing code and building agents or traditional apps by removing infrastructure complexity. Google Cloud provides a unified execution environment supporting serverless, containerized, and agentic deployment options. We believe our placement highlights Google's unique readiness to power both standard enterprise microservices and the next generation of autonomous AI applications.  

Some key features and capabilities of our platform are highlighted below. 

From idea to implementation

Generative AI has ushered in a wave of vibe coding, allowing anyone to go from an idea to a deployed application in a fraction of the time it used to take. To make this even smoother, Google Cloud integrates its serverless infrastructure with AI vibe-coding and prototyping tools. We also simplify access to Google Cloud resources with tools like managed MCP servers and agentic skills — packaged sets of instructions, scripts, and resources to teach an AI how to complete specialized, multi-step workflow. 

  • One-click prototyping in Google AI Studio: Developers can build and deploy full-stack applications directly within Google AI Studio, making it a great environment for prototyping and experimentation. With a single click, you can instantly package and publish your vibe-coded applications to Cloud Run. 

  • Google-managed MCP servers: To enable AI agents to interact with cloud resources, we support official, fully managed remote MCP servers. An example is the Cloud Run MCP server (via run.googleapis.com/mcp), which allows developers to easily launch endpoints and deploy server-side logic. The MCP tools are deployed with a simple config, skipping cloud builds to launch code in seconds, saving valuable developer time. These fully managed servers are integrated with IAM and VPC Service Controls, and they leverage Model Armor for content security.

  • Google's official Skills Repository: Level up your agents with additional, condensed expertise on various Google Cloud technologies. Published and available in Agent Registry, the repository includes skills for Cloud Run, the Well-Architected Pillar (security, reliability, and cost optimization), and more.

Ready to try vibe coding yourself? Get hands on with this codelab to build a vibe-coded app and deploy it to Cloud Run.

From implementation to enterprise-ready

Translating prototypes into production-grade, secure, and cost-effective enterprise software is where Google Cloud excels, with a full suite of developer, architect, and platform engineering tools. From designing your application to optimizing day 2 operations, we offer the services and tools to help you build, operate, and deploy applications across their entire lifecycle, and you have the freedom to build with any language, any library, and any framework.

Build

  • Build with Google Antigravity: At Google, we’re simplifying and expanding our development ecosystem behind the Antigravity harness, collapsing developer silos into a unified orchestration layer. By integrating multi-step AI reasoning directly into the developer workflow, Antigravity natively brings local codebase development to our cloud-native application platforms (e.g., Cloud Run).

  • Design and deploy with Application Design Center (ADC): Now, you can bridge the gap between developer velocity and enterprise control, using Application Design Center to eliminate manual Terraform and YAML configuration. This platform engineering component helps teams design, standardize, and deploy template-driven applications on Google Cloud. It is also integrated as part of Gemini Cloud Assist design agent and published as an MCP server. With ADC, you can visually design your architecture using Cloud Run services, databases, and event brokers backed by automated Gemini Cloud Assist security templates. Beyond human-guided design, ADC enables programmatic orchestration at the time of no HITL (Human-in-the-Loop), allowing automated pipelines to provision policy-governed Terraform configurations directly and autonomously.

Operate 

  • Intelligent investigations: Integrating Gemini Cloud Assist with native telemetry creates an AI-driven framework for Day-2 incidents. When alerts fire, operators engage Gemini Cloud Assist to instantly synthesize logs and metrics, pinpoint root causes, and generate remediations — context that can be handed off to accelerate support escalations. Crucially, IAM permissions strictly govern all AI recommendations, and help to ensure explicit human-in-the-loop approval are required before any infrastructure changes occur.

  • Cost analysis and optimizations: Machine learning algorithms learn natural seasonal traffic cycles to detect cost anomalies within minutes, triggering notifications to protect your bottom line without risking destructive infrastructure shutdown.  

Deploy

  • Reliability and high availability: Cloud Run is a regional service by default, but you can deploy an app to multiple regions via a single gcloud command. Integrated with service health, Cloud Run automates cross-region failover and failback. If a service in one region becomes unhealthy, traffic is automatically routed to the next-closest healthy region, failing back once the issue is resolved.

  • An open platform: As a long-time and top contributor to the Cloud Native Computing Foundation (CNCF), we operate with an open-source-first strategy. By integrating foundational, community-driven technologies, we help enable application portability for enterprise customers who are increasingly demanding multi-cloud flexibility

Ready to start deploying your apps to Google Cloud? Get hands on with these codelabs:  

From enterprise-ready to autonomous

AI agents are software’s next frontier. They offer more than just increased productivity and efficiency; they can unlock exponential growth. To provide enterprises with robust agentic deployment options, Google Cloud provides a dedicated infrastructure stack tailored specifically to host, govern, and secure autonomous agent fleets. This stack seamlessly integrates with our Agent Development Kit (ADK) as well as other leading agentic frameworks to give developers maximum flexibility.

Gemini Enterprise Agent Runtime
At the core of this stack is Gemini Enterprise Agent Platform and its dedicated Agent Runtime, which delivers the serverless and containerized deployment options you need for enterprise-scale agent development, including the following capabilities:

  • Native personalization: Built-in sessions and memory banks manage context and long-term state, preventing costs from ballooning.

  • Agent observability and tracing: Built on OpenTelemetry (OTel) standards and agentic schemas, turnkey dashboards feature agent topology graphs and interactive trace logs that detail sessions, tool calls, and reasoning paths.

  • Agent evaluation and simulation: Automated simulation tools allow developers to test agents against golden sets with side-by-side comparisons and simulate thousands of interactions to test edge cases.

Hosting agents on Cloud Run
For customers requiring additional flexibility, granular control, or specific regulatory compliance, Cloud Run serves as an excellent serverless alternative to host your agents. Some of its latest features include:

  • Cloud Run instances (coming soon): This primitive manages individual, addressable, long-running singleton resources with integrated Cloud Storage volume mounts, allowing persistent background agents to be deployed cost-effectively.

  • Cloud Run sandboxes: Hard-isolated environments spin up in under 500 milliseconds to safely execute untrusted, model-generated code, protecting the host system from unauthorized access.

Agent security, governance, and auditability
To securely deploy AI agents and prevent unmanaged shadow AI, enterprises need an ironclad governance framework. Google Cloud delivers this through Agent Identity (non-human IAM with cryptographic IDs) to provide an auditable trail of all actions and reasoning; a centralized Agent Registry to manage approved agents, skills, tools and application artifacts,  and prevent unauthorized tool integrations; and an Agent Gateway to proxy traffic, enforce Model Armor policies, and actively block destructive actions. These features are available on Agent Runtime today and will be available soon on Cloud Run and Google Kubernetes Engine (GKE).

Ready to start deploying agents? Check out various codelabs featuring Gemini Enterprise Agent Platform here.

Build the future of cloud-native applications

Whether you’re a vibe coder deploying your first full-stack application, a software architect standardizing production microservices, or an enterprise team scaling a fleet of secure AI agents, Google Cloud delivers the simplicity, elasticity, and security you need. Read the full report: Download your complimentary copy of the 2026 Gartner® Magic Quadrant™ for Cloud-Native Application Platforms (CNAP).


Magic Quadrant for Cloud-Native Application Platforms, By Mukul Saha, Alex Coqueiro, Prasanna Lakshmi Narasimha, Richard Watson, 3 August 2026

Gartner and Magic Quadrant are trademarks of Gartner, Inc. and/or its affiliates. This graphic was published by Gartner, Inc. as part of a larger research document and should be evaluated in the context of the entire document. The Gartner document is available upon request from Google. 

Gartner does not endorse any company, vendor, product or service depicted in its publications, and does not advise technology users to select only those vendors with the highest ratings or other designation. Gartner publications consist of the opinions of Gartner’s business and technology insights organization and should not be construed as statements of fact. Gartner disclaims all warranties, expressed or implied, with respect to this publication, including any warranties of merchantability or fitness for a particular purpose.

  •  

Making highly available, multi-region Cloud Run services just got easier

Application downtime for mission-critical services can directly impact your reputation and bottom line. To avoid that, you need to be able to deploy regionally resilient workloads that detect and automatically recover from failures. But setting up multi-region, highly available deployments often involves complex configurations, and responding to incidents or outages is usually a manual process. 

Multi-region services on Cloud Run provide a one-command approach to deploying the same service configuration across multiple regions. When deployed with a global external application load balancer, you can serve traffic from different regions.

Now, we’ve made it easier to detect regional service disruptions and automatically fail over to a healthy region within seconds with new capabilities:

  1. Readiness probes provide instance-level health checks for your Cloud Run service to determine exactly when your containers are ready to serve traffic. You can also use these probes to monitor how many healthy or unhealthy instances exist for your service in each region.

  2. Service health aggregates instance-level health checks from readiness probes to calculate the health of your service in each region. This aggregate health is exposed via serverless network endpoint groups (NEGs) in each region. When your service is connected to a global application load balancer, traffic automatically fails away from regions with unhealthy services. Service health can be used with both single and multi-region services.

Let’s take a closer look at some scenarios where these new capabilities can come in handy.

Use cases

To make your Cloud Run applications highly available, it is essential to minimize the downtime for each incident. In high availability scenarios, readiness probes can help you detect regional service failures and automatically fail over, minimizing service degradation or disruptions. 

To achieve automated failover, one key thing to consider is whether you plan to support application traffic from the public internet or from within your private network (VPC).

  • Public internet applications: When you have a public-facing website or API, configure Cloud Run with a global external application load balancer for automatic detection and failover capabilities. 

  • Private network applications: When you have private applications with internal traffic, configure Cloud Run with a cross-regional internal application load balancer for automatic detection and failover capabilities. 

Design Considerations

Cloud Run’s new service health excels at quickly detecting and recovering outages in active-active configurations, where two or more regions are actively configured to serve traffic. Some things to consider when designing your multi-region setup:

  • Single points of failure: As you design your application, ensure that each layer of your application, including your database layer, has regional redundancies to avoid any single points of failure. For three-tiered applications on Cloud Run, consider setting up your web tier and application tier with distinct multi-region architectures to handle public internet and private networking respectively.

  • Data replication: When replicating data across regions and evaluating your recovery point objective (RPO), consider whether you require zero data loss. Cloud Run service health works best with read- and write-heavy applications that actively synchronize data across regions. 

  • Data residency: Google Cloud offers several multi-region database configurations with managed multi-region solutions including Firestore, Spanner, Cloud Storage, and Cloud SQL. These all work great for multi-region architectures on Cloud Run that have strict data sovereignty requirements.

Get started

Cloud Run’s enhanced multi-region high availability services are currently available in all Cloud Run regions at no additional cost. You only pay for the standard CPU and memory required to run the readiness probes. To learn more, check out our documentation.

  •  

Run isolated sandboxes with full lifecycle control: AWS Lambda introduces MicroVMs

Today, we are announcing AWS Lambda MicroVMs, a new serverless compute primitive within AWS Lambda that lets you run code generated by users or AI in isolated, stateful execution environments. You get virtual machine level isolation, near-instant launch and resume, and direct control over environment lifecycle and state, all without managing infrastructure or building expertise in complex virtualization technologies. Lambda MicroVMs are powered by Firecracker, the same lightweight virtualization technology that has powered over 15 trillions of monthly Lambda function invocations.

Why customers need this
Over the past few years a new class of multi-tenant applications has emerged that all share the need to hand each end user their own dedicated execution environment in which to safely run code that the application developer did not write. AI coding assistants, interactive code environments, data analytics platforms, vulnerability scanners, and game servers that run user-supplied scripts all fit this pattern. Building that capability today means making a difficult choice. Virtual machines deliver strong isolation but take minutes to start. Containers launch in seconds, yet their shared-kernel architecture requires significant custom hardening to safely contain untrusted code. Functions as a service are optimized for event-driven, request-response workloads, but are not designed for long-running interactive sessions that need to retain environment state across user interactions. That leaves developers either accepting tradeoffs between performance and isolation, or investing significant engineering resources to build and operate custom virtualization infrastructure to achieve isolated execution while delivering low-latency experiences to end-users. This presents an effort that demands deep expertise and pulls engineering time away from the product they are actually trying to build.

Lambda MicroVMs is purpose-built for exactly this gap. Each MicroVM gives a single end user or session its own isolated environment that launches rapidly, retains memory and disk state for the length of the session, and pauses to a low idle cost when the user steps away. Because the same Firecracker technology already underpins AWS Lambda Functions, you inherit the operational maturity of a service that has been running this stack at scale.

Let’s try it out
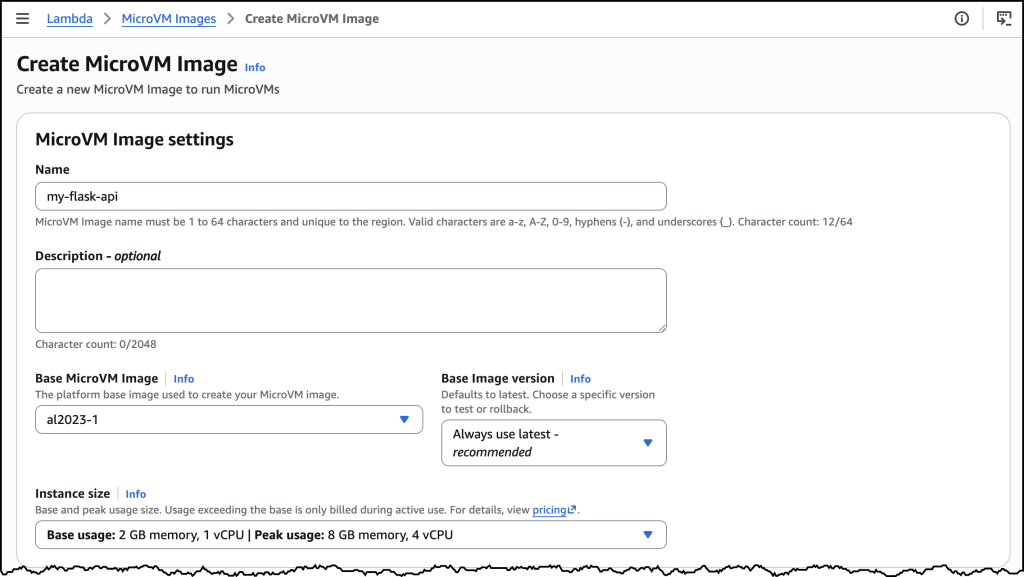
To get started, I navigated to the AWS Lambda console, where Lambda MicroVMs now appears in the left-hand navigation menu. I first need to create a MicroVM Image.

I packaged a Flask web app and its Dockerfile into a zip file, uploaded it to an Amazon Simple Storage Service (Amazon S3) bucket.

My Flask API – app.py

import logging

from flask import Flask, jsonify

app = Flask(__name__)
logging.basicConfig(level=logging.INFO)


@app.route("/")
def hello():
    app.logger.info("Received request to hello world endpoint")
    return jsonify(message="Hello, World!")


if __name__ == "__main__":
    app.run(host="0.0.0.0", port=5000)

My Dockerfile


FROM public.ecr.aws/lambda/microvms:al2023-minimal
RUN dnf install -y python3 python3-pip && dnf clean all

WORKDIR /app

COPY requirements.txt .
RUN pip install --no-cache-dir -r requirements.txt

COPY app.py .

EXPOSE 5000

CMD ["gunicorn", "--bind", "0.0.0.0:5000", "app:app"]

I used the following command to create my MicroVM Image.

aws lambda-microvms create-microvm-image \
--code-artifact uri=<path/to/s3/artifact.zip> --name <VM_image_name> \
--base-image-arn arn:aws:lambda:us-east-1:aws:microvm-image:al2023-1 \
--build-role-arn <IAM role ARN>

You can also create the MicroVM Image in the AWS Console as in the image above. Once I ran the command, Lambda retrieved the zip, ran the Dockerfile, initialized the application, and took a Firecracker snapshot of the running disk and memory state. Build logs streamed in real time to Amazon CloudWatch under /aws/lambda/microvms/<image-name>, and when the image was ready it appeared in the console with its Amazon Resource Name (ARN) and version number.

aws lambda-microvms run-microvm \
--image-identifier arn:aws:lambda:<region>:<acct>:microvm-image:my-image \
--execution-role-arn arn:aws:iam::<acct>:role/MicroVMExecutionRole \
--idle-policy '{"maxIdleDurationSeconds":900,"suspendedDurationSeconds":300,"autoResumeEnabled":true}'

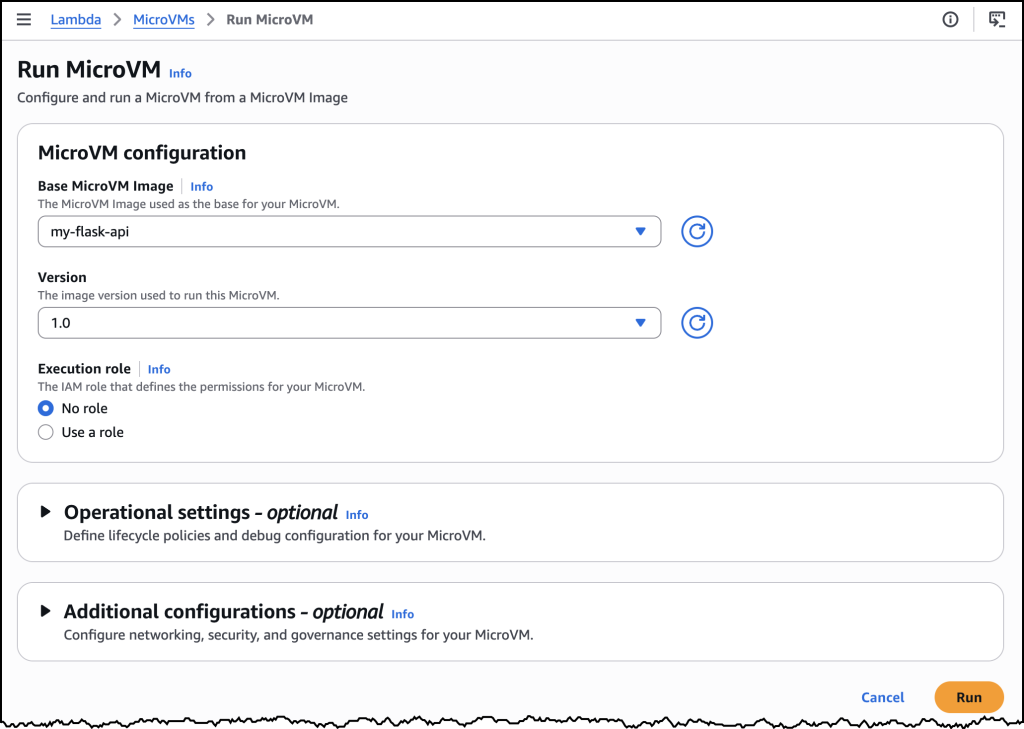
Launching can also be done via the AWS Console or the CLI. I passed the image ARN and an idle policy configured to auto-suspend after 15 minutes of inactivity and auto-resume on the next incoming request. No networking setup was required. Lambda assigned the MicroVM a unique ID, returned a dedicated endpoint URL, and started a new MicroVM with my Flask app already running, since it was resumed from a snapshot. My Flask app was already running the moment the launch completed. One API call to get a fully initialized, bootstrapped compute environment.

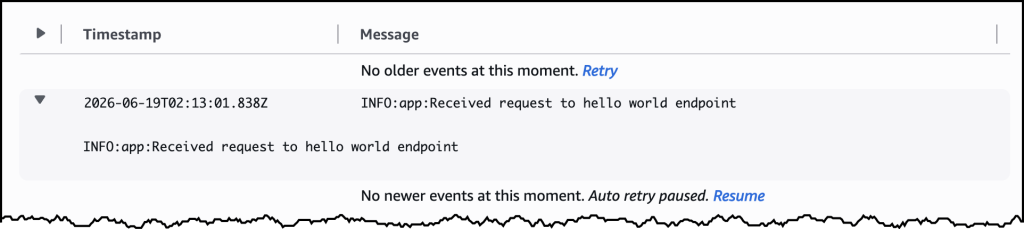
To send traffic, I generated a short-lived auth token with the CLI and attached it to a plain HTTPS request using the X-aws-proxy-auth header. The request landed on my Flask app immediately. I then let the MicroVM sit idle past the suspend threshold, at which point the MicroVM was suspended, with its memory and disk state snapshotted and stored. I then sent another request, and it resumed with the application state fully intact. From the client side, the pause never happened.

How it works
Under the covers, Lambda MicroVMs delivers three capabilities that, until today, no single AWS compute service offered together. The first is virtual machine level isolation, which comes from Firecracker. Each session runs in its own dedicated MicroVM with no shared kernel and no shared resources between users, so untrusted code supplied by one user is contained to their execution environment, without access to other environments or the underlying system. The second is rapid launch and resume. The model is image-then-launch: you create a MicroVM Image by supplying a Dockerfile and code packaged as a zip artifact in Amazon S3, and Lambda runs your Dockerfile, initializes your application, and takes a Firecracker snapshot of the running environment’s memory and disk state. Every subsequent MicroVM launched from that image resumes from the pre-initialized snapshot rather than booting cold, which means launches and idle resumes both achieve near-instant startup latency. Even a multi-gigabyte interactive session comes back online quickly enough to feel responsive to the end user. The third is stateful execution. A running MicroVM retains memory, disk, and running processes across the user’s session. During idle periods, a MicroVM can be suspended – with memory and disk state intact – and resumed when traffic arrives. Installed packages, loaded models, and working filesets are readily available when the user resumes their session. MicroVMs support up to 8 hours of total runtime and can be suspended automatically after a configurable idle window, which makes it straightforward to build products as varied as software vulnerability scans that complete in minutes, data analytics applications that run for hours, and interactive coding sessions with extended idle periods. As Lambda MicroVMs are started from pre-initialized snapshots, applications generating unique content, establishing network connections, or loading ephemeral data during initialization may need to integrate with service-provided hooks for compatibility.

Lambda MicroVMs is a new resource within AWS Lambda, with a distinct API surface. Lambda Functions remain the right choice for event-driven, request-response workloads, and Lambda MicroVMs is purpose-built for multi-tenant applications that need to hand each end user or session their own isolated environment to execute user- or AI-generated code. The two complement each other. An application using Lambda Functions for its event-driven backbone can call into Lambda MicroVMs for the steps that need to run untrusted code in isolation. You bring the application, and the service delivers the execution environment.

Now available
AWS Lambda MicroVMs is available today in the US East (N. Virginia, Ohio), US West (Oregon), Europe (Ireland) and Asia Pacific (Tokyo) Regions, on the ARM64 architecture, with up to 16 vCPUs, 32 GB of memory, and 32 GB of disk per MicroVM. Idle MicroVMs can be suspended explicitly through an API call or automatically through a lifecycle policy, which reduces the running cost while preserving full state for fast resume. Pricing details can be found on the AWS Lambda pricing page.

To get started, visit the AWS Lambda console, or learn more on the Lambda MicroVMs product page. For documentation, see the Lambda MicroVMs Developer Guide.

  •