Neutrality is quietly the hardest part of open source. It gets tricky the moment someone pays your salary — and staying honest about it takes more effort than anyone admits.
Here’s something we don’t say out loud often enough: most of us doing open source are paid to do it, at least part of the time. And this isn’t just a hunch. When Google’s Open Source Programs Office surveyed over a thousand contributors in 2023, they found that 82% of us do open source at least partly on paid time — and only 18% are pure hobbyists working purely on their own clock. More than half do both, blending personal passion with a paycheck. So the romantic picture of open source as a world of unpaid volunteers? It’s real for about one in five of us. For everyone else, a company is somewhere in the mix.
That’s not a bad thing, it’s how a huge amount of great work actually gets funded. But it does mean that conflicts of interest aren’t some rare edge case you might bump into one day. They’re there from the start, for basically all of us.
And it only gets more tangled the longer you stick around. Give it time and you’re rarely wearing just one label. Maybe you maintain a project, help run a working group, represent your employer somewhere, and volunteer for something on the side. None of that is unusual. But every one of those roles comes with its own responsibilities, its own audience, and its own quiet set of interests. Keeping them straight isn’t a nice-to-have. It’s part of the work.
So what holds all of it together? Neutrality.
The one question: who’s speaking?
The single most useful habit I’ve picked up is asking myself a small question, over and over: who’s actually speaking right now and in what capacity?
When you give a talk, sit for an interview, or drop a comment in a meeting, which version of you is talking? The maintainer? The person representing their team? The volunteer? The employee? Those aren’t the same voice, and quietly blurring them is how you end up nudging decisions you had no real standing to nudge.
That’s why, in a lot of meetings, people take a second to make it explicit: something as simple as “just to be clear, I’m saying this as a maintainer, not on behalf of my employer.” The first time you hear it, it can sound a little stiff. It isn’t. It’s a small honesty that helps everyone in the room weigh what you just said and, just as importantly, it forces you to notice which interest you’re really carrying in that moment. You don’t need a formal ritual for it. You just need the self-awareness to flag it when it matters.
Company belongs way in the back
If neutrality is the principle, here’s the practical version: your employer should sit as far in the back as you can manage.
Open source is vendor-neutral by design. Is the influence actually zero? Of course not. Priorities exist. Roadmaps get shaped by who’s paying whom to work on what — and if 82% of us are on someone’s clock, that shaping is happening constantly, whether we name it or not. That’s just reality, and pretending otherwise is naive. But the decisions should still come down to what’s best for the project and the community first and not what’s best for your employer, and not what’s best for your own career.
That last part is the uncomfortable one. Your personal goals have to take a back seat too. Not just the company’s agenda, also yours. That’s genuinely hard, and it takes ongoing, slightly awkward self-reflection. Anyone who claims they’ve got it perfectly figured out is either kidding you or not paying attention.
Give people the benefit of the doubt
Here’s the flip side, and it matters just as much. When you notice this stuff, not in yourself, but in someone else, start from the assumption that they meant well.
We’re all human. We all slip. Most of the time, when someone’s employer creeps into a conversation where it doesn’t belong, it isn’t some scheme. It’s a person who just didn’t catch themselves in the moment. Nearly always, a quiet conversation sorts it out. Sure, once in a while there’s a real agenda humming in the background. We’re people, that happens. But treating every slip as a conspiracy poisons the exact collaboration you’re trying to protect.
The whole point is that we’re working on this together. We want to move the projects, the community, and the wider ecosystem forward. That should sit behind every decision and every conversation. And if a hard conversation is what it takes to get there, have it, kindly, and in good faith.
The takeaway
Wearing a few different hats isn’t a status thing. It’s mostly a reminder to stay self-aware. Before you speak, take a second to notice which role you’re really in. Put your employer and your ego toward the back. And when someone else stumbles, assume good faith first.
Project first. Community first. Everything else after.
Managing infrastructure secrets on Kubernetes needs a backend that is self-healing and free of vendor lock-in, and that is exactly what OpenBao (the Linux Foundation’s open-source fork of HashiCorp Vault) and CloudNativePG give you: an entirely open-source stack built on two CNCF projects, Kubernetes, long since graduated, and CloudNativePG, a CNCF Sandbox project currently under evaluation for Incubation by the CNCF Technical Oversight Committee. OpenBao’s postgresql storage backend turns any PostgreSQL cluster into its encrypted key-value store, and CloudNativePG turns that cluster into a self-healing, synchronously replicated, certificate-authenticated Postgres instance with no cloud database dependency underneath it.
This recipe deploys a three-instance CNPG cluster as OpenBao’s storage backend and removes every password from the connection: the schema-owning role and the application role OpenBao itself uses both authenticate with a DatabaseRole-issued TLS client certificate, enforced by explicit pg_hba rules rather than by the absence of a password. pg_hba.conf is PostgreSQL’s client-authentication file, the thing that actually decides, per connection, whether a role needs a certificate, a password, or nothing at all.
Setting up a local test environment withcnpg-playground
Nothing about this recipe is specific to any one Kubernetes distribution: any conformant cluster with enough worker capacity will do. To follow along locally, though, the official cnpg-playground repository is the fastest path to one, since it is pre-configured with the CloudNativePG operator already. It is designed primarily around CNPG’s own demos, so it is worth knowing what it actually gives you: a single Kind cluster with six nodes, a control plane node, one node labelled for infrastructure workloads, one labelled for application workloads, and three carrying a node-role.kubernetes.io/postgres taint. That taint is exactly what our Cluster‘s tolerations in Step 1 target, and it is also what leaves OpenBao itself with only the two general-purpose nodes to schedule onto, which matters once pod anti-affinity enters the picture in Step 3. setup.sh provisions one Kind cluster per argument it is given, normally used to model separate regions; passing it a single, arbitrary label gives you one local cluster and skips the two-region disaster recovery demo entirely.
# Clone the CNPG Playground repository
git clone https://github.com/cloudnative-pg/cnpg-playground.git
cd cnpg-playground
# 1. Provision a single local cluster labelled "openbao"
./scripts/setup.sh openbao
# 2. Deploy CloudNativePG, cert-manager, the Barman Cloud plugin and a
#    ClusterImageCatalog only, skipping the demo databases
REQUIREMENTS_ONLY=true ./demo/setup.sh
Architecture blueprint
Storage engine: OpenBao’s native postgresql storage backend, with ha_enabled = "true" for its HA lock table.
Database cluster: a 3-instance CNPG cluster with quorum-based synchronous replication (method: any, number: 1, the default dataDurability: required) for zero-data-loss failover.
Workload isolation: node selectors, tolerations and required zonal pod anti-affinity keep PostgreSQL on dedicated nodes across separate failure domains, following CNPG’s scheduling guidance.
Authentication: passwordless mTLS via the DatabaseRole CRD’s clientCertificate block, for both the schema owner and the application role, enforced by explicit pg_hba rules.
Step 1: deploy the CNPG cluster, roles and database
The Cluster below points imageCatalogRef at the postgresql-minimal-trixie ClusterImageCatalog that REQUIREMENTS_ONLY=true ./demo/setup.sh already deployed in the previous step, rather than pinning an image tag directly: CNPG resolves it to the latest minimal PostgreSQL 18 image in that catalog, so a kubectl apply against the same manifest keeps picking up new patch releases as the catalog is updated, no Cluster edit required. It also declares synchronous replication, workload isolation, and the two pg_hba rules that force certificate authentication for both roles OpenBao will use. Two DatabaseRole objects follow: role-openbao, the schema owner used once to run DDL, and role-openbao-rw, the restricted role OpenBao itself connects as at runtime. Both get a clientCertificate, because a one-shot DDL job is no more entitled to a password lying around than the application is.
{{apiVersion: postgresql.cnpg.io/v1
kind: Cluster
metadata:
  name: openbao-db
  namespace: openbao
spec:
  instances: 3

  # Tracks the latest minimal PostgreSQL 18 image via the ClusterImageCatalog
  # the playground's REQUIREMENTS_ONLY step already deploys.
  # See https://cloudnative-pg.io/docs/current/image_catalog
  imageCatalogRef:
    apiGroup: postgresql.cnpg.io
    kind: ClusterImageCatalog
    name: postgresql-minimal-trixie
    major: 18

  # See https://cloudnative-pg.io/docs/current/scheduling
  affinity:
    nodeSelector:
      node-role.kubernetes.io/postgres: ""
    tolerations:
      - key: node-role.kubernetes.io/postgres
        operator: Exists
        effect: NoSchedule
    enablePodAntiAffinity: true
    topologyKey: topology.kubernetes.io/zone
    podAntiAffinityType: required

  postgresql:
    # Synchronous replication: dataDurability defaults to "required", giving
    # RPO=0 at the cost of pausing writes if no standby is available.
    # See https://cloudnative-pg.io/docs/current/replication
    synchronous:
      method: any
      number: 1

    # The operator does not add cert rules for DatabaseRole client
    # certificates automatically: without these, "openbao" and "openbao-rw"
    # would fall through to the default scram-sha-256 rule, and since
    # neither role has a passwordSecret, every connection would simply fail.
    pg_hba:
      - hostssl openbao openbao all cert
      - hostssl openbao openbao-rw all cert
      - hostnossl openbao openbao all reject
      - hostnossl openbao openbao-rw all reject

    # See https://cloudnative-pg.io/docs/current/postgresql_conf
    parameters:
      max_connections: '100'
      log_checkpoints: 'on'
      log_lock_waits: 'on'
      hot_standby_feedback: 'on'
      shared_memory_type: 'sysv'
      dynamic_shared_memory_type: 'sysv'

  storage:
    size: 10Gi
---
apiVersion: postgresql.cnpg.io/v1
kind: DatabaseRole
metadata:
  name: role-openbao
  namespace: openbao
spec:
  cluster:
    name: openbao-db
  name: openbao
  login: true
  clientCertificate:
    enabled: true
  databaseRoleReclaimPolicy: retain
---
apiVersion: postgresql.cnpg.io/v1
kind: DatabaseRole
metadata:
  name: role-openbao-rw
  namespace: openbao
spec:
  cluster:
    name: openbao-db
  name: openbao-rw
  login: true
  clientCertificate:
    enabled: true
  databaseRoleReclaimPolicy: retain
---
apiVersion: postgresql.cnpg.io/v1
kind: Database
metadata:
  name: openbao-db
  namespace: openbao
spec:
  name: openbao
  owner: openbao
  cluster:
    name: openbao-db

}}


Apply these resources:
kubectl create namespace openbao
kubectl apply -f cnpg-stack.yaml
Watch for all three instance pods to come up, which takes a couple of minutes on a fresh cluster:
kubectl get pods -w -n openbao
Once all three are Running and Ready, confirm the cluster itself has reached a healthy state:
kubectl cnpg -n openbao status openbao-db
Cluster Summary
Name                     openbao/openbao-db
System ID:               7674399793927340061
PostgreSQL Image:        ghcr.io/cloudnative-pg/postgresql:18.6-202608131513-minimal-trixie@sha256:e488b1434919f455f2ee4e18a181ce9b33f34cdd8dfb821126855486bce6ad34
Primary instance:        openbao-db-1
Primary promotion time:  2026-08-15 23:10:49 +0000 UTC (3m15s)
Status:                  Cluster in healthy state
Instances:               3
Ready instances:         3
Size:                    135M
Current Write LSN:       0/6000060 (Timeline: 1 - WAL File: 000000010000000000000006)
Continuous Backup not configured
Streaming Replication status
Replication Slots Enabled
Name          Sent LSN   Write LSN  Flush LSN  Replay LSN  Write Lag  Flush Lag  Replay Lag  State      Sync State  Sync Priority  Replication Slot
----          --------   ---------  ---------  ----------  ---------  ---------  ----------  -----      ----------  -------------  ----------------
openbao-db-2  0/6000060  0/6000060  0/6000060  0/6000060   00:00:00   00:00:00   00:00:00    streaming  quorum      1              active
openbao-db-3  0/6000060  0/6000060  0/6000060  0/6000060   00:00:00   00:00:00   00:00:00    streaming  quorum      1              active
Instances status
Name          Current LSN  Replication role  Status  QoS         Manager Version  Node
----          -----------  ----------------  ------  ---         ---------------  ----
openbao-db-1  0/6000060    Primary           OK      BestEffort  1.30.0           k8s-openbao-worker3
openbao-db-2  0/6000060    Standby (sync)    OK      BestEffort  1.30.0           k8s-openbao-worker4
openbao-db-3  0/6000060    Standby (sync)    OK      BestEffort  1.30.0           k8s-openbao-worker5
Note the PostgreSQL Image line: a SHA-pinned, dated minimal build resolved straight out of the postgresql-minimal-trixie catalog, not a floating tag we wrote by hand.
Both standbys show up as Standby (sync) with a Sync State of quorum at the same time, which is exactly the dynamic behaviour method: any is meant to give: with number: 1, either standby satisfies durability, and CNPG does not pin a fixed “the” synchronous standby.
Once reconciled, the operator has created two client certificate secrets, role-openbao-client-cert and role-openbao-rw-client-cert, following its <databaserole-name>-client-cert naming convention. openbao, as the database owner, already has CREATE on the public schema by default (PostgreSQL grants that to the owner even though it revoked it from PUBLIC in v15), so no extra schema grant is needed before the DDL step.
Every manifest that mounts one of these secrets sets defaultMode: 0640 on the volume. Kubernetes mounts Secret volumes at 0644 by default, which libpq refuses outright: it rejects a private key file that is group-or-world-readable, whether owned by root (0640 or less) or by the connecting user (0600 or less). Since the mounted files stay root-owned and only their group matches the pod’s fsGroup, 0640 is the setting that satisfies libpq here, and it applies to every pod in this recipe that reads a client certificate, the schema-init Job and the OpenBao pods alike.
Step 2: initialise the schema and grant table privileges
DatabaseRole does not yet manage table-level grants: the permissions stanza that would let a Database object express GRANT/REVOKE declaratively is still an open proposal (#10826), as I covered when DatabaseRole first shipped in Recipe 25. Until that lands, a one-time Job running the DDL as the schema owner is the correct way to create OpenBao’s tables and grant the restricted DML the openbao-rw role actually needs.
OpenBao’s postgresql storage backend expects two tables when ha_enabled = "true": openbao_kv_store, with a parent_path, path, key and value column and a primary key on (path, key), and openbao_ha_locks, holding its HA lock records. Getting the key column or the primary key wrong here is an easy mistake, since OpenBao would otherwise silently create the table itself on first connection using its own DDL, and that path only works if the connecting role already has CREATE, which openbao-rw deliberately does not. Pre-creating both tables under the owner role and setting skip_create_table on the OpenBao side (Step 3) keeps that DDL entirely off the restricted runtime role.
The same job also closes a gap PostgreSQL leaves open by default: every database grants CONNECT to PUBLIC, and the public schema grants USAGE to PUBLIC too, so any role that can log into the cluster at all can connect to openbao and see what is in its public schema unless told otherwise. Making REVOKE CONNECT … FROM PUBLIC the default posture across every database CloudNativePG manages is on the roadmap (#10831), but it is not there yet, so the schema-init job revokes it explicitly here and grants back only what openbao-rw actually needs:
{{apiVersion: batch/v1
kind: Job
metadata:
  name: openbao-schema-init
  namespace: openbao
spec:
  ttlSecondsAfterFinished: 300 # Clean up job 5 minutes post-completion
  template:
    metadata:
      name: openbao-schema-init
    spec:
      restartPolicy: OnFailure
      securityContext:
        runAsNonRoot: true
        runAsUser: 26
        fsGroup: 26
        seccompProfile:
          type: RuntimeDefault
      containers:
        - name: psql-init
          image: ghcr.io/cloudnative-pg/postgresql:18-minimal-trixie
          securityContext:
            allowPrivilegeEscalation: false
            capabilities:
              drop:
                - ALL
          resources:
            requests:
              cpu: "100m"
              memory: "64Mi"
            limits:
              cpu: "500m"
              memory: "128Mi"
          command:
            - psql
            - "postgres://openbao@openbao-db-rw:5432/openbao?sslmode=verify-full&sslcert=/etc/certs/tls.crt&sslkey=/etc/certs/tls.key&sslrootcert=/etc/ca/ca.crt"
            - -c
            - |
              CREATE TABLE IF NOT EXISTS openbao_kv_store (
                parent_path TEXT NOT NULL,
                path        TEXT NOT NULL,
                key         TEXT NOT NULL,
                value       BYTEA,
                CONSTRAINT openbao_kv_store_pkey PRIMARY KEY (path, key)
              );
              CREATE INDEX IF NOT EXISTS openbao_kv_store_idx
                ON openbao_kv_store (parent_path);

              CREATE TABLE IF NOT EXISTS openbao_ha_locks (
                ha_key       TEXT NOT NULL,
                ha_identity  TEXT NOT NULL,
                ha_value     TEXT,
                valid_until  TIMESTAMP WITH TIME ZONE NOT NULL,
                CONSTRAINT openbao_ha_locks_pkey PRIMARY KEY (ha_key)
              );

              GRANT SELECT, INSERT, UPDATE, DELETE
                ON TABLE openbao_kv_store, openbao_ha_locks
                TO "openbao-rw";

              REVOKE CONNECT ON DATABASE openbao FROM PUBLIC;
              GRANT CONNECT ON DATABASE openbao TO "openbao-rw";

              REVOKE ALL ON SCHEMA public FROM PUBLIC;
              GRANT USAGE ON SCHEMA public TO "openbao-rw";
          volumeMounts:
            - name: certs
              mountPath: /etc/certs
              readOnly: true
            - name: ca
              mountPath: /etc/ca
              readOnly: true
      volumes:
        - name: certs
          secret:
            secretName: role-openbao-client-cert
            defaultMode: 0640
        - name: ca
          secret:
            secretName: openbao-db-ca
            defaultMode: 0640

}}

Apply the job:
kubectl apply -f schema-init-job.yaml

Wait for its pod to finish ContainerCreating and complete before reading its logs, otherwise kubectl logs fails outright rather than waiting:

kubectl wait --for=condition=complete -n openbao job/openbao-schema-init --timeout=60s
kubectl logs -n openbao job/openbao-schema-init
CREATE TABLE
CREATE INDEX
CREATE TABLE
GRANT
REVOKE
GRANT
REVOKE
GRANT
Eight statements in, eight confirmations out: both tables, the DML grant, and the three REVOKE/GRANT pairs that lock the database and the public schema down to openbao-rw.
Step 3: configure and deploy OpenBao via Helm
Configure the official OpenBao Helm chart. Mount the role-openbao-rw-client-cert secret into OpenBao and point the postgresql storage stanza at it with sslmode=verify-full. A few details that are easy to miss from the OpenBao side: skip_create_table must be set explicitly, since openbao-rw has no CREATE privilege and would otherwise fail on first connection when OpenBao tries to create the tables itself, and server.dataStorage needs disabling, since it defaults to a 10Gi PVC per pod that would otherwise sit there unused: the whole point of this stack is that OpenBao carries no local state at all. Mounting the certificate and CA secrets also needs the right chart field: server.extraVolumes looks like the obvious choice, but it uses its own simplified type/name/path schema rather than a raw Kubernetes volume, and there is no matching extraVolumeMounts field for the server StatefulSet at all. server.volumes and server.volumeMounts are the fields that pass straight through to the Pod spec, and are what the manifest below actually uses.
{{global:
  enabled: true

server:
  # No local persistence: all state lives in CNPG.
  dataStorage:
    enabled: false

  ha:
    enabled: true
    replicas: 3

    config: |
      ui = true

      listener "tcp" {
        tls_disable = 1
        address     = "[::]:8200"
        cluster_address = "[::]:8201"
      }

      storage "postgresql" {
        connection_url    = "postgres://openbao-rw@openbao-db-rw:5432/openbao?sslmode=verify-full&sslcert=/etc/openbao/certs/tls.crt&sslkey=/etc/openbao/certs/tls.key&sslrootcert=/etc/openbao/ca/ca.crt"
        table             = "openbao_kv_store"
        ha_table          = "openbao_ha_locks"
        ha_enabled        = "true"
        skip_create_table = "true"
      }

  # cnpg-playground only: with the Postgres nodes tainted and off limits,
  # only two general-purpose nodes are left, one short of what three
  # required-anti-affinity replicas need. Tolerating the control-plane
  # taint gives OpenBao a third node to land on. Drop this in a cluster
  # with three or more untainted worker nodes, and never carry it into
  # production: workloads should not run on the control plane there.
  tolerations:
    - key: node-role.kubernetes.io/control-plane
      operator: Exists
      effect: NoSchedule

  # Mount the openbao-rw DatabaseRole's client certificate and the
  # cluster's client CA. "volumes"/"volumeMounts" are passed through to the
  # Pod spec as-is; the chart's own "extraVolumes" field uses a different,
  # simplified schema (type/name/path) that does not accept a raw Secret
  # volume, and there is no "extraVolumeMounts" field for the server
  # StatefulSet at all.
  volumes:
    - name: cnpg-client-cert
      secret:
        secretName: role-openbao-rw-client-cert
        defaultMode: 0640
    - name: cnpg-client-ca
      secret:
        secretName: openbao-db-ca
        defaultMode: 0640

  volumeMounts:
    - name: cnpg-client-cert
      mountPath: /etc/openbao/certs
      readOnly: true
    - name: cnpg-client-ca
      mountPath: /etc/openbao/ca
      readOnly: true

}}

Install OpenBao following the official OpenBao Kubernetes documentation:
helm repo add openbao https://openbao.github.io/openbao-helm
helm repo update
helm install openbao openbao/openbao \
  --namespace openbao \
  -f openbao-values.yaml
Pod anti-affinity for the OpenBao replicas is not something this recipe has to configure: the chart’s server.affinity default already renders a requiredDuringSchedulingIgnoredDuringExecution rule keyed on kubernetes.io/hostname, so the three server pods refuse to land on the same node. In cnpg-playground specifically, that is worth double checking rather than assuming: with the Postgres nodes tainted and off limits, only the infra- and app-labelled nodes are left for general workloads, one short of what three required-anti-affinity replicas need. The manifest above adds a server.tolerations entry for the node-role.kubernetes.io/control-plane taint so OpenBao can use that node as its third, which is a reasonable thing to do on a single-developer Kind cluster and not something to carry into a real cluster, where the control plane should stay clear of ordinary workloads. On a cluster with three or more untainted worker nodes, the toleration is unnecessary and the chart’s default anti-affinity just works on its own.
Only openbao-0 and openbao-1 exist so far, and openbao-1 shows 0/1: the StatefulSet's default OrderedReady policy will not even create openbao-2 until openbao-1 reports Ready, and readiness here is the unseal status, not just the process being up. That is exactly why the initialisation and unsealing below has to happen pod by pod, in order: openbao-0 first, then openbao-1, then openbao-2, each one only created once its predecessor is unsealed.
Initialise and unseal OpenBao
Initialise the cluster on openbao-0 and unseal all three pods:
kubectl exec -it -n openbao openbao-0 — bao operator init
Store the generated unseal keys and root token securely.
Each pod’s Shamir state is independent and in memory: unsealing openbao-0 does nothing for openbao-1 or openbao-2, so the same three keys have to be submitted again, against each pod by name, one pod at a time:
Until a pod’s three keys go in, kubectl describe pod on it shows Unseal Progress: 0/3 and a stream of Warning Unhealthy readiness-probe events. Neither is a problem: it is the probe correctly reporting that the pod is still sealed, and it clears as soon as that pod gets its keys.
The third key flips Sealed to false:
Key             Value
---             -----
Seal Type       shamir
Initialized     true
Sealed          false
Total Shares    5
Threshold       3
Version         2.6.1
Commit Date     2026-07-22T14:22:33Z
Storage Type    postgresql
Cluster Name    vault-cluster-97b6aa67
Cluster ID      634fcfcf-09f2-b719-f9bf-1f684cfbe88a
HA Enabled      true
HA Cluster      n/a
HA Mode         standby
Storage Type: postgresql here is the whole point of this recipe, and it is not just reporting the config back: OpenBao writes its own bootstrap state, the keyring, the root key material, its seal configuration, before you ever create an application secret. Query the cluster directly and it is already there:
Every one of those rows lives in the openbao_kv_store table this recipe’s schema-init Job created, written by the openbao-rw role with nothing but a client certificate.
Read/write test
Confirm OpenBao can write an encrypted payload through to CNPG using the restricted openbao-rw role:
# Login
kubectl exec -it -n openbao openbao-0 -- bao login <ROOT_TOKEN>
# Enable KV v2 and write a secret
kubectl exec -it -n openbao openbao-0 -- bao secrets enable -path=secret kv-v2
kubectl exec -it -n openbao openbao-0 -- bao kv put secret/test-app username="admin" password="supersecretpassword"
# Read it back
kubectl exec -it -n openbao openbao-0 -- bao kv get secret/test-app
kubectl exec -it -n openbao openbao-0 -- bao kv get secret/test-app
Run the same SELECT key FROM openbao_kv_store; query again and a new row for secret/test-app shows up alongside the bootstrap keys, its value column holding the payload as an encrypted BYTEA blob, never plaintext, even to someone with direct PostgreSQL access to the table.
Now that all three pods are unsealed, -o wide on the whole namespace shows the full picture: the three CNPG instances on their three dedicated, tainted Postgres nodes, and the three OpenBao replicas spread across the control-plane node and the two general-purpose ones, required anti-affinity satisfied without a single pod colocated with another:
All seven workloads nicely distributed across the six available nodes on the playground, control plane included, exactly as intended.
Operational notes: certificate renewal
CNPG’s client certificates carry a 90-day validity period and are renewed automatically about a week before expiry, the same schedule the operator already applies to the streaming_replica certificate (see Certificates). Renewal replaces the contents of the role-openbao-rw-client-cert secret in place, no manifest change required. Both figures are inherited unconditionally from the operator’s own global settings today; a proposal to let clientCertificate override duration and renewBefore per DatabaseRole, mirroring cert-manager’s convention, is open in issue #11312, useful if a role like role-openbao-rw ever needs a renewal cadence different from the cluster-wide default.
OpenBao itself does not pick that renewal up on its own. Like Vault before it, OpenBao’s postgresql storage backend opens its connection pool once at process startup and never re-reads the certificate files afterwards, so a renewed certificate only takes effect after a rolling restart of the OpenBao pods. This is a property of the storage plugin’s own connection lifecycle, not something CNPG’s certificate reconciliation controls: CNPG’s job ends at keeping the secret current, and nothing on the CNPG side requires a restart. Until OpenBao’s storage backend gains a way to reload its connection pool’s TLS material on signal, budget for a scheduled rolling restart inside the 83-day renewal window, well before the old certificate actually expires.
Beyond this setup: backups and disaster recovery
This is a single-cluster deployment. High availability inside the Kubernetes cluster is covered by the three OpenBao replicas, CNPG’s synchronous replication and required zonal anti-affinity, but production workloads need more than that:
Automated PostgreSQL backups: the in-tree .spec.backup.barmanObjectStore stanza is deprecated as of CNPG 1.26 in favour of the Barman Cloud Plugin: define an ObjectStore pointing at AWS S3, Google Cloud Storage or Azure Blob Storage, reference it from the Cluster's .spec.plugins, and back it with Backup/ScheduledBackup resources using method: plugin for continuous WAL archiving and scheduled base backups, enabling Point-In-Time Recovery.
Disaster recovery: to meet real RTO/RPO targets, span the deployment across more than one Kubernetes cluster. CNPG’s distributed topology lets an asynchronous replica cluster in a second region or cluster promote to primary if the first one is lost entirely, the same capability I discussed for cloud-neutral portability.
Conclusion
Combining OpenBao with CloudNativePG gives you a fully open-source, enterprise-grade secrets engine running on native Kubernetes CRDs, with the DatabaseRole CRD covering every role in the stack rather than just the application-facing one. Synchronous replication gives zero-data-loss failover, explicit pg_hba rules turn the absence of a password into an actual enforced policy rather than an assumption, and dedicated scheduling rules keep the database’s failure domains separate from everything else running in the cluster.
If you have ideas, questions, or run into something this recipe does not cover, reach out to Rob and Gabrielle directly on LinkedIn, or find us on the CloudNativePG community’s CNCF Slack.
On July 18, 2026, we held the third edition of Kubernetes Community Days Lima at UTEC in Barranco. By now, we have already sent the Transparency Report to the CNCF, thanked our sponsors, and processed the surveys. With the administrative wrap-up behind us, I want to share a few reflections on what it meant to organize it.
Before I continue, a quick introduction of me. I’m Ronald Requena, CTO at Rumbo, professor at Universidad Ricardo Palma, co-organizer of KCD Lima and DevOpsDays Lima, and, as of August 2026, CNCF Ambassador for Peru. Feel free to connect with me or reach out on LinkedIn.
This is the third KCD I have had the opportunity to co-organize. I assumed that by the third edition many things would run on autopilot. They did not. Every edition brings new problems, and the old ones do not go away; they just change in scale.
An image I will not forget
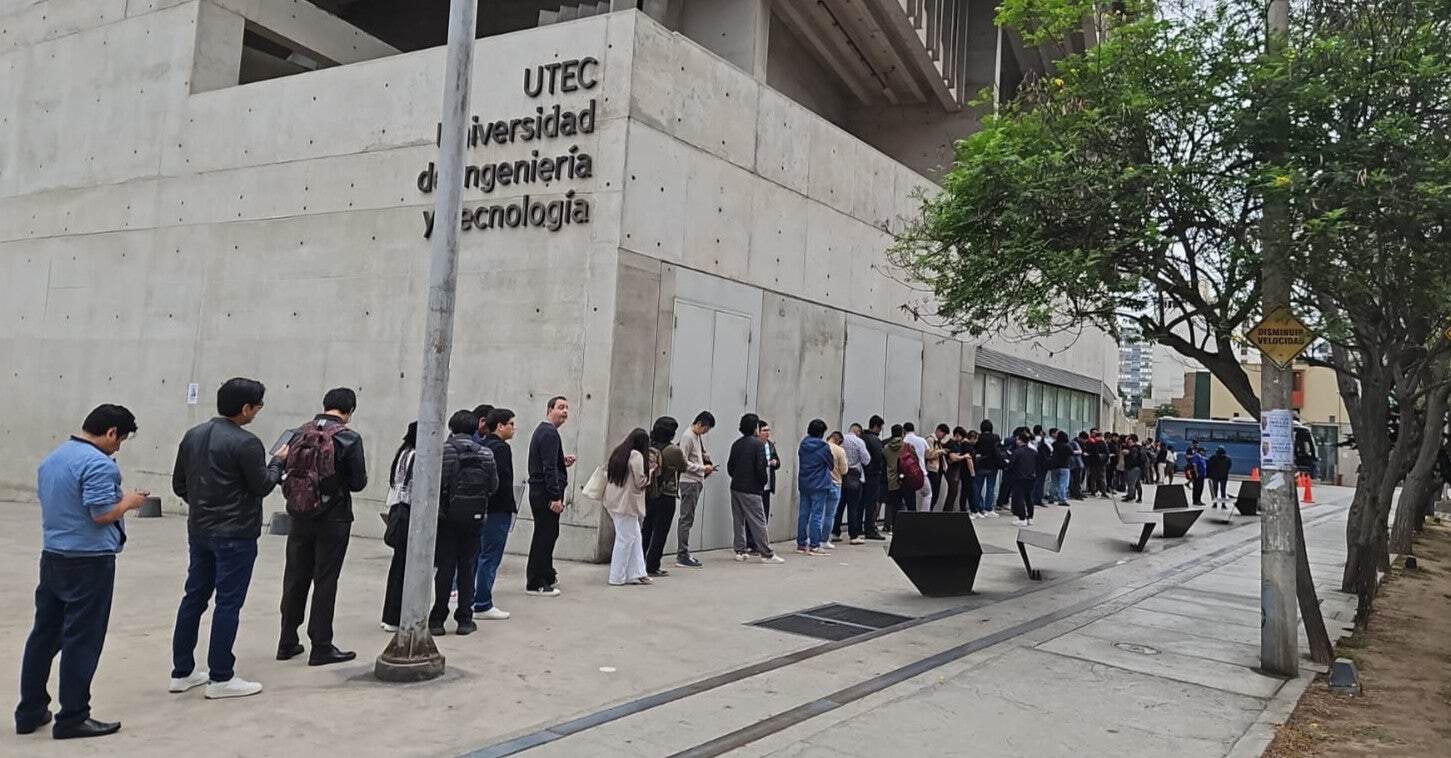
I arrived at UTEC at 7:00 a.m., an hour and a half before the scheduled 8:30 opening. There was already a line of around 100 attendees outside the building. A Saturday morning, coffee in hand, waiting to get into the long-awaited Kubernetes Community Days Lima. We had to move registration forward to 8:00 because the line kept growing.
No survey can measure the kind of welcome we had that Saturday, from early risers eager to be the first ones through the door.
The numbers
I find it hard to write without data, so let me start there:
2,244 registrations and more than 900 attendees in a single day. Roughly 75% more attendance than in 2025 and the largest of our three editions.
60 speakers and 54 sessions across 5 parallel rooms, selected from 89 proposals submitted by 44 companies from 14 countries.
5 international keynotes: Jeffrey Sica, Viktor Farcic, Lin Sun, Mauricio Salatino and Daniel Oh.
11 sponsors across five tiers: Testkube, Red Hat, Valkey, and Interbank as Diamond; VMware by Broadcom as Platinum; SUSE | V LATAM, Upwind, and Orca Security as Gold; BCP and Crubyt as Silver; and Rumbo as Bronze.
4.7 out of 5 satisfaction in the post-event survey. 98% rated the event 4 or 5 stars, and no one rated it below 3.
That last number is the one that matters most. The others speak to size; this one speaks to whether it was truly worth it for the people who came. Every number here is public: each KCD organizing team submits a transparency report to the CNCF, and ours is no exception
Three editions, three stages
Looking back, each edition had a different goal, even if we never framed it that way at the time.
2024 was about proving that a KCD could happen in Peru. We had no track record to show sponsors and no idea how many people would show up. We closed with more than 500 attendees, 49 speakers, and 11 sponsors. That first edition was organized with a lot of will and very little certainty.
2025 was about proving it had not been a fluke. The second year is the hardest: you are no longer a novelty, but you are not yet a tradition. We reached 1,377 registrations and 520 attendees, with 59 speakers across 7 rooms. That year we learned to document: the sponsor guide, the contracts, the run-of-show, the cash flow. What we improvised in 2024 had to be written down in 2025 so it would not depend on anyone’s memory.
2026 was about proving the event now has a life of its own. We nearly doubled attendance, sponsors came back and new ones joined, and international speakers said yes because they already knew KCD Lima. This year I understood that the community no longer needs to be convinced to attend. What it needs is for us to live up to the expectations it created for itself.
With each edition, what the event represents to you changes. The first time, it was a personal challenge. The second, a commitment. The third starts to become a responsibility toward people you do not know: the student who came alone, the professional who carved out a Saturday to be there, the speaker who flew ten hours for a thirty-minute talk.
One thing does not change: the community cannot be delegated. You can delegate logistics, design, or the website. But deciding what kind of event we want to be, who is welcome, and what conversation we want to happen in Lima, that has to be done every year, deliberately.
What goes unseen
When you think about organizing an event, you picture the agenda, the speakers, and the venue. All of that exists. But a good part of the time goes into things that never make it into a photo.
This year we completed a variety of forms for US-based sponsors and went through several vendor onboarding processes, each with its own questionnaires and validations. We reviewed sponsorship agreement clauses with companies: liability, sector exclusivity, refund conditions.
We built a budget with cash flow in both soles and dollars, because revenue arrives in one currency and expenses go out in another. We drew and designed the event layout: five rooms, ten booths, four coffee stations, stairs, and elevators.
I am not saying this as a complaint. I am saying it because there is a notion that community “just happens” and it does not. Someone has to do the part that no one sees. Many KCD organizers around the world will recognize this immediately. If you have never organized one, you probably will not — and that is okay too. It is not meant to be seen.
What connects with my work
Three data points from the attendee profile made me think about what I do outside the event.
45% came from end-user companies, and within that group, banking and finance was the largest sector, accounting for a third of all attendees: BCP, Interbank, Scotiabank, Compartamos, Pacífico, and others. I spent several years in banking leading engineering and architecture teams, and seeing that industry fill a cloud native auditorium in Lima confirms that digital transformation in Peruvian banking is no longer a slide deck. These are real platform teams, with DevOps engineers and SREs who need a community to learn from.
15% were architects, the most common role, ahead of developers and DevOps. That tells me cloud native adoption in Peru is at a stage where design decisions carry as much weight as implementation. It is the conversation I have almost daily in consulting.
8% of attendees came from Universities. I teach at a university, and I know how hard it is for a student to feel that an event like this is meant for them. That is why KCD Lima is free and we reserve space for students: the barrier cannot be the price of a ticket. That people registered as students and showed up on a Saturday is one of the things I value most about this edition.
What should be done differently
The survey was positive, but it was also clear. Four things remain open:
The coffee break was not enough. We sized four stations for 600 people and 900+ showed up. Next time, we plan with a margin above expected capacity.
Punctuality between sessions. With five parallel rooms, a five-minute delay in one throws the other four off. We need room moderators with more control over the clock.
Session pre-registration. There were packed rooms and half-empty rooms for talks of equal quality. If we know demand in advance, we can allocate space better.
More women on stage. Out of 60 speakers, only 5 were women. Among attendees, female participation was 17%, so the gap on stage is wider than in the audience. It is a number we would rather publish than omit, because it is the starting point for doing something about it in a future CFP.
Thank you
To Josua Castro, who led the organization of this edition, and to the team I shared these months with: Andreé Cordero, Almendra Paz, Bianca Torres, Enzo Venturi, Jean Paul López, Pavel Puclla, and Michelle Luna. Nine people, all with full-time jobs, holding up an event with more than 900 attendees. What people saw on July 18 was the result of that team.And to our volunteers, who ran registration, guided attendees across five rooms, kept sessions on time, and solved a hundred small problems no one else noticed. An event of this size does not work without them.
To Eric Biagioli and Cindy Archenti, for helping us with the unexpected and everything that was not in the plan. And to all of UTEC for opening the entire campus to us. To the CNCF for backing the KCD program. To the 60 speakers who prepared, traveled, and gave up their Saturday. To the sponsors who bet on Lima before seeing the numbers, and who make it possible for an event of this size to be free for the community.
And to the more than 900 people who showed up on a Saturday, from 7:00 a.m. to 6:00 p.m.
Three editions later, in August, I was accepted into the CNCF Ambassadors program. It is an honor to join that global community, and I take it as motivation to keep working so that Lima keeps growing as a cloud native hub in the region.
What comes next, I do not know yet. But that 7 a.m. line is something I will not forget.
This document describes three failure scenarios that separate having backups from being able to recover, and the guidance that follows from each. Every scenario is reproducible on a laptop from the lab repository above, and every terminal output shown is a real capture from that lab.
The document covers recovery of stateful applications running on Kubernetes: verifying that backups contain data, the split between declared state and stored state, and consistency across multi-volume applications. It does not cover compliance frameworks, product comparisons, or recovery of the underlying cloud or datacenter infrastructure, though it names where those responsibilities begin.
Specific tools appear where a scenario needs them (Velero, the CSI snapshot APIs). They are reference implementations used to make the scenarios concrete. The failure modes and the guidance apply to any tool occupying the same role.
Definitions
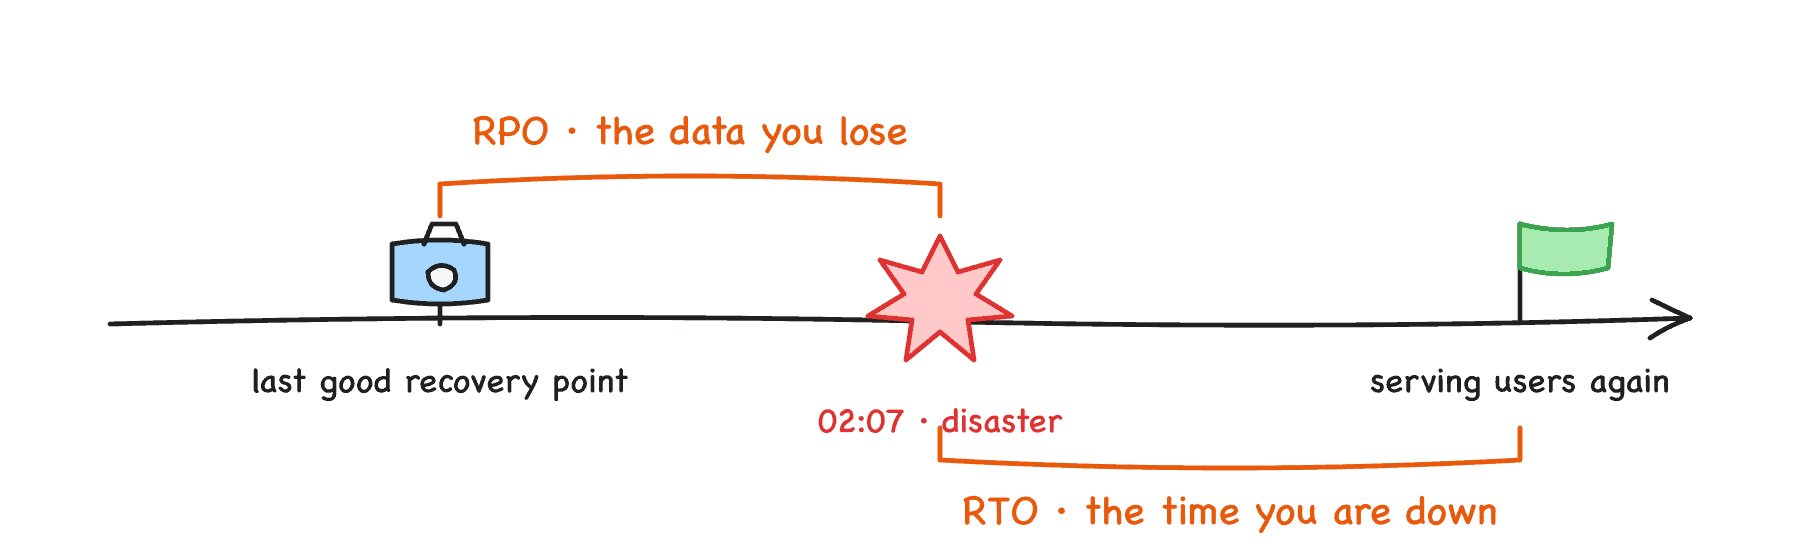
RPO and RTO on one timeline
The four recovery layers
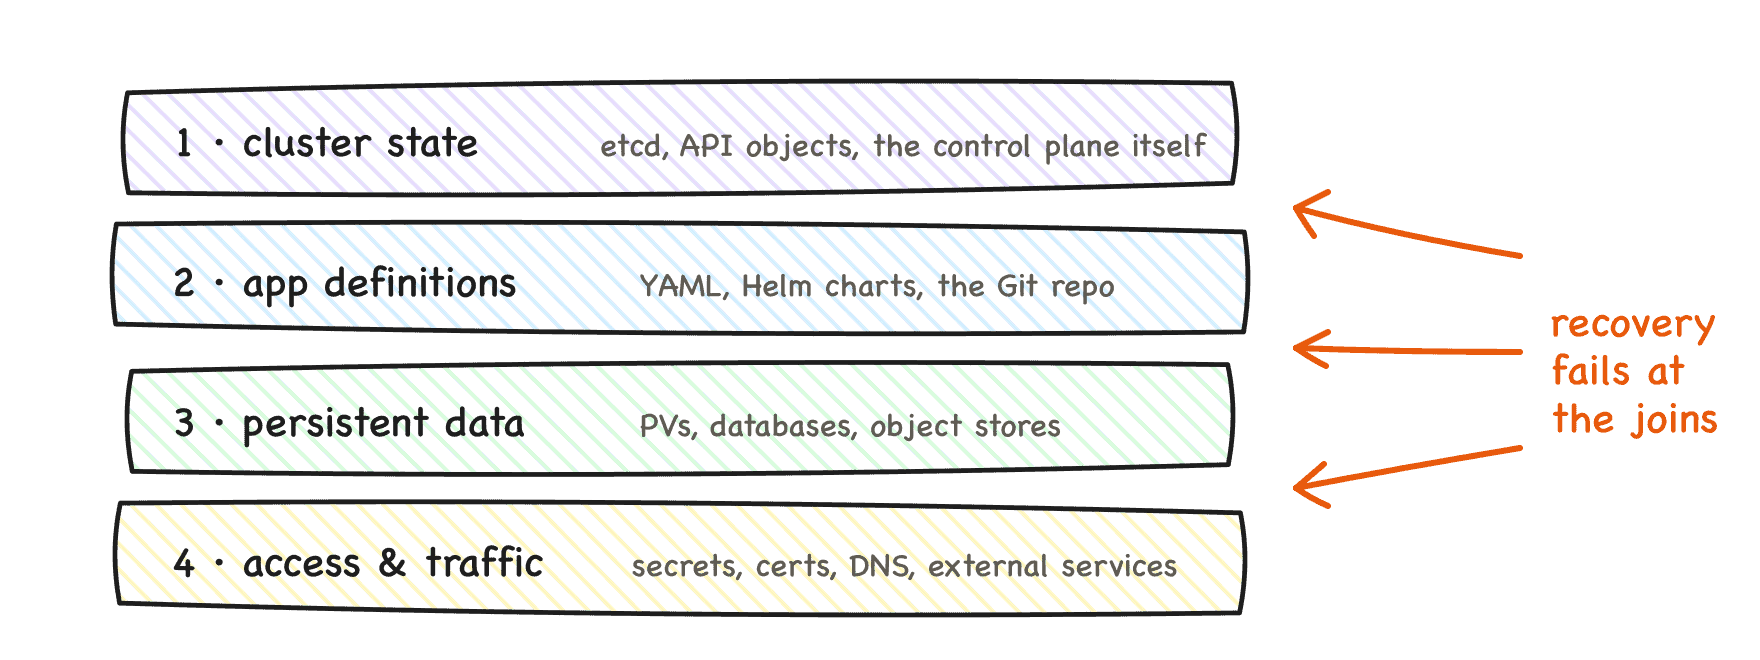
For a recovery to count, four layers must come back:
The four recovery layers
Each layer has mature tooling, and each usually recovers fine in isolation. Recovery fails at the joins between the layers: a restored cluster with no data, restored data with no traffic path, an application definition that provisions an empty volume. The three scenarios below each break one join.
The lab
The whole lab in one picture
Two clusters and two services, all local:
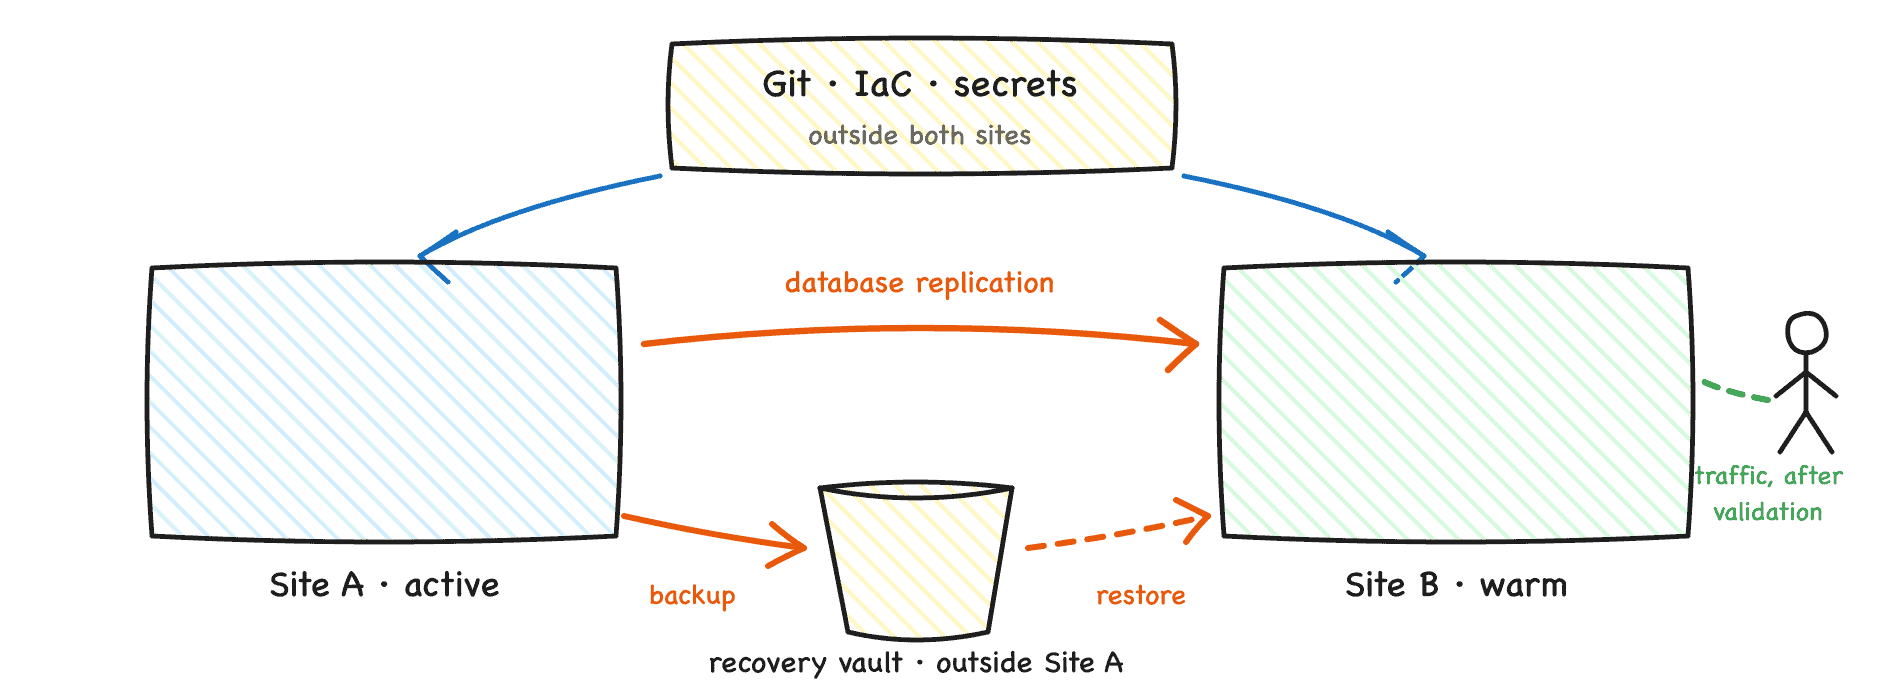
Production: a Kubernetes cluster where each node is its own lightweight VM with its own kernel, so losing production means powering off a machine.
Recovery: a second cluster that exists before anything goes wrong.
Backup store: an S3-compatible object store outside both clusters, so losing either cluster cannot take the recovery points with it. Both clusters point their backup tool at the same bucket.
Git: a local Git service holding the application manifests, watched by a GitOps controller in the recovery cluster.
The workload is a PostgreSQL application with known contents (four rows), so every restore can be validated against an expected result rather than against a green dashboard.
Scenario 1: verifying that a backup contains data
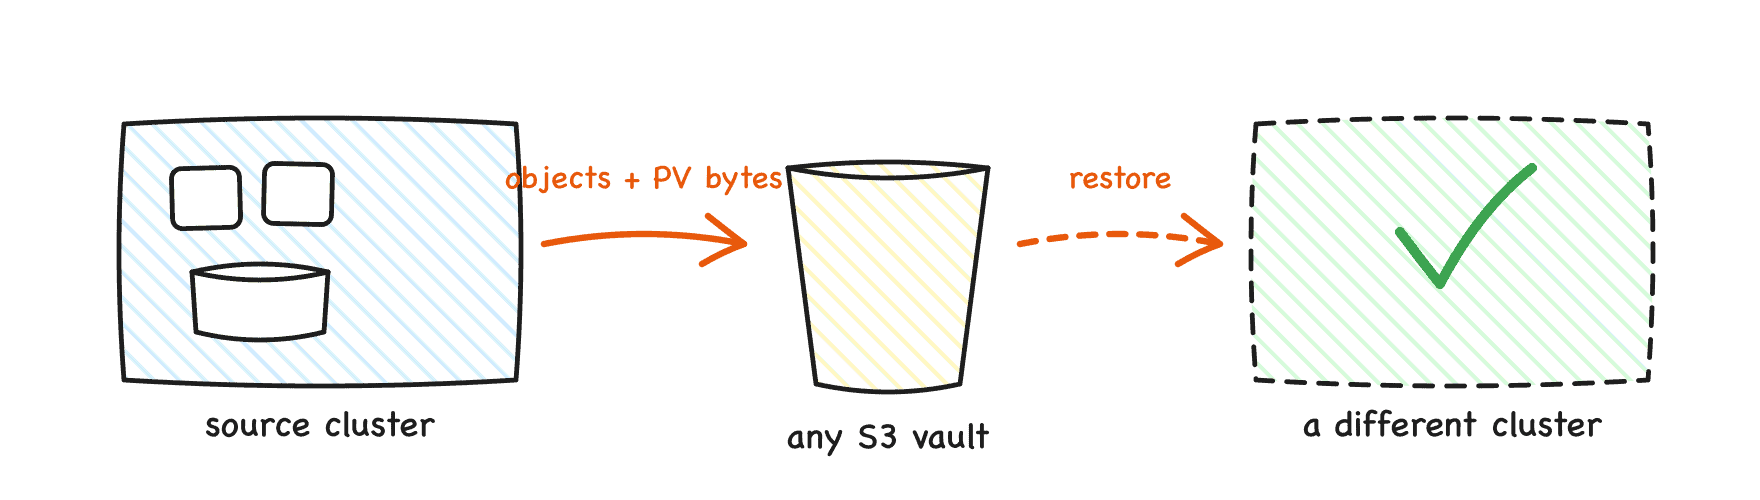
Backup tool moves objects and volume bytes to an S3 store
A Kubernetes backup has two distinct parts: the resource definitions (YAML) and the persistent volume data. Backup tools protect volume data through provider or CSI snapshots, file system backup, or snapshot data movement to an external store. The lab uses the last of these, with Velero and its data mover.
Most verification stops at the backup’s Completed status. Go one step further and confirm that volume bytes actually moved:
$ kubectl -n velero get datauploads -l velero.io/backup-name=$BACKUP \
    -o custom-columns='NAME:.metadata.name,PHASE:.status.phase,BYTES:.status.progress.bytesDone'
NAME                                       PHASE       BYTES
guestbook-rehearsal-20260727001126-q2j9m   Completed   47989888
This is the data mover confirming that 47,989,888 bytes of volume data left the cluster and landed in the external store. A backup tool that cannot report this number for a given backup deserves scrutiny.
Deleting the namespace, PVC included, and restoring from this backup returned the same four rows in about two minutes. That is the happy path, and it hides three things no backup tool does automatically:
Protecting volume data does not make a database backup application consistent. Flush or quiesce hooks must be configured when the application requires them.
Restoring onto different infrastructure may require storage class mappings and other transformations. Tools provide the mechanisms; each team must design and test them.
A backup phase of Completed means the backup operation completed. It does not prove the application will start, contain the expected data, or serve traffic. Only an end to end recovery test provides that evidence.
Boundary. Backup tools restore resources into a cluster that already exists. They do not create the cluster, the nodes, the network, the load balancers, or DNS. Something else must recover Kubernetes itself, and that something is infrastructure as code or Cluster API. A DR plan that starts with “restore the backup” must state what the backup gets restored into.
Scenario 2: declared state is not stored state
The GitOps trap: the controller rebuilds the declarations, the store holds the data
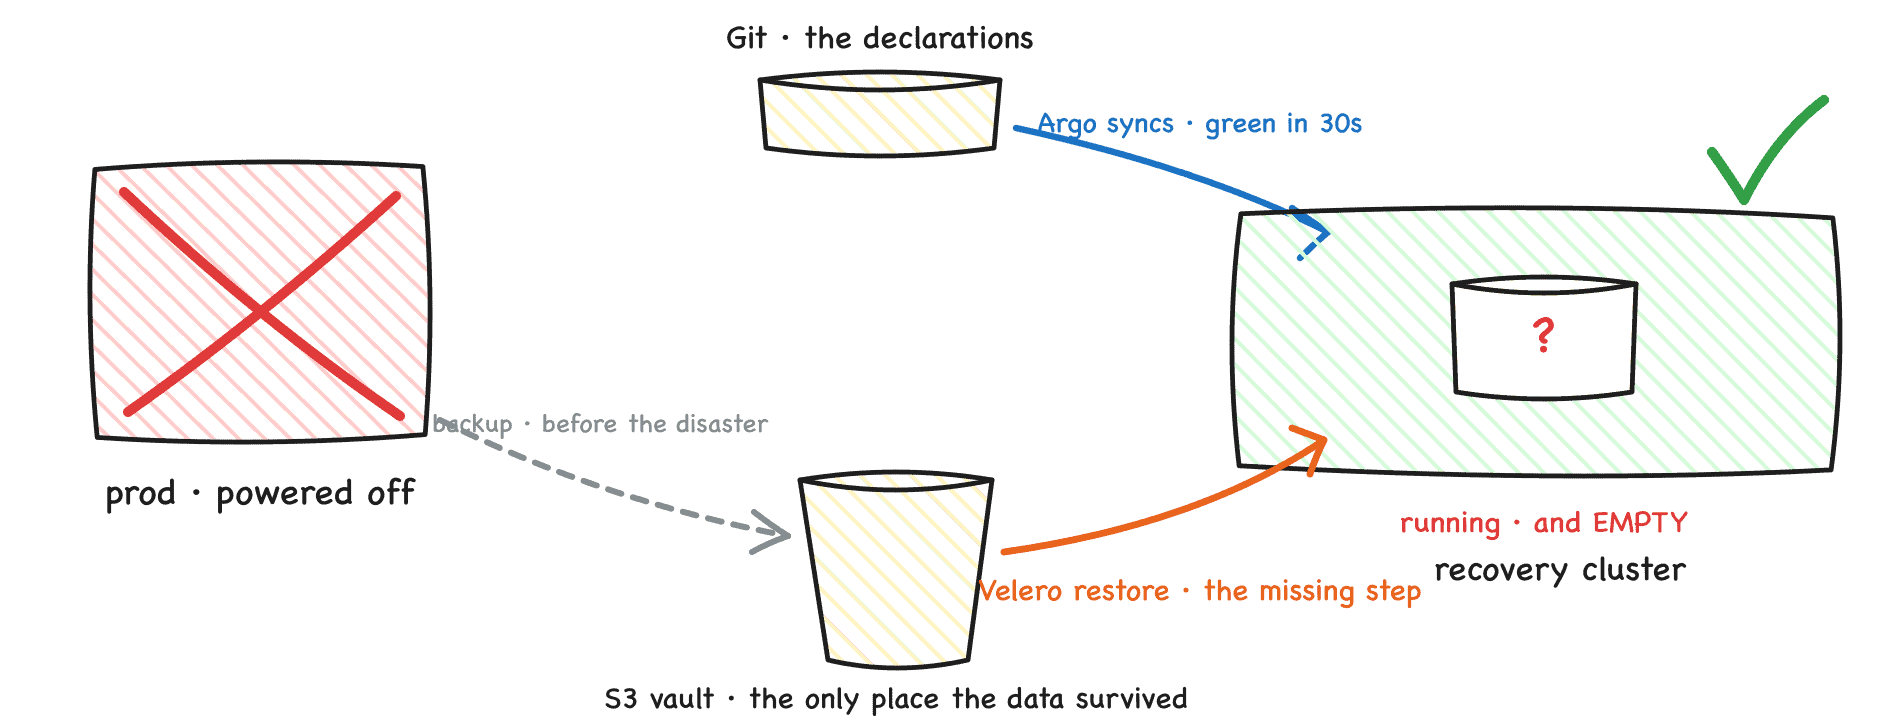
The production cluster is powered off. The recovery cluster, which existed before the disaster, has a GitOps controller pointed at Git and a backup tool pointed at the shared store. It has never run the application.
Syncing the application from Git succeeds: the sync reports Synced, the StatefulSet rolls out, the database pod is Running and Ready, every dashboard is green. Querying the database then returns:
ERROR: relation "attendees" does not exist
The database is running and it is empty. Nothing malfunctioned. Git only ever contained the declarations, so Kubernetes did exactly what the YAML says: create a StatefulSet, create a Service, and provision a brand new, empty volume for the PVC. GitOps reconstructed the declared state perfectly and restored none of the stored state.
Both tools are required because there are two different things to bring back and each tool carries exactly one of them: Git stores intent, and backups store state. In the lab, the recovery that produced validated data was:
Remove the empty application the sync created.
Restore the application, volumes included, from the backup store.
Validate the data against the expected contents.
The restore also crossed infrastructure: the backup was taken on one node runtime and restored onto another. A disaster may force recovery onto different infrastructure, so restore portability is something to test, not assume.
Measurement. In the lab, powering off production to validated data in the recovery cluster took four minutes live and just under two minutes in a rehearsed rerun. Both figures measure only the scripted slice; a production RTO wraps detection, decision, traffic cutover, and failback around it. The general lesson: the moment the dashboards turned green was not the recovery. The moment the data came back and was checked was.
Scenario 3: multi-volume consistency
Two snapshots from different moments tear the data
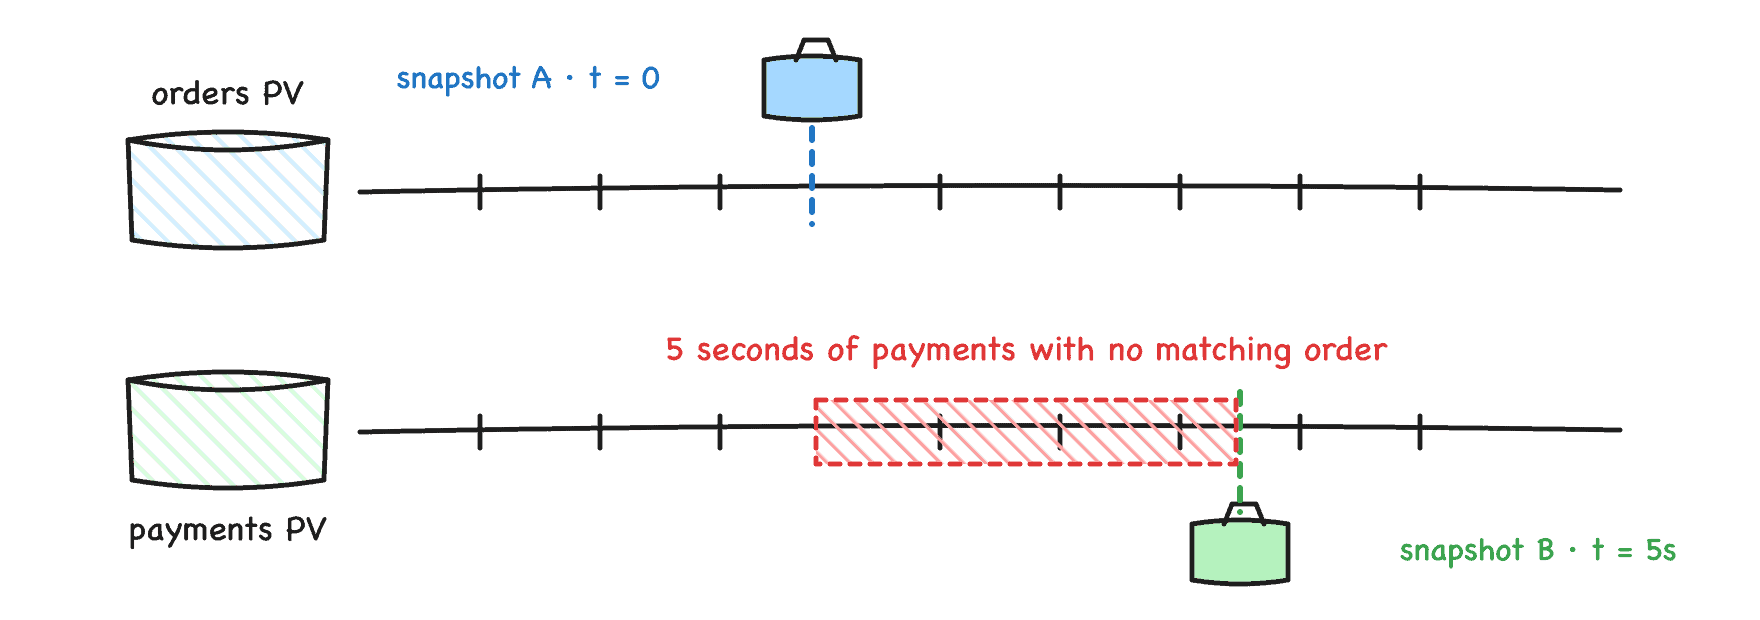
Real stateful applications span multiple volumes: database data plus WAL, message broker partitions, replica sets. The lab stand-in writes matched pairs, order n to one PVC and payment n to another, five times a second, with one invariant: every payment must have its order.
Snapshotting the two volumes individually, five seconds apart, produced two snapshots that were each ReadyToUse and individually perfect. Restoring both and comparing the last committed sequence numbers:
last order committed   : 108352
last payment committed : 108377
[FAIL] 25 payments have NO matching order.
[FAIL] Each snapshot succeeded. The restore is still wrong.
Twenty five payments reference orders that do not exist. No component failed, every operation reported success, and the combined recovery point describes a moment in time that never existed. In production, that five second gap is a backup tool walking a list of a hundred PVCs one by one.
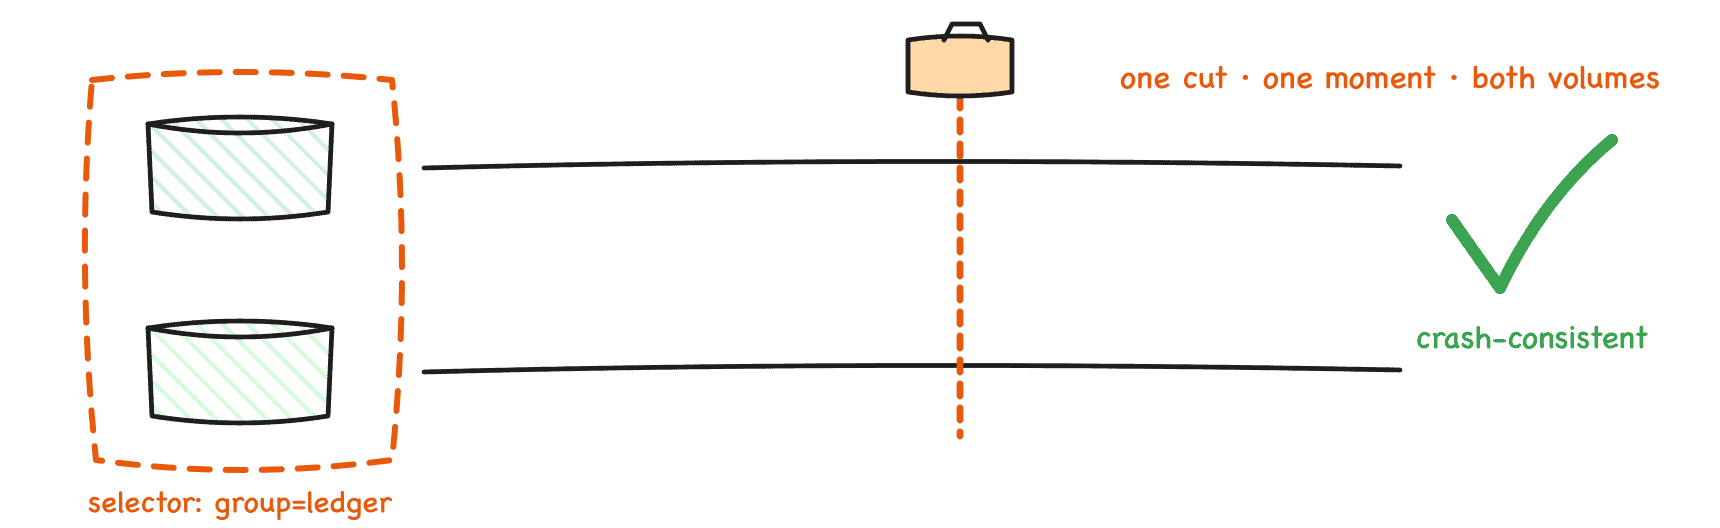
The API answer.VolumeGroupSnapshot reached GA in Kubernetes 1.36. One object selects PVCs by label, and the CSI driver receives one request for a coordinated, crash consistent recovery point across all of them:
One group snapshot cuts both volumes at the same moment
Restoring the group’s member snapshots and running the same verifier:
last order committed   : 109169
last payment committed : 109169
[OK] Every payment has a matching order. Restore is consistent.
Caveats that apply beyond the lab:
Support is driver specific. A driver that supports ordinary VolumeSnapshots proves nothing about group snapshots; the CSI group RPCs are a separate implementation. As of mid 2026, most of the major cloud drivers checked for the lab do not implement them.
Setup is explicit: the CRDs and feature gates on the snapshot controller and CSI sidecar must be enabled by the operator.
Crash consistent is not application consistent. The API removes cross volume timing skew; it does not flush or quiesce the database.
The lab uses the CSI hostpath test driver, which implements the group RPCs but archives member volumes sequentially, so the writer is paused during the group snapshot to keep the demo deterministic. The point in time guarantee itself belongs to the storage backend of a production driver.
Recovery testing guidance
A recovery test is not deleting a pod and watching it return; that tests workload reconciliation. A recovery test:
Restores a complete stateful application into a clean target that has never run it.
Validates the data and the user path against expected contents, not against resource status.
Measures the whole thing with a clock.
The principles that transfer from the lab to production as-is:
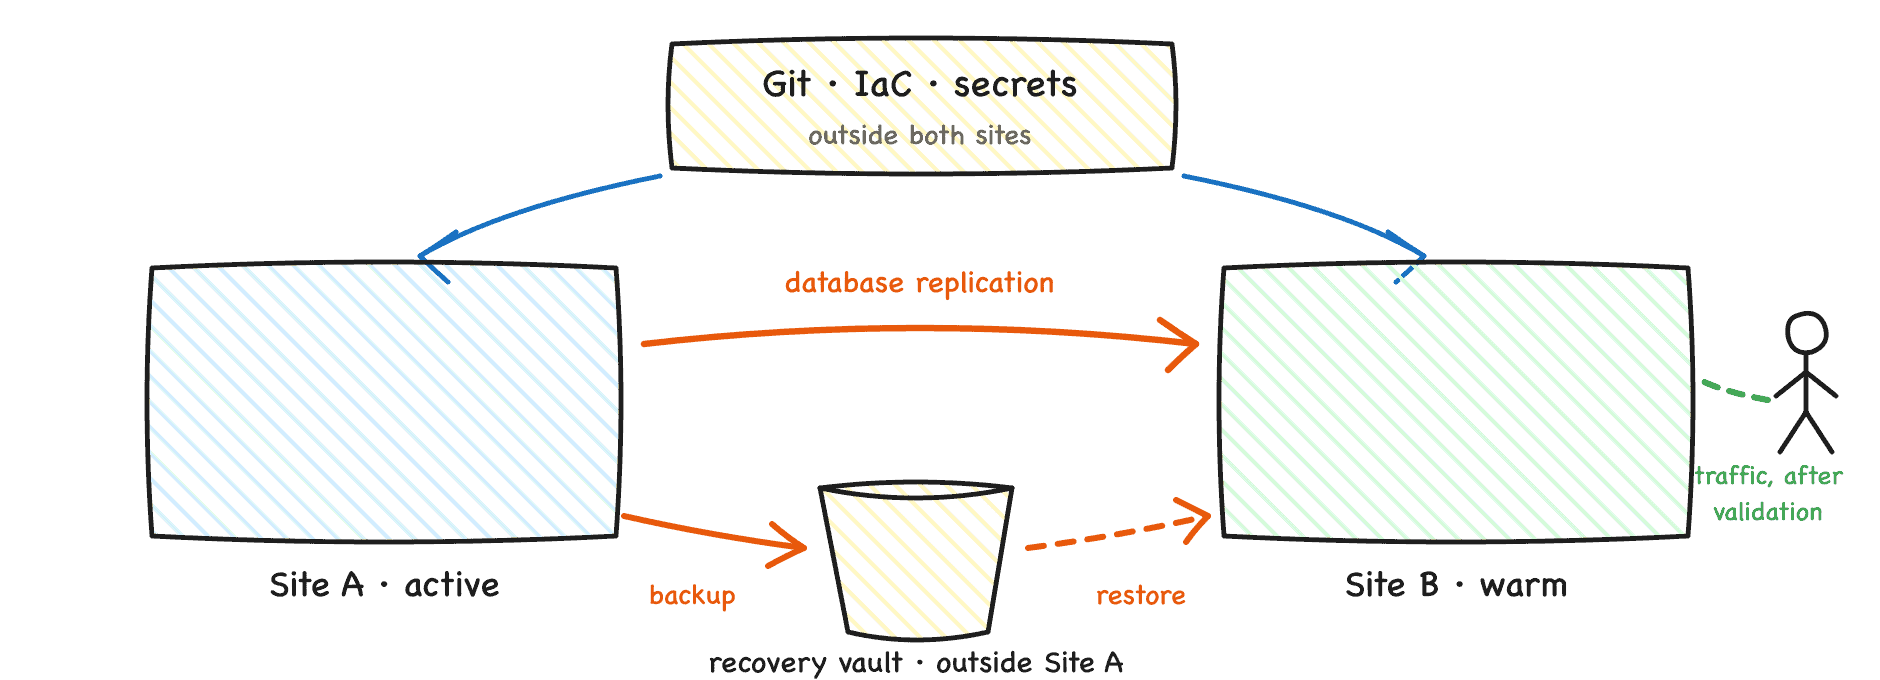
Two independent failure domains
Open gaps in the ecosystem
The scenarios expose gaps that no single tool closes today:
No common cross-cluster failover contract. Data, workload, cluster, traffic, and identity each have tools, and every row is missing the same thing: a shared contract with the next row. Products answer this inside their own APIs; core Kubernetes does not define the sequence.
No standard recovery unit for an application. Core Kubernetes has no maintained Application resource that says which objects, operators, data services, and external dependencies must recover together. Backup tools use namespaces and labels, GitOps controllers have their own application objects, package managers have releases, and each draws the boundary differently.
Backup success is treated as recovery proof. Backup completion metrics are widely monitored; restore rehearsal results rarely are.
How to contribute
The Cloud Native Business Continuity initiative under CNCF TAG Operational Resilience is an open proposal seeking contributors, aiming at a landscape gap analysis, updated backup and DR guidance, and reference architectures: https://github.com/cncf/toc/issues/1779
Access control belongs on the same day-zero checklist as networking and storage.
On most on-prem clusters, it never makes the list.
The Identity Gap
Managed cloud Kubernetes ships IAM or SSO integration out of the box. Self-hosted clusters don’t. Access defaults to a static client certificate or a long-lived token, issued once and rarely revisited. That certificate keeps working long after the person it was issued to has left, changed roles, or lost the device it lives on. Nothing in the cluster’s authentication path checks whether they should still have access. Revoking it means finding every copy of a file, and in practice, that doesn’t happen completely. The moment more than one or two people need different levels of access, managing that per person, per file, becomes its own ongoing job.
Put an identity provider (Keycloak or any OIDC-compliant provider) in front of the cluster instead. Access should follow an account and its group membership, not a certificate file. Configure it with a public OIDC client using PKCE, not a confidential client with a secret. Access changes become identity operations: add someone to a group, remove someone from a group. No file distribution required.
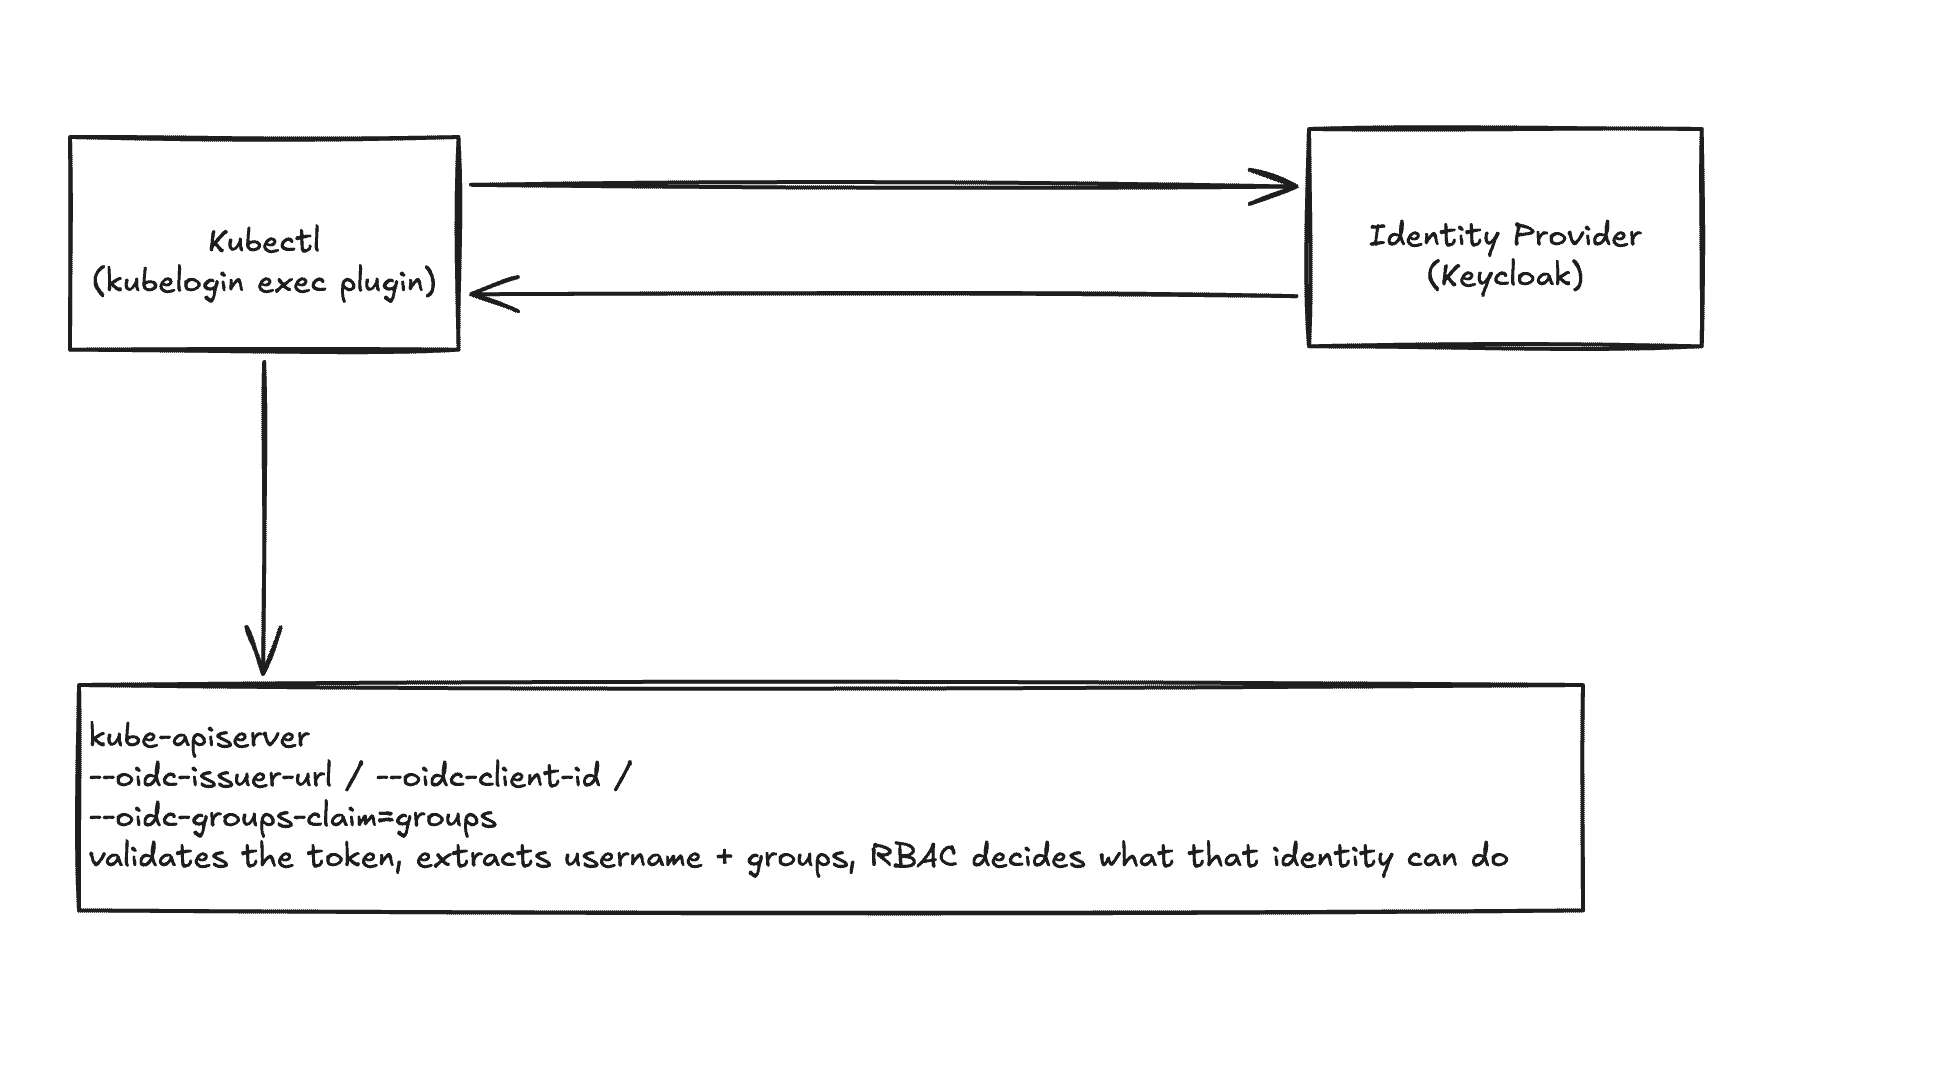
Architecture: three moving parts
The integration has three components that need to agree with each other:
kubectl, with the kubelogin exec plugin. Starts the login, gets a token from the identity provider, and attaches it to every API request.
The identity provider (Keycloak). Authenticates the user and issues an ID token carrying their username and group membership.
kube-apiserver, configured with --oidc-issuer-url, --oidc-client-id, and --oidc-groups-claim. Validates the token, extracts username and groups, and lets RBAC decide what that identity can do.
kubectl authenticates against the identity provider, then presents the resulting token to kube-apiserver, which validates it and hands it off to RBAC.
kubectl never talks to the API server first. A kubectl exec-credential plugin (kubelogin, also distributed as “kubectl oidc-login”) intercepts the request, drives the browser-based login against the IdP, and hands the resulting ID token back to kubectl as a bearer credential. The API server validates that token directly against the IdP’s public signing keys. It never needs network access to the IdP itself beyond fetching those keys once.
The client configuration decision that matters
Configure this client as public, not confidential. A confidential client issues a client secret, which then gets pasted into the kubelogin plugin config, and ships to every machine that needs cluster access.
A secret that has to be distributed to every client that uses it isn’t functioning as a secret. It’s a shared static credential with extra steps, and rotating it means a coordinated config push to every machine rather than disabling one compromised identity.
OAuth 2.1 already settles this for native and command-line applications. Make the client public. Issue no secret at all. Use PKCE (Proof Key for Code Exchange) instead, which stops anyone who intercepts the authorization code from redeeming it. PKCE works by having the client generate a random value locally, send a hash of it with the initial login request, then prove possession of the original value when exchanging the code for a token. An interceptor holding only the code can’t complete that proof.
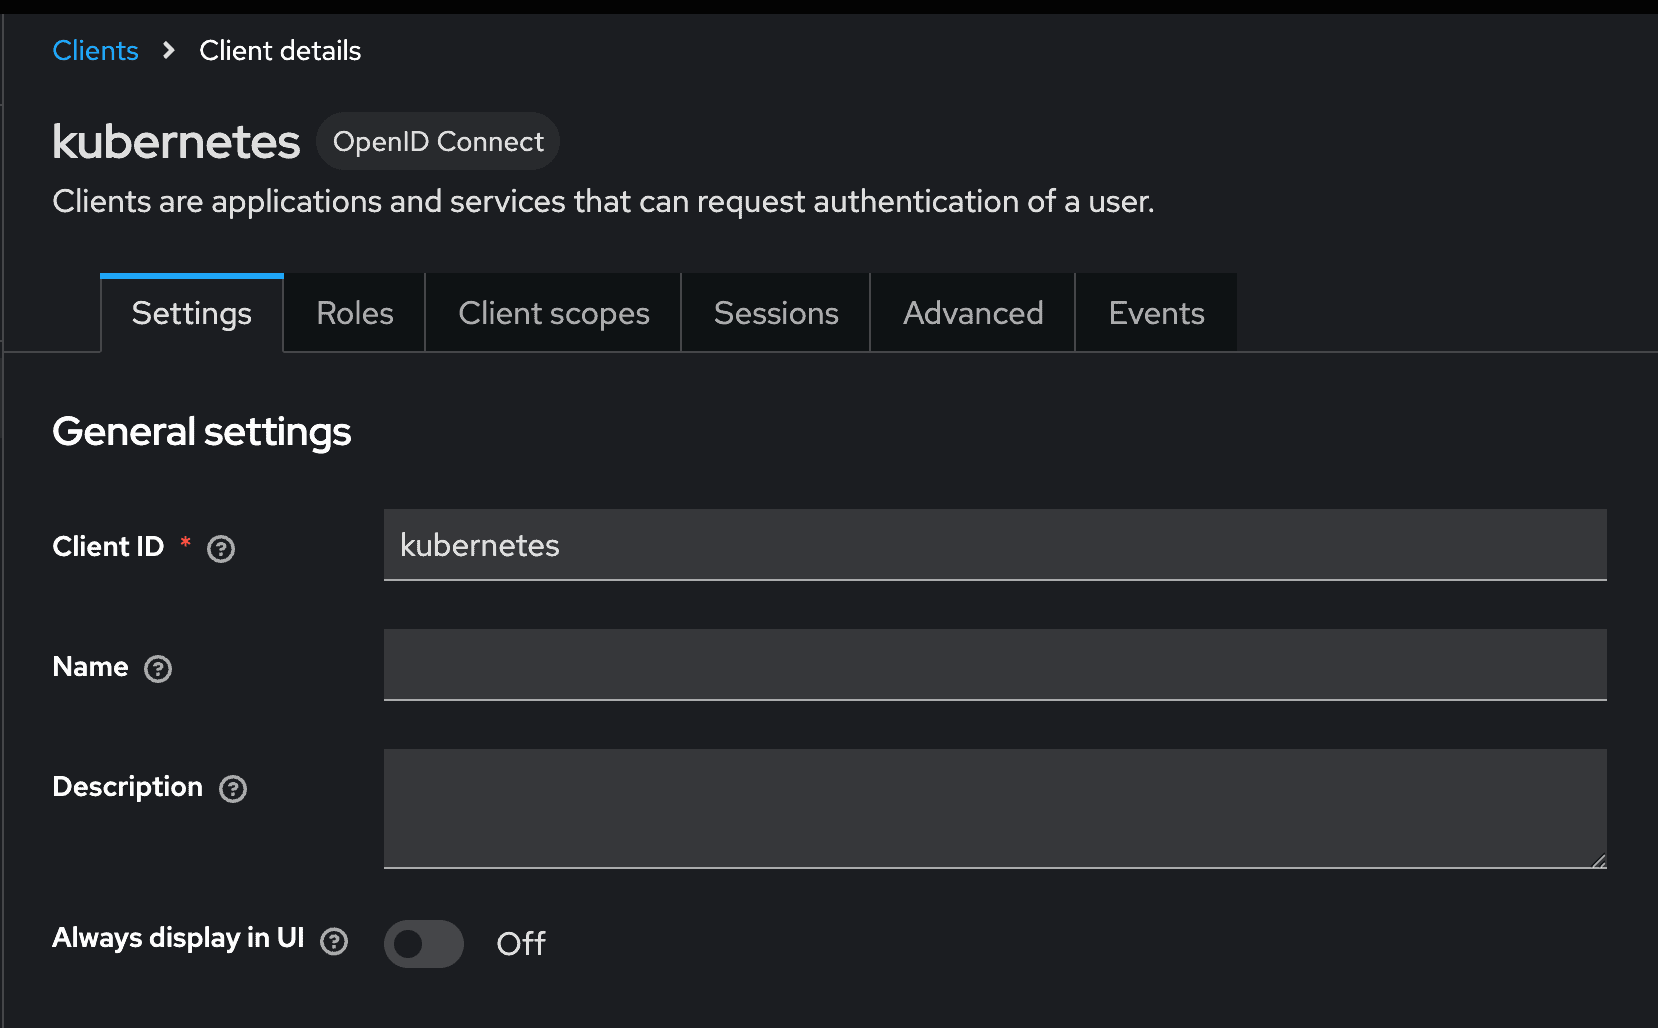
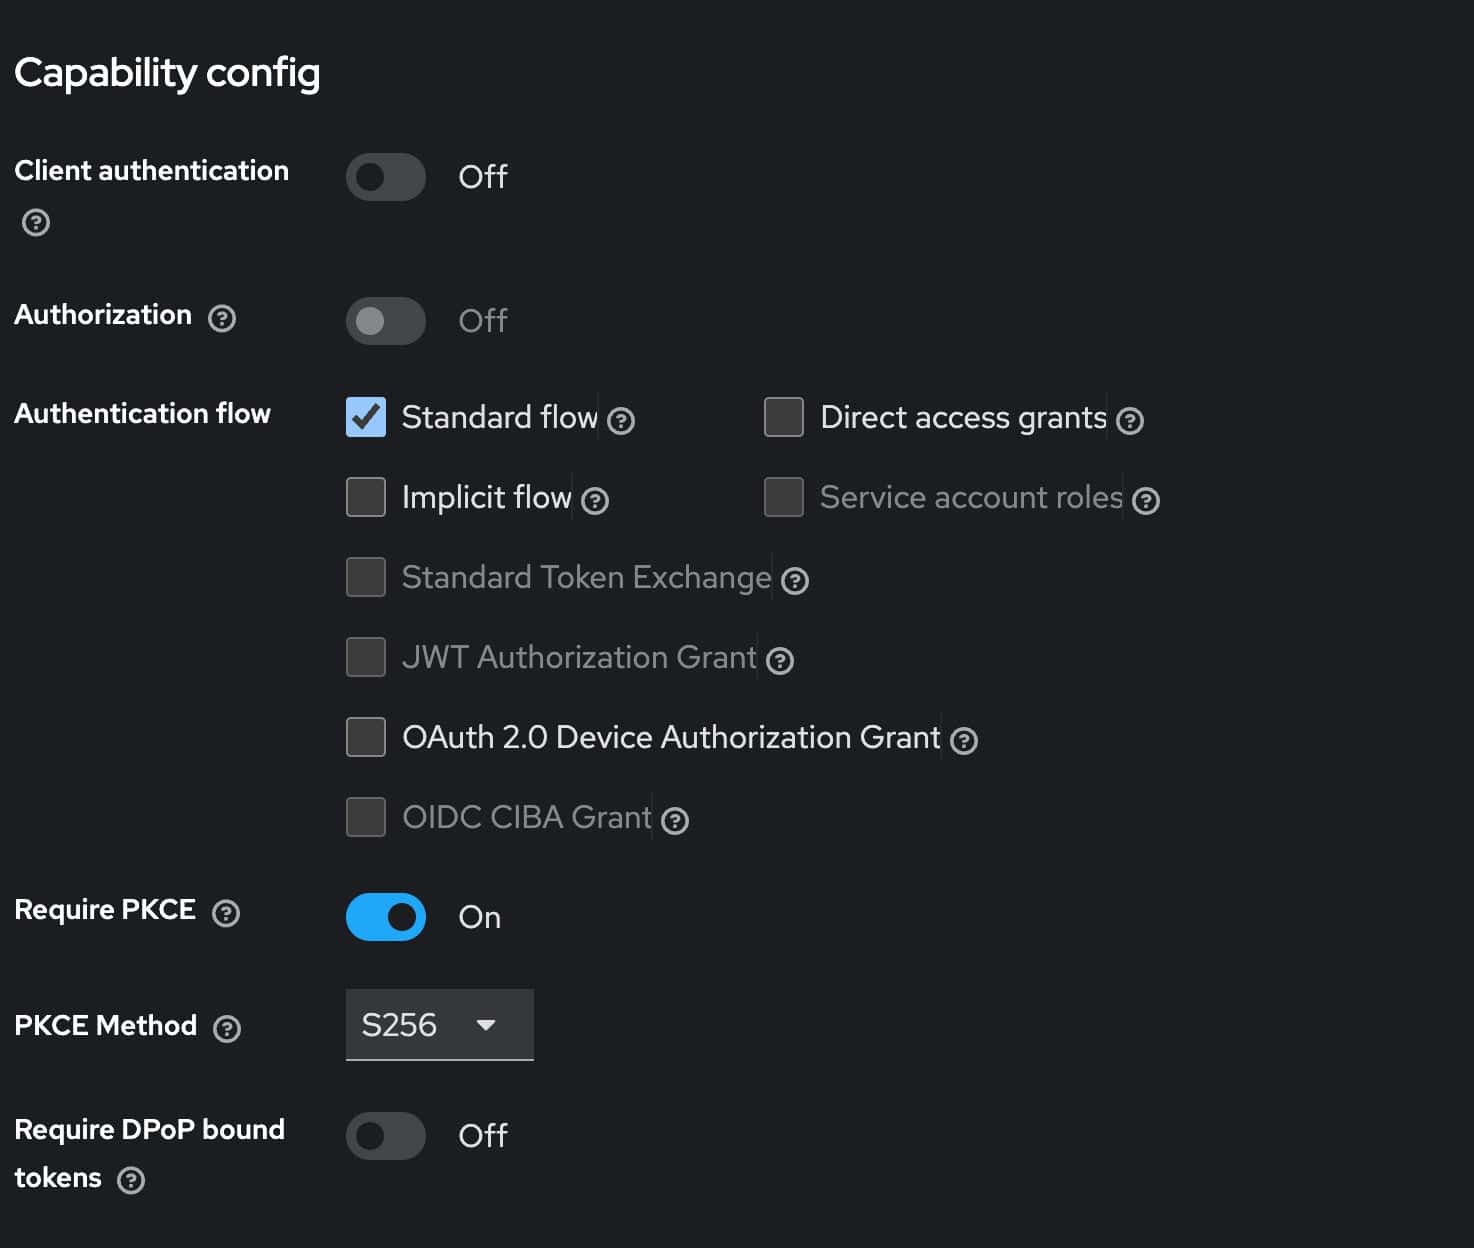
The client, in Keycloak’s admin console, ends up configured as:
Client ID: kubernetes
Client authentication: Off (public client, no secret issued)
Standard flow: On
Direct access grants: Off
Require PKCE: On, method S256
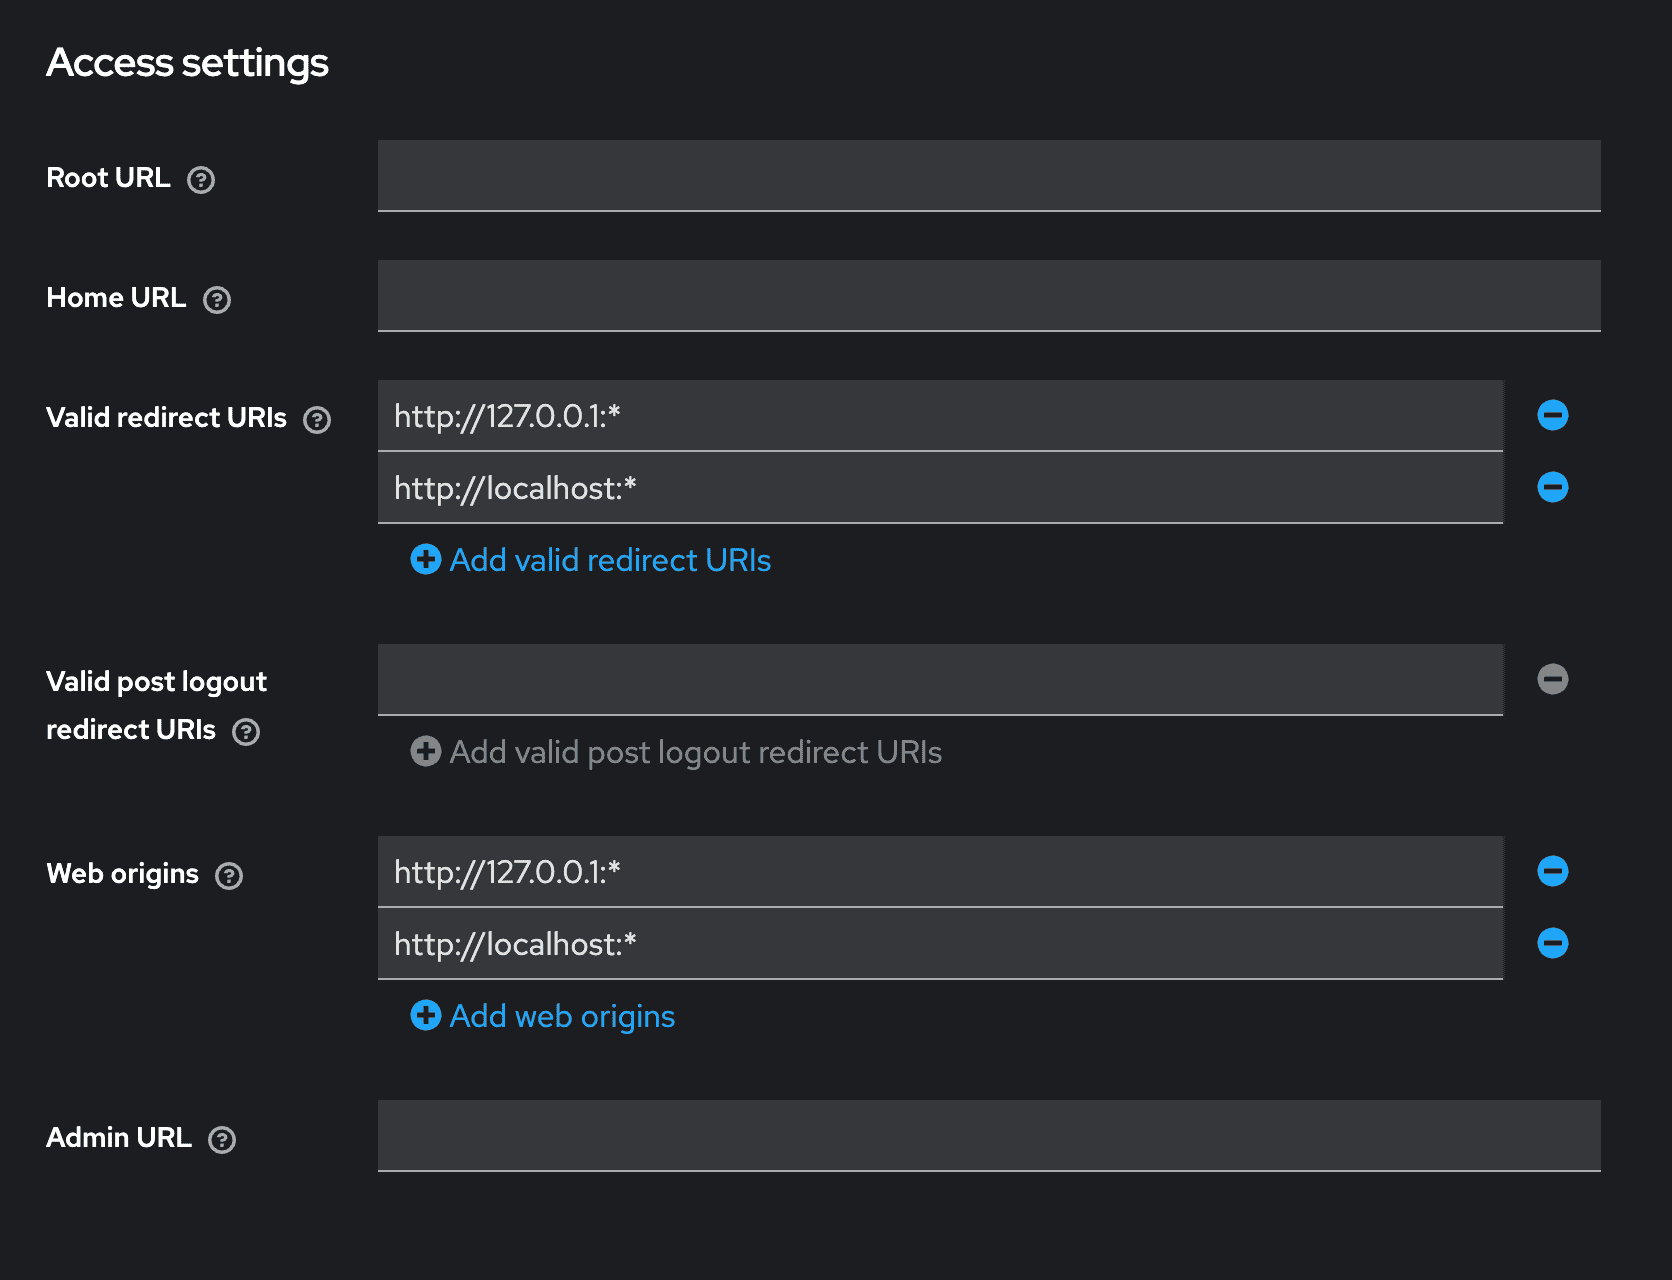
Valid redirect URIs: http://127.0.0.1:* and http://localhost:* (loopback only, nothing external)
Web origins: http://127.0.0.1:* and http://localhost:*
Client scopes: openid, profile, email, groups
General settings: the Kubernetes client, registered as OpenID Connect
Access settings: redirect URIs and web origins locked to loopback only
Capability config: Client authentication Off, Standard flow, Require PKCE On (S256)
Deployment walkthrough
1. Add the groups claim mapper
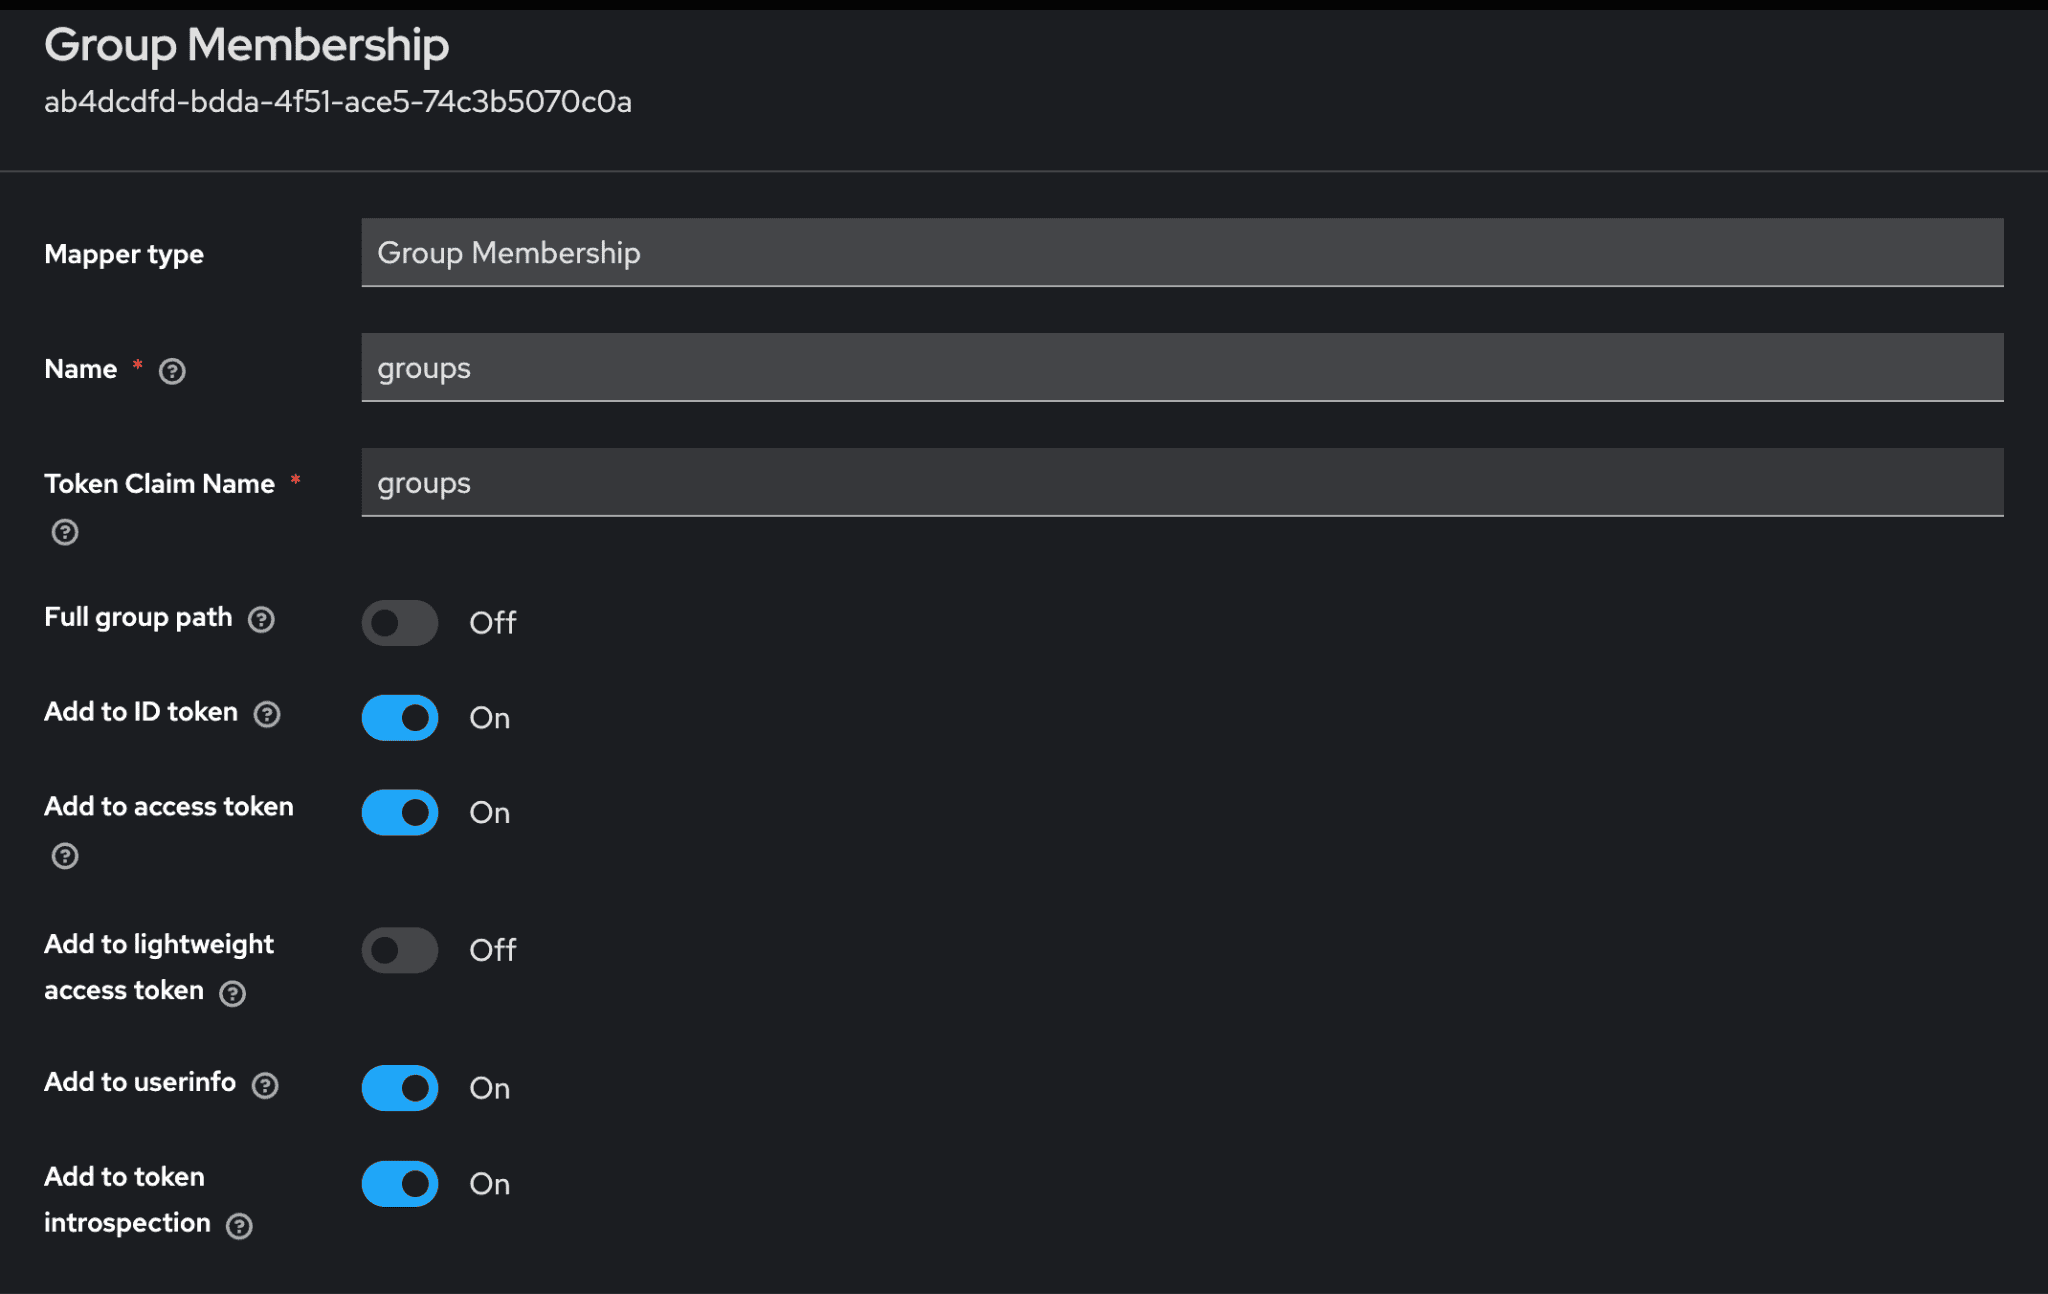
Kubernetes has no concept of “users” as a first-class object. RBAC binds to usernames and groups asserted by the token, so the IdP needs to actually put group membership into the ID token. “In Keycloak”is a protocol mapper on the client scope, of type Group Membership, mapped to the claim name groups.
Group Membership mapper on the realm-level ‘groups’ client scope: Token Claim Name ‘groups’, Add to ID token On
If Keycloak’s certificate isn’t signed by a publicly trusted CA (the common case for a self-hosted) on-prem identity provider, add one more flag pointing at that CA’s certificate:
--oidc-ca-file=/etc/kubernetes/pki/oidc-ca.crt
The API server needs to trust this connection to fetch the issuer’s signing keys. Without it, OIDC authentication fails with a TLS verification error that has nothing to do with the login flow itself, which makes it a confusing one to debug the first time you hit it.
3. Configure the kubectl side
kubeconfig gets an exec-credential entry instead of embedded certs or a static token:
Access changes now happen entirely in the IdP. Add someone to the platform-viewer group, and the next token they mint carries that group. The binding above applies immediately. No cluster-side change. No new kubeconfig to distribute.
Try it out
Using kubelogin as the exec plugin, a first login looks like this from the terminal:
$ kubectl get pods
 Opening in existing browser session.
 NAME                    	READY   STATUS    RESTARTS   AGE
 web-7f9c9c4d8-2xk9p     	1/1 	Running   0      	3d
The first call opens a browser window against the IdP; every call after that reuses the cached token until it expires, at which point kubelogin silently uses the refresh token to get a new one without another browser round-trip.
To confirm what identity and groups actually landed in the token:
$ kubectl auth whoami
ATTRIBUTE   VALUE
 Username	jane.doe@example.com
 Groups  	[platform-viewer system:authenticated]
The bottom line
None of this requires reworking how the cluster runs. It is a public OIDC client, one group membership mapper, a handful of RBAC bindings, and a kubectl plugin many engineers already have installed for other clusters. The setup cost is a single afternoon, not a platform migration.
What changes is what the cluster gets in return. Access follows group membership in the identity provider instead of a certificate file, so granting or revoking a level of access becomes a group change, not a search for every copy of a file across every laptop. There is a deeper benefit too. Kubernetes can log every request that hits its API server, but that audit trail is only as useful as the identity attached to each entry. A shared kubeconfig authenticating everyone as the same generic identity, often literally ‘cluster-admin’ means every audit log entry says the same thing no matter who actually ran the command. Federate identity through an OIDC provider instead, and every request the API server logs carries the person who actually made it. The audit trail stops being a list of anonymous actions and becomes an actual record of who did what, and it costs far less to set up than most teams assume.
Most platform engineering conversations tend to split into two rooms pretty quickly.
The first room is full of teams who don’t have a platform yet. Scattered scripts, tribal knowledge, and every team is doing the same task in a different way. The teams know something needs to change, but building a platform feels like a six-month project nobody has budgeted for.
The second room has already shipped a platform. There is a golden path, developer portal, a CLI and even AI agent in some cases. Adoption looks reasonable from the outset, but the platform team is still handling requests by hand, which becomes the bottleneck for anything outside the paved road, still wondering why “self-service” hasn’t actually reduced their workload.
These two might look like opposite problems, but they’re not. Both rooms are describing the same thing: they don’t know what the next stage of their platform interface looks like.
The first room thinks the answer is to build a platform. The second room believes the answer is to add more capabilities to the platform. Neither of them is wrong.
The right question isn’t “Do we have a platform?” It’s “How do developers actually interact with what we’ve built?” That gap between capabilities that exist and capabilities that are genuinely self-serviceable is an interface maturity problem.
In this post, we will look at the CNCF Platform Engineering Maturity Model that defines four stages of that journey. We will break down each stage but look specifically at interfaces and understand why most teams plateau at Stage 2 without realizing it, and what the path forward actually looks like.
Understanding The CNCF Platform Engineering Maturity Model
The CNCF Platform Engineering Maturity Model defines five aspects of platform engineering maturity: Investment, Adoption, Interfaces, Operations, and Measurement. Each is scored independently. An organization does not move through the model as a whole – it moves through each aspect on its own timeline, at its own pace.
Each aspect has four levels: Provisional, Operational, Scalable, and Optimizing. The model is a diagnostic framework that tells you where you are, but it does not tell you how to get to the next stage.
We’ll focus on one aspect of this maturity model – Interfaces. How developers actually interact with platform capabilities – the forms, the CLIs, the portals, the APIs – and why most teams stall at Level 2 without realizing it.
The Four Stages of Interfaces Maturity
The Interfaces aspect of the CNCF platform maturity model describes how developers interact with and consume platform capabilities. It has four levels where each one reflects how much the platform team still needs to be in the loop for things to happen.
Level 1: Custom Processes
Level 1 is custom processes, which consists of a collection of varying processes with no consistency of interface. Capabilities are provisioned through manual requests; knowledge is shared from person to person, and deep support from the capability provider is usually required to get anything done.
In practice, this is where most teams without a formal platform already live, whether they recognize it or not. The scripts, the runbooks, the “ask Jessica, she knows how to set up the database” culture. All of these constitute a Level 1 interface. The absence of a named platform does not mean the absence of a stage.
Level 2: Standard Tooling
The CNCF model describes Standard Tooling as consistent, standard interfaces for provisioning and observing capabilities. Golden paths and paved roads exist in some form. There are documentation and templates, so users can identify what is available and request it.
This is where most teams who have “built a platform” actually are. And it looks like success because adoption numbers improve, onboarding gets faster, and the metrics move in the right direction. However, everything outside the paved path still requires a human from the platform team to implement it. The interface is standardized but it is not self-sufficient.
Level 3: Self-Service Solutions
Level 3 is for self-service solutions, where there is genuine autonomy for users, requiring little support from maintainers. One-click provisioning for most of the asks where the platform team is not in the loop. Most of the routine tasks are great entry points to start the self-service journey.
The signal here is behavioral, not metric-based. Teams stop filing tickets for routine provisioning and start checking the internal platform first. Newly hired engineers ship their first meaningful change within days rather than weeks. The clearest confirmation comes from the backlog – organizations that reach Level 3 report exception requests drop by 40-60% after adding self-service configuration options. The platform team’s work shifts from actioning individual requests to improving the framework that handles them.
Level 4: Integrated Services
At level 4, integrated services, the platform capabilities are transparently integrated into the tools and processes teams already use. Some capabilities are provisioned automatically. The interface becomes invisible until you need to go deeper.
The sign that you are at level 4 of platform maturity is an absence of conversation. Developers stop thinking about infrastructure entirely because everything is bolted on the platform. When a new service is created, monitoring, logging, and security are integrated automatically – a developer doesn’t need to explicitly wrestle with these configurations. The security team defines policies that the platform enforces without a developer negotiating them. The observability team builds the capabilities which integrate automatically. The platform team’s success is measured by how rarely anyone mentions the platform.
Where Most Teams get Stuck
Self-service means a developer can get what they need without the platform team in the loop. Standard tooling means a developer can get what the platform team anticipated they would need, with the platform team standing by for everything else.
They might look and feel identical at level 2, but at scale, they diverge completely.
Based on interactions with organizations across industries, here’s why teams are stuck.
Queue problem
Golden paths cover the common cases that teams face. They do not cover the edge cases – and in any organization of meaningful size, edge cases are not edge cases. They are 30% of the work. Every request that falls outside the golden path lands on the platform team’s desk, increasing the backlog. The team that was supposed to reduce toil becomes the source of it.
At a discussion during a platform engineering round table, I spoke to a group that worked with a retail organization, they built a golden path for Kubernetes deployments using Helm charts and ArgoCD. Within six months, 85% of teams were using it. But the platform team’s backlog had grown from zero to 40 pending exception requests, and they were spending 60% of their time handling configurations that fell outside the golden path.
Expertise problem
Platform teams build capabilities for domains they generalize across organizations. A streaming pipeline built by a platform team without streaming expertise will work. It will not work as well as one built by the team that runs streaming workloads daily. The gap compounds over time. Specialized teams stop trusting the platform for specialized needs and building their own.
Another team that I spoke to had observed this with a financial services organization that had built a comprehensive internal developer platform with self-service infrastructure provisioning – documentation, office hours, extensive guides. Teams could follow the platform but they could not extend it. The interdependencies between Terraform modules, CI/CD pipelines, monitoring integrations, and service mesh configuration lived entirely in the platform team’s heads. Application teams had no mental model of how the components interacted. The gap compounded over time and teams started building their own capabilities.
Maintenance trap
Shipping capabilities is the easiest part. Maintaining them is the job nobody accounted for. Thirty capabilities shipped over two years means thirty capabilities to patch when a CVE drops, thirty things to test when Kubernetes upgrades, thirty surfaces where things can quietly break. The platform team that was hiring to build starts hiring to keep up with the patches and updates.
Working with an e-commerce organization, they had created shared Helm charts that abstracted Kubernetes complexity and accelerated deployments significantly. Eighteen months later, those charts had accumulated deprecated APIs, unused parameters, dependencies on specific cloud provider features, and hardcoded networking assumptions. The platform team was afraid to update them because every change required coordinated testing across dozens of applications. Application teams were afraid to customize because they would own the consequences. The golden path had become legacy code that everyone used and nobody wanted to touch.
Rigidity issue
Every golden path is built on assumptions about how work gets done. Those assumptions were accurate when the path was designed. With time, teams change, technologies change, processes change, and requirements shift. The golden path that removed friction at launch starts generating it when the organization outgrows the assumptions baked into it. Workarounds keep growing, and shadow infrastructure quietly appears until it breaks loudly.
At one of the KubeCon + CloudNativeCons, I spoke to a platform lead who had worked with a healthcare organization that standardized their Kubernetes, Istio, Prometheus, and ArgoCD deployments. The golden path assumed that stack entirely. When a team needed to deploy a legacy application that could not run in containers, or required a different database, or needed an alternative deployment pattern, the platform team built a custom exception. Then maintained it. Then built another one. The platform team became an exception factory, spending their time on one-off solutions rather than improving the core platform.
What connects these four scenarios is the same moment when the platform team realized the tools had scaled the requests without scaling the ability to handle them.
Moving past that requires a different kind of decision than the ones that got them here, and we’ll look into that transition in the next section.
The Transition: Moving Between Stages
The CNCF model is a diagnostic tool, not a prescription. It will tell you which level you are at. It will not tell you how to get to the next one. The path forward depends on what you have already built, how your organization is structured, and where the friction actually lives.
Here’s how you can climb the interface maturity ladder.
Level 1 to Level 2: Name it before you build it
The Level 1 team’s first mistake is usually building a developer portal before understanding what developers actually need. Portals are Level 3 infrastructure. At Level 1, priority is recognition before construction.
Name what already exists
Every Level 1 team has a platform – it is just unmanaged. The tribal knowledge bottleneck where one person’s absence stops work. Three teams are doing the same deployment in three different ways. The recurring Slack message is received by the same infrastructure engineer every time a database needs provisioning.
These are not gaps. They are your current interface. Mapping them – which requests are most common, which consumes the most time, which follow the same steps every time – tells you what your first golden path should be. Not what seems strategically important. The highest-volume, most repeatable, most painful manual process.
Build one thing and make it genuinely better
The principle that matters most here: a golden path is a documented, supported, opinionated way of doing one thing well. Start with one and make it genuinely better than the alternative to earn the trust before building the catalog. For a deeper exploration of golden path design and adoption patterns,read this guide to golden path implementation patterns that covers real implementation examples.
Level 2 to Level 3: Stop being the human in the loop
At Level 2, the team builds and operates capabilities. At Level 3, the team owns the interface through which capabilities are consumed while other people build and operate the capabilities within it.
That shift requires three concrete moves.
Decoupled Golden Paths
A golden path that can only be followed one way will always generate exceptions. The idea here is to parameterize it and give it escape hatches for legitimate edge cases.
We worked with a logistics organization that had a path hardcoding cloud regions, fixed resource limits, and assuming a specific service mesh. Any deviation meant waiting on the platform team. The fix was parameterization – validated options instead of hardcoded values, policy-based constraints instead of fixed limits. Teams went from waiting on every configuration change to self-servicing 80% of their needs within guardrails.
Instrument before you automate
The platform team’s first instinct is to automate what they understand best. The better signal is what actually arrives most often. We observed this with a media organization that spent three months logging every incoming request before building anything new. They found that 20% of request types drove 80% of the volume. They built self-service for those patterns first. Their backlog dropped 60% in six months. Build for the patterns that exist, not the ones you assume exist.
Treat Interface as Product
Treat the interface as the product. Not the capabilities behind it. How discoverable is it? How much does a developer need to know before they can use it successfully? How does it behave when a request falls outside what was anticipated?
We worked with a manufacturing organization where the platform team was building every deployment instance, each Helm chart, each environment config, each integration. They were falling behind. The change was not technical. They stopped building deployments and started owning the deployment interface, the schemas, the validation rules, the contracts. Application teams handled their own instances within those contracts. The platform team’s impact scaled because they were enabling rather than doing.
Level 3 to Level 4: Make the interface disappear
Moving from Level 3 to Level 4 requires a fundamental shift in thinking. At Level 3, developers are still conscious of the platform – they interact with it, configure it, and think about it. At Level 4, the platform becomes ambient infrastructure. The interface doesn’t disappear; it becomes so deeply integrated into the development workflow that developers rarely need to think about it explicitly.
This transition has three primary drivers.
Automate the common paths entirely
At Level 3, “self-service” still means a developer makes a choice and triggers a workflow. At Level 4, you anticipate those choices through convention and sensible defaults. When a new service is pushed to a repository, the platform detects it, validates it against policy, provisions monitoring, logging, and tracing automatically – a developer doesn’t fill out a form. The decision tree collapses into automation.
The shift is not about removing choice; it’s about encoding smart defaults with policy-enforced escape hatches. We worked with a fintech organization that reached Level 4 when they moved from “developers request a database” to “databases are provisioned alongside services using Terraform providers baked into the development workflow.” The interface was still there – developers could override defaults – but the common case required zero interaction.
Build platform capabilities into developer tools
The most effective Level 4 platforms are not separate experiences. They are integrated into the tools developers already use daily: Git, their IDE, their CI/CD system. When a pull request is opened, the platform automatically runs security checks, validates infrastructure assumptions, and flags potential production issues before human review. When a developer saves a Kubernetes manifest, their IDE knows about platform policies and prevents invalid configurations from being committed.
This requires the platform team to deeply understand the developer workflow and meet them where they work, not ask them to come to the platform.
Distribute capability ownership
At Level 3, the platform team still owns the framework. At Level 4, the framework is stable enough that capability ownership can be distributed. Observability teams own the observability capabilities within the platform interface. Security teams own the security policies. Database teams own database provisioning. The platform team shifts from operating every capability to operating the contracts and integration points between them.
This distribution works because the platform team has already established the interfaces, validation rules, and escape hatches. Domain experts can extend the platform within those boundaries without destabilizing it. We observed a SaaS organization structured this way see delivery times drop 40% once specialized teams could ship capabilities directly into production without platform team approval – because the platform contracts guaranteed safety.
The cultural shift
Level 4 requires organizational change as much as technical change. The platform team’s success metric inverts. Instead of “how many platforms did we build,” it becomes “how rarely do developers think about infrastructure.” Hiring shifts from generalists who build everything to specialists who own specific capability domains. Documentation shifts from “how to use the platform” to “what are the platform’s constraints and guarantees.”
The clearest sign you’ve reached Level 4 is when a new engineer onboards and ships production code within 48 hours without a single question about infrastructure. The platform is working so well that it’s invisible.
Conclusion
Most platform interfaces were designed with one actor in mind: a developer filling out a form, running a CLI command, or clicking through a portal. That assumption is starting to break.
AI agents are beginning to request platform capabilities the same way developers do – provisioning environments, spinning up pipelines, and requesting secrets. But they do not fill forms. They do not read documentation. They call APIs, and they call them at a frequency and pattern no human workflow was designed for. The self-service interface you built for your developers is not the same thing as a machine-consumable interface for agents. That gap is the next maturity conversation, and it is arriving faster than most platform teams have planned for.
If you want to understand where your platform’s Interfaces maturity sits today, the CNCF community self-assessment tool is a useful starting point.
Where on this line does your platform sit? Join the CNCF Platform Engineering Technical Community Group to discuss these maturity transitions with practitioners across the ecosystem and contribute to the ongoing development of platform engineering guidance.
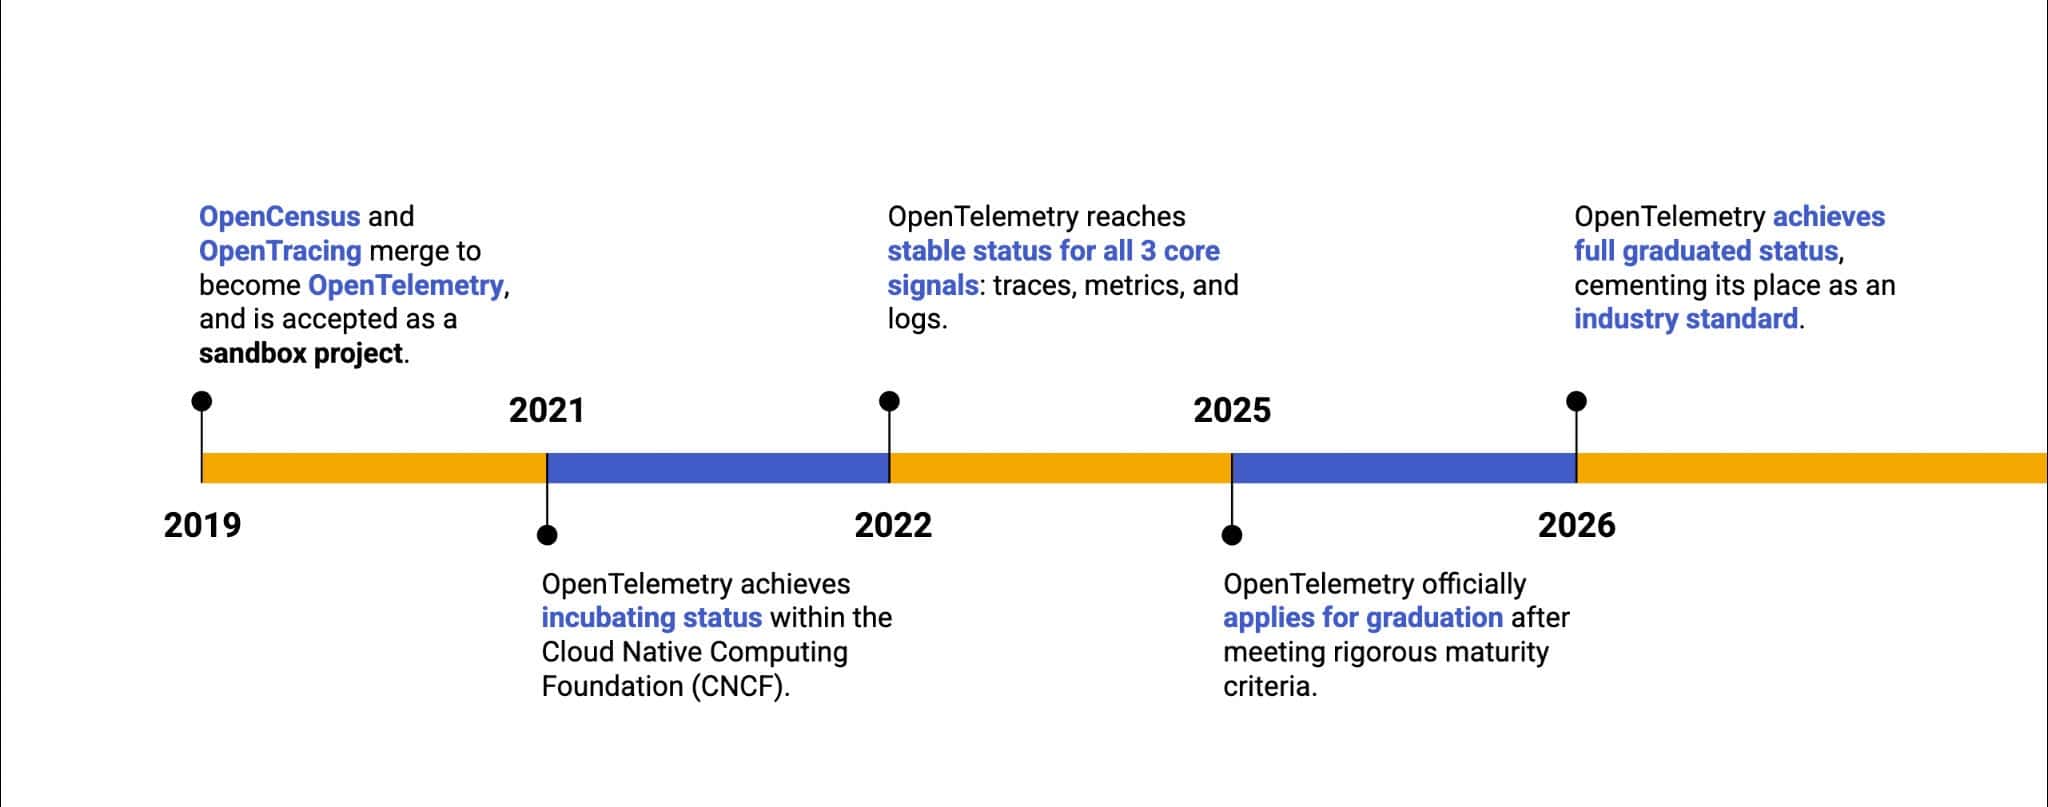
In case you missed it: OpenTelemetry (OTel) has officially achieved CNCF graduated status! It now stands proudly alongside amazing open source projects such as Kubernetes and Prometheus, to name just a few. It’s been a long journey, and we’re very excited… But, now what? To understand where we’re going, it’s important to understand where we came from.
History
In the not-so-distant past, telemetry signals were not standardized. This meant telemetry formats differed from tool to tool, with each telemetry vendor creating and maintaining its own instrumentation libraries. Vendor lock-in was a huge problem: If you wanted to switch vendors, you had to strip out the previous vendor’s libraries from your code and replace them with the new vendor’s libraries. As a result, switching vendors was a nontrivial task.
In addition, the three core telemetry signals – traces, logs, and metrics – were treated as separate, so there was no easy way to correlate them. Because of this, the observability story was incomplete.
Previous attempts had been made at standardization: the CNCF’s OpenTracing, and Google’s OpenCensus, forming the basis for what was to become OpenTelemetry.
In the interest of having a single standard, OpenCensus and OpenTracing were merged to form OpenTelemetry in May 2019. OpenTelemetry takes the best of both worlds, and then some, providing a tracing, metrics, and logs specification, a set of standardized APIs, and language specific implementations of these APIs, in addition to the Collector.
Both OpenCensus and OpenTracing are now officially archived. OpenTracing was archived in January 2022, and OpenCensus was archived in July 2023.
With the backing of all major observability vendors, and an active developer and end user community, OpenTelemetry became the de facto open standard for telemetry.
Since its inception, traces, logs, and metrics have reached general availability (GA). Profiling was added as a new OTel signal. The OpenTelemetry Demo has expanded. The OTel Collector has expanded, with new components being added regularly. We’ve seen the addition of new components to the OTel ecosystem to help make it more ergonomic, including OpAMP, the OTel Operator, OTel Weaver, and OTel Arrow.
This is a very impressive achievement, considering that OpenTelemetry is a mere seven years old. It sends a clear signal: OpenTelemetry is here to stay. And graduation helps to cement that.
Graduation!
OpenTelemetry achieved graduated status in May 2026, having started its path to graduation in 2025.
So what does it take to become a graduated CNCF project? Projects must fulfill the following criteria:
Robust governance. OTel has a documented governance model with clearly defined roles around election and retirement, along with transparent communication and decision-making.
Community health. OpenTelemetry has an established process for PR review and management. The project has a number of regular contributors across multiple organizations. Reviewers are responsive, ensuring that issues and fixes are addressed in a timely manner.
Security. OTel has undergone at least one independent security audit, and all critical issues identified have been remediated.
API stability. APIs are stable, properly versioned, and released at a regular cadence, with backwards compatibility ensured so as to not break existing implementations.
Documentation. OTel’s documentation provides an architectural overview, along with user, operator, and contribution guides.
As you can see, a lot of work was done behind the scenes by many dedicated folks, ranging from OTel maintainers, to end users, to CNCF TOC members to make this happen.
We’d like to give a huge shoutout to all in the OpenTelemetry community who made graduation happen, and especially to Austin Parker, OpenTelemetry Governance Committee member and former Community Manager, who led the graduation effort with the CNCF.
What this means for you
So what does OpenTelemetry graduation mean for you, dear reader?
For end users, this graduation signals that OTel is far from being an “emerging standard”. Its contributor health, security and quality standards, governance processes, and wide adoption have been evaluated to be at the level required by any enterprise, of any scale. So, if you’re in the 25% of skeptics not using OTel, there’s really no excuse anymore. There has never been a better time to adopt it!
In a nutshell: OpenTelemetry is production-ready, and fully open for business. If your organization was holding out on using OpenTelemetry, you have no more excuses!
What’s next?
Software is never really “done”, and the same goes for OpenTelemetry. It will continue to grow and evolve: from the specification to the API & SDK to the Collector, and beyond.
Looking ahead, we see a strong need for observability around new types of workloads, such as agentic workflows, an area covered by the emerging generative AI semantic conventions. We’re also tackling challenges in areas that we hadn’t focused on as much previously, such as browser and mobile observability.
More mature teams are looking for guidance on using OpenTelemetry at scale. That’s where tools like Weaver, which helps teams define and govern their telemetry schemas, come into play. We’re also making OTel easier to roll out by packaging components into installable modules through OpenTelemetry Packaging, and by enabling zero-code instrumentation with the OpenTelemetry Injector.
OpenTelemetry has a long future ahead of it, but we also know that it’s only possible through continued work by maintainers and contributors, and of course, through continued support and adoption by our end users.
We can’t wait for what the future has in store for us, and we’re excited to have you along for the ride.
An AI factory is not just a model or a cluster. It is a pool of GPUs that many teams draw from at once: one team fine-tuning, another serving inference, a third running evaluations, all on the same accelerators. NVIDIA frames it as “infrastructure for the full AI lifecycle, from data preparation through training, fine-tuning, and high-volume inference”. In an enterprise that means one fleet, many teams, and different quotas, policies, and trust boundaries layered on top. The hard question is no longer how to train a model. It is how to give every team safe, isolated access to the same expensive hardware without anyone stepping on anyone else.
Two years ago every platform team was building a developer platform. Kubernetes already had mature primitives for containers, RBAC, autoscaling, and policy. What it did not have was a clean answer for accelerators, or for keeping tenants apart on the same nodes. That is the gap an AI factory has to close, and the cloud native ecosystem now supplies most of the parts to close it.
The bottleneck is utilization, not model serving
Accelerators are the dominant capital expense in the building, and the metric that decides whether that spend pays off is utilization, not a peak tokens-per-second number from a single run. The market grades GPU clouds the same way. SemiAnalysis’s ClusterMAX scores providers on security, networking, storage, reliability, and support rather than raw throughput, and its security criteria reward hard per-tenant isolation, down to per-tenant Kubernetes clusters and DPU-based isolation, while flagging weak boundaries like putting many tenants on one cluster. The wrapper around the GPUs is what gets judged.
Two things keep utilization low. First, the resource model: in the traditional device-plugin model a pod asks for nvidia.com/gpu: 1 and pins a whole accelerator even at ten percent use. Dynamic Resource Allocation (DRA), GA in Kubernetes 1.34, lets the scheduler treat accelerators as rich devices with attributes, memory, and topology, though it does not by itself carve a GPU into fractions; density comes from the device layer underneath. Second, the isolation model: to keep teams apart, platforms default to a dedicated cluster or a dedicated set of GPUs per team, which is the safe choice when trust is strict and wastes most of the hardware.
The same pattern recurs in the field: operators managing tenants with a bare metal provisioner and manual workarounds, or handing each customer a dedicated block of GPUs and turning away demand they cannot isolate cleanly. The fix is not a new model server. It is a stack that allocates accelerators so capacity is neither stranded nor unsafe, and isolates tenants so packing them together holds up.
The stack, layer by layer
An AI factory is an assembly problem. Most layers are Kubernetes native or CNCF projects, with a few OSS tools such as NVIDIA’s MIG, vCluster and Dynamo. The diagram below shows the shape, and the table lists the job each layer does.
Keycloak (OIDC), ResourceQuota / Kueue, Kyverno or OPA
Secrets and security
Secrets, runtime, supply chain
OpenBao + External Secrets, Falco, Trivy
Reliability and remediation
Detect and recover from node failures
DCGM health checks, Node Problem Detector, drain / cordon
Self-service and billing
Provision and charge tenants
API / OpenTofu / GitOps, OpenCost, DCGM GPU-seconds
From bare metal to validated capacity
Everything starts at the rack.
Take a typical modern AI supercomputing platform as an example. Before any GPU can run a workload, something has to turn raw servers into a usable pool. That is the provisioning layer, often a proprietary hardware manager that ships with the system.
It works in steps. First it discovers each node, taking inventory: which GPUs and how many, whether memory is healthy (ECC state, meaning error-correction is on and not logging faults), and the identities of the network cards (InfiniBand GUIDs and NIC MACs, the permanent hardware IDs used to wire up and boot the node). Next it network boots the node and installs an OS image with the GPU driver and the CUDA and NCCL libraries baked in, so it can compute the moment it comes up. It then applies BIOS settings that match the node’s goal: baseline, performance, or confidential-compute.
Before a node joins the pool, it is tested. This burn-in runs the node under load to catch early failures, and an NCCL test confirms the GPUs actually talk to each other at full bandwidth. The result is written to a source of truth like NetBox, which also tracks IP address assignments (IPAM). Retiring a node runs the flow in reverse: wipe the disks, reset the remote-management login (eg the BMC), and return the clean node to the pool.
That proprietary manager is the vendor’s all-in-one take on this layer, tightly coupled to its own systems. The other path is to assemble the same loop from open building blocks: Metal3 driving Ironic, or a solution like vMetal, giving you the same discover, image, validate, and reclaim cycle on your own terms instead of adopting the vendor’s stack wholesale. That is the build-versus-assemble choice, and it recurs at every layer above. I come back to it at the end.
GPU allocation: the layer that makes the economics work
Figure 1. Whole-GPU allocation versus a partitioned GPU.
DRA gives a richer device-claim model, but fractional density comes from the device implementation. HAMi, a CNCF Incubating project, enforces per-pod memory and compute limits in software so several pods run on one card with guardrails between them, and it spans multiple accelerator vendors
Operators heading toward confidential computing do not place untrusted tenants on the same physical GPU; they give each tenant a whole GPU and reserve partitioning for workloads inside a single trust domain. MIG does isolate memory and faults in hardware, but its use as a boundary between hostile tenants is contested, so the conservative default is whole-GPU per tenant. The layer has two jobs: whole-GPU allocation for tenant isolation, and partitioning for density within a tenant. Scheduling is separate: KAI Scheduler and Volcano handle gang and topology-aware placement, and Kueue handles queueing, admission, and quota.
The workload layers: serving, Slurm, and VMs
Above allocation sit the things teams actually run. For inference, vLLM is a common engine and KServe, a CNCF incubating project, wraps it with autoscaling and standard endpoints, while NVIDIA Dynamo and llm-d push disaggregated inference for larger deployments. In front, Gateway API handles routing and LiteLLM adds an OpenAI-compatible gateway so dozens of specialized models speak one API.
Training customers usually live in Slurm, and the pattern has converged on running it on Kubernetes through SchedMD’s Slinky, which represents the Slurm daemons as CRDs and integrates with the GPU Operator and DRA for topology-aware scheduling, with pyxis and enroot, GPUDirect RDMA at full NCCL bandwidth, and prolog and epilog health checks. And some tenants want plain virtual machines rather than pods; KubeVirt runs VMs as Kubernetes workloads, so one platform hands out both containers and VMs from the same pooled fleet under the same RBAC and quotas.
Networking, storage, and observability
Training and disaggregated inference are bandwidth-bound, so the network is part of the design. Cilium handles the primary CNI and network policy; for the fast path, Multus and SR-IOV expose the NIC directly and RDMA over RoCEv2 or InfiniBand carries inter-node GPU traffic, with the isolation layer kept off that data path.
A real cloud also gives tenants the cloud-edge services they expect: elastic IPs, NAT, and L4 load balancing from a gateway in front of the fabric. Storage needs per-tenant persistence, usually CSI with Rook and Ceph or a parallel filesystem, governed by per-tenant StorageClasses and quotas.
For observability, OpenTelemetry is the neutral collection layer that keeps backends swappable, with Prometheus for metrics and VictoriaLogs for logs; the DCGM exporter publishes GPU telemetry that becomes per-tenant only with labels and a cost pipeline, and OpenCost turns GPU-seconds into chargeback.
Reliability and security
At fleet scale GPUs fail constantly: ECC errors, cards that fall off the bus, NVLink and thermal faults. The operator’s job is to catch these before a tenant does, which makes health a first-class layer rather than a dashboard afterthought.
Active and passive checks on DCGM watch for degradation, Node Problem Detector turns hardware signals into node conditions, and a remediation loop cordons and drains a suspect node before new work lands on it. This is one of the categories the rating systems weigh most, because reliability, not peak throughput, is what a customer feels first. Identity and policy round it out: Keycloak over OIDC, OpenBao with the External Secrets Operator, Kyverno or OPA for guardrails, and Falco and Trivy for runtime and supply chain, with audit logs exported to the observability stack and traffic encrypted in transit.
Isolating tenants
Every layer above assumes one thing: that you can safely run more than one team on the same hardware. That is the tenant-isolation problem, and it has two halves worth keeping separate.
The first is the control plane. The tenant-cluster pattern gives each team a virtual control plane: a full Kubernetes API server with its own CRDs, admission webhooks, versions, and RBAC, running as a workload on a single underlying cluster, with no view into another tenant. Several CNCF and open source projects implement this pattern, like vCluster. Because each tenant cluster is conformant Kubernetes, plain kubectl, Helm, and Argo CD with no proprietary extensions, the model gives tenants a clean exit path rather than lock-in.
Figure 2. Tenant clusters on one underlying cluster, drawing from a pooled GPU fleet.
In practice operators run two tiers. High-trust or enterprise tenants get a dedicated cluster, sometimes dedicated hardware, where the boundary is physical; smaller or cost-sensitive tenants get a tenant cluster on pooled capacity. The same control plane drives both. Reliability follows from the same design: because a tenant control plane runs as pods, Kubernetes reschedules it on failure, and the open question is blast radius, so operators cap how many tenants ride one underlying cluster.
The second half is the data plane, which a tenant cluster does not solve on its own. You still need network isolation, storage isolation, quotas, Pod Security, and a runtime boundary. Network isolation usually comes from the fabric rather than from Kubernetes: a control plane carves per-tenant VPCs with VXLAN and EVPN on the Ethernet side and partition keys on InfiniBand. Increasingly that enforcement is pushed into hardware, where DPUs (Data Processing Units) such as NVIDIA BlueField or AMD Pensando move isolation and encryption off the host CPU, which is also how operators reach a confidential computing posture.
For the runtime boundary on shared nodes, the options range from dedicated nodes to sandboxed runtimes such as vNode. The bar for a real cloud is hardware-enforced isolation, not namespaces and good intentions.
What makes it a cloud, not just infrastructure
The line between a pile of GPUs and a cloud is that a customer can provision it themselves and get a bill that makes sense. Both are cloud native problems. Self-service means API-first with no UI-only paths: a tenant creates and deletes clusters through an API, a Terraform provider, or GitOps, with resources expressed as declarative CRDs reconciled by Flux or Argo CD, and access scoped by RBAC through OIDC.
The bill comes from the metering layer: DCGM-driven GPU-seconds and OpenCost allocation, exported per tenant. None of this is glamorous, and it is usually the widest gap between a lab and a product. It is also, more than raw performance, what customers experience day to day.
From demo to production
Put the stack together and the demo is simple: two teams, two tenant clusters, two model endpoints, one physical GPU partitioned by MIG or software limits, each with its own RBAC, network policy, metrics, and cost line, neither aware of the other. This has been shown live on stage at KubeCon + CloudNativeCon with a single modern GPU serving two models at once.
Two things turn it into production. The first is conformance: tooling like NVIDIA’s AI Cluster Runtime validates cluster configurations against the hardware you actually have and emits reproducible Helm or GitOps artifacts, and the Kubernetes AI Conformance program, introduced in the 1.35 release, pushes the same idea at the platform level.
The second is scale: the design has to hold at hundreds of GPU nodes and several data centers, not the handful you prove it on, which is the real reason the foundation is GitOps, declarative tenants, and a single source of truth. There is a strategic choice here too, because the hardware vendor is moving into this layer with an integrated suite, NVIDIA’s DSX OS, so an operator decides layer by layer whether to adopt it, assemble the equivalent from cloud native projects, or compose the two.
The Takeaway
An AI factory is not another AI platform or model serving product. It is an operating model for running GPU infrastructure at scale on Kubernetes. Just as Kubernetes became the operating system for cloud native applications, it is becoming the foundation for AI infrastructure, making GPUs schedulable resources, providing isolated environments for tenants, and enabling on demand compute. The challenge is not deploying technologies like MIG, DRA, HAMi, or vLLM, but combining them into a platform that balances utilization, isolation, and cost while allowing multiple teams to safely share expensive GPU infrastructure without compromising performance or security.
Software is only half of it. The hardware layer is just as hard, often harder. Topology decides performance: which GPUs share an NVLink or NVSwitch domain, how each node attaches to a rail-optimized InfiniBand or RoCE fabric, whether the GPU, NIC, and CPU sit on the same NUMA node, and whether GPUDirect RDMA has a clean path. Schedule work without accounting for any of it and collective operations stall on the slowest hop, no matter how healthy the platform looks on paper. The stack has to be topology-aware, not just resource-aware.
The hard part is not naming the tools. It is making density, isolation, and chargeback work together, with hardware-enforced boundaries where the trust model demands them, without hiding the GPU data path behind an abstraction.
It’s no secret that developers are increasingly being asked to shift left. It seems there’s always something new to shift left on. And now developers are being asked to shift left on observability. This means that in addition to all the other things developers must do, they must also take the extra step of instrumenting their application code with OpenTelemetry, to help make it observable.
This seems needless. It’s extra work. Why should developers care about observability? After all, isn’t observability the domain of SREs? Additionally, what’s the point of adding instrumentation to application code if it only seems to benefit SREs?
What’s in it for developers?
How does observability help developers?
If you’re being asked to instrument code, you may be thinking: how much extra time will this add to my workload? After all, application instrumentation involves adding traces, logs, and metrics to your code, making it more observable. This means more code to maintain, introducing complexity, bugs, and technical debt.
While that’s true, let’s look at how observability benefits developers.
1. It reduces debug time
Nobody loves spending hours and hours trying to chase down a nasty bug.
2. It accelerates development and deployment
Faster debugging means that developers can finish working on a feature faster and ship it faster.
3. It improves your code
Instrumenting code can expose slow paths, hidden retries, and weird edge cases which can be addressed before the code ever hits production.
4. It helps us understand distributed systems
Micro services are everywhere, and working with them means dealing with many moving parts, with often unpredictable behavior. Observability helps developers understand exactly what’s going on within and between services.
5. It helps us make sense of vibecoded applications
Like it or not, AI is being used for software development, and the quality of the code it produces varies (translation: some of it is utter crap). Making code observable helps untangle the web of not-so-great code.
Understanding how observability helps developers is the first step. Next comes instrumentation, the process of translating interesting things into telemetry signals.
Instrumentation pain points
Developers are lazy by nature, and that’s a good thing. That’s what drives them to automate things and come up with innovative solutions to gnarly problems. But with so many things on developers’ plates already, they simply don’t want to deal with the extra work and overhead of instrumenting application code.
We spoke with a few developers to get some of their thoughts on instrumentation, and they shared some of their pain points with us.
Pain point #1
“Dependent on the efforts of that specific SDK’s community”
Each language supported by OpenTelemetry has its own Special Interest Group (SIG) tied to the development of language-specific APIs and SDKs. Java folks work on Java APIs and SDKs. Python folks work on Python APIs and SDKs, and so on. Some SIGs have more contributors than others. Some individuals can dedicate more time to the project than others. Additionally, the amount of time taken to address an issue varies by SIG.
Pain point #2
“If there is no auto-instrumentation, developers have a hard time manually instrumenting”
OpenTelemetry offers zero-code (auto) instrumentation for some languages. Languages like Rust and Elixir, on the other hand, don’t have zero-code instrumentation support, making it more daunting for instrumenting, as developers have to start from scratch. We’ll talk more about zero-code instrumentation later.
Pain point #3
“Too many options in instrumenting: SDKs, eBPF, compile-time. Also these projects are not mature enough.”
The OpenTelemetry ecosystem is very large and has many moving parts. Also, not all parts move at the same rate. This makes it challenging for developers to keep up.
Pain point #4
“Public API stability, upgrading project dependency is painful, instrumentation is too verbose, metrics cardinality is a big problem for the high cardinality attributes”
OpenTelemetry has definitely experienced some growing pains over the years. There are challenges around project dependencies, and getting started with instrumentation from scratch.
There’s good news!
But it’s not all doom and gloom. Challenges aside, OpenTelemetry has two major strengths. The first is its flexibility. OpenTelemetry is highly customizable and extensible, helping to make it future proof.
OpenTelemetry’s second strength is its community. It has the backing of most major observability vendors, including our respective employers. There are folks working on OpenTelemetry day in and day out, gathering feedback from end users, actively improving the project. In fact, there are dedicated OpenTelemetry Developer Experience and OpenTelemetry Contributor Experience groups to help make OpenTelemetry more ergonomic.
Making OpenTelemetry instrumentation work for you
If OpenTelemetry and observability are new to you, it can be really overwhelming to start instrumenting application code with OpenTelemetry. Below are some of the things that developers can start doing right now to instrument application code with OpenTelemetry, without feeling overwhelmed.
Instrumentation Tips
Let’s start with some good practices for instrumenting application code.
1- Start with zero-code instrumentation
Zero-code instrumentation adds instrumentation to application code without requiring developers to touch their source code. It uses shims or bytecode instrumentation agents to intercept code at runtime or compile-time to add instrumentation to common third-party libraries and frameworks called by the application code. At the time of this writing, zero-code instrumentation is available for Java, .NET, Python, JavaScript, PHP, and Go.
While zero-code instrumentation isn’t perfect and still requires code-based (manual) instrumentation to fill in the gaps, it’s a great way to get things started, especially when you don’t know where or how to start.
2- Supplement with manual instrumentation to fill in the gaps
Zero-code instrumentation is a great starting point if it’s available for your language. However, it’s not enough. Zero-code instrumentation doesn’t include what’s important for your application. This is where code-based (manual) instrumentation helps fill in the gaps. Code-based instrumentation requires that the developer add traces, metrics, logs, context propagation, attributes, and so on, to their own code.
3- Practice observability driven development
Observability-driven development (ODD) is the practice of instrumenting as you write new application code.
By instrumenting your code while it’s still top of mind, it’s easier to identify what actually needs to be instrumented. As a developer, this is key, because going back to your code to instrument a day or a week later, things might not be as fresh in your mind.
4- Don’t be afraid to use AI to help with instrumentation!
AI is a game changer and can be a real time-saver to help with instrumenting code…if used correctly. More on that shortly.
What to instrument
Once you’re ready to instrument code, what exactly should you instrument? It starts with traces.
1- Add spans to meaningful units of work
What happened when going from point A to point B? Traces help with that, by telling the story of a request. A trace is made up of spans, which represent units of work. As you start to instrument your application, it can be tempting to add spans to every single little method call. Unfortunately, you might end up with too much noise, and end up missing the important parts. Instead, focus on meaningful units of work. These can include:
Inbound requests, such as HTTP calls
Outbound calls to DB caches, APIs, messaging queues
Business critical operations
2- Capture significant events in logs
While traces tell the overall story of what is happening within and across services, logs help us understand specific things that happened at a specific point in time, providing additional context to help developers understand what is happening in their application.
Keeping that in mind, developers should add logs to explain why something happened. This includes capturing:
Errors
Validation failures
Retries and fallback paths
Security-related events, such as authentication failures and permission denials
3- Capture latency metrics
Writing performant code is important for developers. In an age where end users expect responsive applications and are happy to abandon non-performant applications and web sites in the blink of an eye, this is especially important. If you’re writing a shopping cart feature, for example, you want the response time for each step in the “add to shopping cart and checkout” experience to take milliseconds, not seconds. This is why capturing latency metrics is important, as it can help pinpoint why a particular request is taking longer than usual.
4- Instrument home-grown frameworks and libraries
Chances are that most of your code will touch these, so you’ll get pretty good coverage overall.
5- DON’T PANIC
One of our favourite things about the OpenTelemetry project is that there is a huge community of practice at your disposal. This takes on the form of official documentation, the OpenTelemetry YouTube channel, vendor blog posts, personal blog posts, and newsletters. There is also a vibrant and thriving OpenTelemetry community on CNCF Slack…and the folks are friendly and willing to help!
AI-assisted instrumentation
As we said earlier, AI can and should be leveraged to help us instrument our code.
Adriana worked as a Java developer for 16 years and started her development career in 2001, long before the days of AI assistants. An AI coding assistant would’ve definitely been a nice-to-have all those years ago!
Diana, on the other hand, comes from an SRE background. She found that experimenting with different SDKs was essential for truly understanding how instrumentation works under the hood. Many language APIs/SDKs are still evolving and are at different levels of maturity in terms of OpenTelemetry feature support. As part of her OpenTelemetry instrumentation learning journey, AI-assisted instrumentation proved especially helpful in speeding up exploration and reducing friction. You can find more details and examples of what she tried in her GitHub repository.
As you can see from our two different perspectives, having AI to help you instrument your code is a game-changer, and can certainly help make the whole instrumentation journey a lot less stressful, whether you’re practicing ODD and/or if you’re instrumenting legacy code. That is…if it’s done properly.
Here are some of the things that developers can keep in mind when using AI coding assistants to help instrument application code with OpenTelemetry.
1- Be specific
Be sure to include as much context as possible. These include:
Role: You (coding assistant) are a Java software developer
Objective: I have already added some zero-code OpenTelemetry instrumentation. Add some supplementary manual instrumentation to this code
Inputs: Code is in X folder. Code is instrumented in Y language. Include links to relevant documentation and/or code examples
Outputs: Manual OpenTelemetry instrumentation (traces, logs, metrics) in X language
2- Challenge your AI agent
Ask it to explain its decisions and reasoning.
Create an LLM-as-judge agent to challenge the decisions made by the instrumentation agent.
If possible, use a different model for the “judge” agent
3- Iterate
Coding has always been an iterative process, and coding with AI is no different. Don’t be afraid to try different things. Refine the things that worked, and discard the things that didn’t work.
Observability tools for developers
Having a clear path for instrumenting applications is only part of the story. It’s also important to have observability tooling to help developers interpret telemetry data.
OpenTelemetry Collector for Developers
It starts with the OpenTelemetry Collector. The OpenTelemetry Collector is a vendor neutral agent used to ingest OpenTelemetry signals (traces, logs, metrics) from multiple sources, process the data (if/as needed), and export the data to one or more destinations.
If you’re a developer, you may be wondering why you would want to set up your own Collector instance. After all, isn’t this something that the platform engineering team can set up for you through some self-service tooling? While that is absolutely true, we strongly feel that it is important for developers to know how the OpenTelemetry Collector works at a high level, and how to configure it, because it is such a key component of the OpenTelemetry ecosystem. Plus, as the old adage goes, knowledge is power.
The Collector is made up of the following components:
Receivers to ingest application and infrastructure telemetry.
Processors can do things like add/remove attributes, mask data, and sample data.
Exporters can send your telemetry data to one or more destinations simultaneously
Pipelines define how data flows in the Collector, by connecting receivers, processors, and exporters together. Traces, logs, and metrics each require their own pipeline. While it is possible to have multiple traces, logs, and metrics pipelines, for development purposes, you need one of each.
Additionally, the Collector has connectors, which “link” two pipelines, acting as a receiver in one pipeline and an exporter in another.
Collector configurations can get really fancy for non-development scenarios. For development purposes, however, we care about:
Ingesting application telemetry
Exporting application telemetry
We don’t need any processors. We do, however, want a connector. More on that shortly.
Below is a simple, developer-friendly Collector configuration:
OTLP Receiver: Ingests application telemetry data using either gRPC or HTTP
Debug Exporter: Exports telemetry data to the Collector’s console (stdout).
SpanMetrics Connector: The SpanMetrics Connector serves as an exporter in a traces pipeline, calculating the duration of an OpenTelemetry span. It can send that span duration as a receiver in a metrics pipeline. This helps developers identify latency issues if a span suddenly seems to take longer than usual to complete.
Pipelines: There’s a separate pipeline for traces, logs, and metrics.
The problem with sending telemetry to the Collector via the debug exporter is that you get a text output like this:
Telemetry output using the OpenTelemetry Collector’s Debug Exporter.
This type of text-based output makes troubleshooting challenging, especially if you’re used to having some nice IDE extensions to help with troubleshooting. Wouldn’t it be nice to have a local tool for visualizing OpenTelemetry signals?
Fortunately, we found three such tools, all of which are open source, which we’ll explore below:
Before we dive into each tool, you can check out this quick comparison matrix to get a feel for what they do:
Tool Name
Signal Support
Features
OTel Desktop Viewer
Traces only
Traces only Web UI
otel-tui
Traces, logs, metrics
Traces, logs, metrics Service map Text-based UI
OTel Front
Traces, logs, metrics
Traces, logs, metrics Overview page (not clickable) Web UI
If you’re interested in exploring these tools in greater detail for yourself, you can check out our GitHub repository using a simple Java client/server application (with a few more things added) to emit telemetry.
Since the OpenTelemetry Collector and the three desktop OpenTelemetry visualization tools we explored can all be run using Docker, we used Docker Compose to manage and configure these tools.
Below is a consolidated Docker Compose for all 3 tools:
The OTel Desktop Viewer runs on port 8000, and can be accessed via http://localhost:8000.
The OTel Desktop Viewer receives telemetry data on container port 4318.
If you’re running the OTel Desktop Viewer on an AMD64 machine, change otel-desktop-viewer.image version to v0.2.5-amd64.
Next, add an OTLP HTTP exporter for the OTel Desktop Viewer to your Collector config.yaml, where otel-desktop-viewer is the name of the OTel Desktop Viewer’s docker container, per the code snippet below.
Next, add an OTLP HTTP exporter for the OTel Desktop Viewer to your Collector config.yaml, where otel-desktop-viewer is the name of the OTel Desktop Viewer’s docker container, per the code snippet below.
otphttp/otel-desktop-viewer was only added to the traces pipeline. This is because this tool only works for traces. If you try to add it to the metrics or logs pipeline, it will fail to start.
Below is a sample trace output from OTel Desktop Viewer:
OTel Desktop Viewer spans view
Clicking on a span reveals various span attributes and span events (if applicable).
otel-tui
otel-tui is a terminal OpenTelemetry viewer inspired by OTel Desktop Viewer. The project started in March 2024.
Below is the docker-compose.yaml snippet to run otel-tui:
To run otel-tui, you must execute the following commands:
docker compose up otel-tui -d (run as a daemon process)
docker compose attach otel-tui (start the tool)
otel-tui receives telemetry data on container port 4318.
Next, add an OTLP HTTP exporter for otel-tui to your Collector config.yaml, where otel-tui is the name of the otel-tui’s docker container, per the snippet below.
Unlike the OTel Desktop Viewer, otel-tui supports traces, logs, and metrics. It also has a Topology view, which shows the relationship between OpenTelemetry services. The UI looks like a graphical command-line tool and relies on the keyboard for navigation.
Navigation:
Use tab to navigate between traces, logs, and metrics views
Use up and down arrow keys within each view to look at specific telemetry
Use d to view details about a trace, log, or metric, in the respective view.
Traces view:
otel-tui spans view
Logs view:
otel-tui logs view
Metrics view:
otel-tui metrics view
Topology view:
otel-tui topology view
OTel Front
OTel Front is a desktop tool for viewing OpenTelemetry traces, logs, and metrics. The project started in November 2025.
Below is the docker-compose.yaml snippet to run OTel Front:
OTel Front runs on container port 8000, and is mapped to host port 8001, to avoid port conflicts if the OTel Desktop Viewer was running at the same time. It can be accessed via http://localhost:8001.
OTel Front uses container ports and 4317 (HTTP) 4318 (gRPC) to receive telemetry data.
Next, add an OTLP gRPC exporter for OTel Front to your Collector config.yaml, where otel-front is the name of the OTel Desktop Viewer’s docker container per the snippet below.
Unlike the OTel Desktop Viewer, OTel Front supports traces, logs, and metrics.
Below is the trace view. It shows related logs, span events, and span attributes.:
OTel Front traces view
Below is the logs view:
OTel Front logs view
Below is the metrics view:
OTel Front metrics view
It also has a dashboard view:
OTel Front dashboard view
Unfortunately, the dashboard is not clickable, meaning that you can’t click on, say, a recent trace to take you to the traces view.
Challenges with OpenTelemetry tooling for developers
We think it’s really great that there are so many options out there in terms of OpenTelemetry desktop tooling, especially since they’re open source. We did, however, run into a few challenges when working with these tools:
Ease of use and setup: These tools were a bit challenging to set up. Since we already had experience with the OpenTelemetry Collector and Docker, we were able to get past these challenges quickly. If you’re not as well-versed in these, it may be trickier for you…though our GitHub repository should help!
Third party tools: Since these are third-party open source tools, you have to rely on someone else to maintain the tool. Or, if you feel bold enough, make contributions yourself, by adding new features or fixing bugs if you want these issues resolved in a timely manner.
OpenTelemetry feature parity: These tools are also not necessarily up-to-date with the latest versions of the OpenTelemetry API and SDK, so they may not quite work as expected.
Another option is to go the SaaS vendor route. If your company is already using OpenTelemetry in production, chances are that it may already have a license for one of the many OpenTelemetry compatible vendors, which means that you can ask your manager for a license. The challenge with going this route is:
Depending on the licensing agreement, you may not get one
Large vendor tools have a larger learning curve
That being said, you have options.
Final thoughts
There’s no doubt in our minds that developers should instrument their applications with OpenTelemetry to troubleshoot their own code. As we said before, instrumentation with OpenTelemetry:
Reduces debug time
Accelerates development and deployment
Improves code quality
Helps us understand distributed systems
Helps us make sense of vibecoded applications
But most of all, it’s because it has always mattered. When you think about it, developers have been doing observability for a while, using logs, stack traces, and profiling tools. We just didn’t call it that.
Where does Kyverno live in your organization? I don’t mean which cluster! On which team’s slide deck does it show up? Whose budget line?
For most companies I’ve talked to, the answer is security. Kyverno is evaluated alongside OPA/Gatekeeper, approved by the security team, deployed with a bundle of Pod Security Standard policies, and then… mostly sits there, blocking the occasional root container.
Meanwhile, the teams actually getting interesting value out of Kyverno are the ones doing things with it that make me stop and take notes. These are almost never security teams. They are platform teams. And I don’t think that’s a coincidence. I think we’ve filed Kyverno in the wrong mental category, and that miscategorization is costing us access to most of what the tool can do.
I’ve been circling this observation for a while. My first Kyverno conference talk, back at KCD Munich 2023, was literally titled “Securing Your Kubernetes Workloads with Kyverno” — I was filing it in the security drawer myself. Three years of production work later, my talks are about governance, CEL, and platform self-service, and my post on the Platform Engineering blog argued that Kyverno has outgrown “policy engine” as a description entirely. This post is me finally putting the underlying claim in one sentence, and it’s the opening argument of a longer series on policy-driven platform engineering: Kyverno is a platform primitive. Not a security tool that platform teams happen to use. A building block for platforms, in the same sense that Pods and Services are building blocks, that happens to also be useful for security.
The problem with the security framing
Let me be clear about what I’m not saying. Kyverno absolutely does security work. It blocks insecure configs, it enforces PSS, it verifies image signatures. If your CISO asks whether it helps with compliance, the answer is yes, genuinely.
But “security tool” carries a specific mental model with it: policy as a gate. Something bad shows up, the gate stops it. The primary verb is deny. Success gets measured in blocked deployments.
Now look at what Kyverno actually does. Four things: validate, mutate, generate, verify images. Only the first one fits the gate model. Mutation changes resources on their way into the cluster. Generation creates entirely new resources in response to things happening. Image verification is about establishing trust more than blocking threats, if you squint.
Three out of four verbs are constructive. They add things, change things, build things. And yet if you look at how most organizations deploy Kyverno, it’s validation policies wall to wall. That’s the security framing expressing itself in the config. When your mental model is “policy = deny,” you end up using a quarter of the tool.
Okay, so what’s a “platform primitive”
I should define the term since I’m hanging the whole post on it. When I say primitive, I mean it the way programming languages mean it: a small, well-understood building block that you compose bigger things out of. For a platform, I’d say a primitive needs four properties:
It abstracts complexity. Developers use it without understanding the machinery underneath.
It provides guarantees. Using it means certain properties hold automatically.
It composes. You combine it with other primitives to build higher-level stuff.
It’s self-service. You get it from the platform, not from a ticket queue.
Pods, Services, ConfigMaps: primitives. Crossplane compositions: primitives. And I want to convince you Kyverno policies belong on that list too.
What platform teams actually do with it
The best way I know to make this concrete is just to list the things I’ve seen platform teams build with Kyverno once they stopped thinking of it as a security scanner with opinions.
Namespace furnishing. A developer creates a namespace, and Kyverno generates the default NetworkPolicy, ResourceQuota, LimitRange, RoleBindings, and others. Nobody reads a wiki page listing the six things you’re supposed to remember. The namespace shows up furnished.
Sidecar injection. Observability agents, mesh proxies, secret sync containers – they’re all mutated into Pod specs at admission. The developer’s Deployment manifest stays clean and boring. The platform’s requirements get met anyway. Nobody negotiated anything.
Image reference rewriting. This one’s my favorite because it’s so simple and saves so much aggravation. Your platform wants images pulled through an internal mirror. You could ask every developer to remember mirror.internal/ prefixes forever, and they won’t, and you’ll have flaky builds when Docker Hub rate-limits you. Or Kyverno rewrites nginx:1.25 to mirror.internal/nginx:1.25 at admission and the whole problem just… stops existing. Developers write the natural thing. The right thing happens.
Default resource requests. Instead of blocking Pods without CPU/memory requests, which is technically correct but practically infuriating, inject workload-appropriate defaults. The scheduler gets what it needs. Developers deal with it when they actually need to tune something, not before.
Ownership labels. Team, cost center, environment. Enforce them where ambiguity is real, default them where it isn’t.
Read that list again and notice: none of it is security. It’s developer experience and operational hygiene—the boring, load-bearing work of running a platform.
What ties it together is that each one takes a belief the organization holds about how things should work and turns it into automatic, invisible enforcement. Nobody has to remember. That’s what a primitive does: it makes a guarantee so you don’t have to think about it.
Policy is how the platform expresses intent
Every organization has beliefs about how things should run. Some are security beliefs, like no root containers and only signed images. Some are operational, like everything has resource limits. Some are financial, like everything has a cost-center label. Some are honestly just cultural, like every deployment traces back to a catalog entry somewhere.
The traditional home for these beliefs is documentation. Wikis, onboarding decks, PR checklists, that one senior engineer who reviews everything. Which means enforcement is uneven, knowledge is tribal, and the platform team ends up as a human bottleneck because nothing works without someone in the loop.
Policy as code, versioned in Git, delivered by your GitOps tooling, and enforced by Kyverno is how those beliefs stop being documentation and become infrastructure. The platform’s rules stop living in people’s heads and start living in the system.
That’s the reframe, compressed: policy is the platform’s API for organizational intent.
What falls out of this
If you buy the reframe, some useful things follow, and they’re roughly the roadmap for the rest of this series.
The four verbs stop being a flat feature list and turn into a hierarchy of platform capabilities. Validation is guardrails. Mutation is paved roads. Generation is scaffolding. Verification is trust. Mutation in particular is wildly underused relative to how powerful it is. That gets its own post because I have a lot to say about it.
Policies start looking like products: versions, users, deprecation cycles, exception processes. Progressive rollout (auditing, then warning, then enforcing) stops being an advanced technique and becomes just how you ship a policy. Exceptions become tracked debt instead of quiet approvals buried in Slack threads.
And GitOps gets bigger. If policy is code and policy is how the platform expresses intent, the policy repo matters as much as the app manifests it governs. Your Argo CD or Flux isn’t just deploying workloads anymore. It’s deploying the rules that shape workloads. Which, by the way, opens up some genuinely tricky reconciliation questions when a policy mutates a resource that Argo CD thinks it owns. Also a future post. It’s a fun one if your idea of fun is sync loops.
The takeaway
Next time you’re in the Kyverno docs, try reading them as a platform SDK instead of a security manual. The API surface is bigger than the security framing suggests, and the things you can build on it are more interesting than “block bad Pods.”
Kyverno isn’t a bouncer standing at the door of your cluster. It’s connective tissue. It’s how the platform’s opinions become the platform’s behavior. Once that clicks, it’s hard to unsee — and the rest of this series is about what you do after it clicks.
When people talk about cloud sovereignty, the conversation often starts with regions: where a workload runs and where its data is stored. But choosing a region is only part of the story. The architecture of the platform matters just as much, particularly how it separates control, runtime, build, and observability responsibilities across clusters.
A recent CNCF community post, “From data residency to digital sovereignty: architectural patterns for cloud native platforms,” made the case well. Under regimes like the EU Data Act, NIS-2, DORA, and the UK Data Use and Access Act, platform teams now have to show more than where workloads run. They have to show how the platform is operated, secured, and governed, all the way down to the control plane.
That article laid out the requirements and introduced the tenant-cluster pattern as one way to draw isolation boundaries. In this article, we look at the same requirements from a different but complementary angle: what happens when you treat sovereignty as a property of a platform’s plane topology. We will use OpenChoreo, an open source internal developer platform and a CNCF Sandbox project, as an inspectable example. The architectural ideas apply broadly, though.
What auditors ask platform teams
The earlier post narrows down the regulatory and procurement noise into four practical properties. Rather than repeat them, we will restate them as the questions an auditor or a procurement team actually asks a platform team:
For every component that can touch tenant data, including the control plane and the logs and metadata around it, can you name the legal jurisdiction it runs under?
If your vendor’s hosted service disappeared tomorrow, could your team continue operating the workload, rebuild it, and move it elsewhere?
Can anyone outside the boundary reach your keys, your cluster state, or an admin credential?
If the provider, hardware, or country changes, does the workload move, or does it need to be rewritten?
Look at what these questions have in common. Almost none of them are about location. They are about where control and state live, and who can reach them.
A single shared Kubernetes cluster makes those questions difficult to answer cleanly. One API server, one etcd, one set of controllers and admission webhooks serve every tenant. That makes it hard to point to a clear architectural boundary during an audit.. The tenant-cluster pattern fixes this by giving each boundary its own control plane. A multi-plane platform fixes the same problem one layer up. The two patterns also work well together, as we will see later.
A multi-plane topology
OpenChoreo splits the platform into planes. Each plane is its own cluster, with its own lifecycle, its own scaling behavior, and its own security boundary:
A control plane holds desired state through declarative APIs and runs the reconciliation controllers. It orchestrates. It does not run tenant workloads.
One or more data planes are conformant Kubernetes clusters that actually run workloads. Each data plane has its own API server and its own state.
One or more observability planes collect and serve logs, metrics, and traces.
One or more workflow planes execute CI and GitOps workflows.
An experience plane provides the developer portal, CLI, and API/MCP surfaces.
Figure 1: The multi-plane topology. Arrow direction shows who initiates the connection.
The connection model is the detail that matters most for sovereignty, and it is why the arrows in Figure 1 point the way they do. The data, observability, and workflow planes each open an outbound, mutually authenticated (mTLS) connection to the control plane’s gateway. The control plane never dials into them.
Two things follow from this. First, because the connection is outbound only, the API servers of the clusters holding regulated workloads are never exposed to the internet. Second, the control plane holds the desired state, not the tenant runtime state. It translates higher-level resources into Kubernetes resources and hands reconciliation to each data plane’s own API server. So a data plane keeps serving traffic even if it loses its link to the control plane.
That separation allows a single orchestrating control plane to work with strong regional boundaries without becoming the place where all runtime states have to live.
How the topology holds up
Question 1: Can you name the jurisdiction? With a “one jurisdiction, one data plane” model, the answer can be represented directly in the architecture and defended during an audit. Figure 2 shows what this looks like with two jurisdictions. The observability design keeps the answer clean. Each data plane reports to a regional observability plane, and the portal queries that plane directly instead of routing telemetry back through the control plane. OpenChoreo’s documentation flags exactly this pattern for multi-regional deployments under regional data-privacy rules. A tenant’s runtime state lives in its regional data plane, and its logs never leave the region either.
Figure 2: regional boundaries in practice. Workloads and telemetry stay inside the dashed lines; only the outbound mTLS link crosses them.
Question 2: can you operate without the vendor? Each data plane is a full, conformant Kubernetes cluster, not an opaque managed endpoint, and it runs fine while disconnected from the control plane. The stack underneath is open source and largely built around CNCF and cloud -native projects, including Argo Workflows, Cloud Native Buildpacks, OpenSearch, Prometheus, OpenTelemetry, Flux, cert-manager, and Cilium. The design is modular, so a team can swap a component or put an existing observability stack behind the same query interface. No single hosted service sits on the critical path.
Question 3: can outsiders reach keys, state, or credentials? The outbound-only mTLS model keeps the sensitive clusters unreachable from the internet in the first place. Secrets and keys live in whichever External Secrets Operator-compatible store or vault the team chooses, which makes key ownership a decision rather than a default. Authorization is fine grained, down to individual namespaces, projects, and components, with groups mapped from any OAuth2/OIDC identity provider. The same authorization model applies whether the caller is a developer, the CLI, or an AI agent.
Question 4: does a change of provider mean a rewrite? Workloads are represented as standard Kubernetes resources and run on conformant Kubernetes clusters, whether those clusters are in a public cloud, on premises, or on bare metal. Promotion is a first class concept. A pipeline can move a component from development on one data plane to production on another, in a different geography or provider, applying environment-specific configuration on the way. Swapping the infrastructure under a jurisdiction becomes a topology change, not a migration project.
How the platform layer meets the infrastructure layer
The earlier post built its isolation story on the tenant-cluster pattern giving each tenant a virtual cluster of its own inside a shared host cluster.It is useful to look closely at how a platform layer can sit on top of that pattern, because the two solve different parts of the sovereignty problem.
Let’s start with what a virtual cluster gives you at the infrastructure layer. Each tenant gets a virtual control plane: its own API server and its own datastore, running as pods inside a shared host cluster. Tenant A cannot see tenant B’s resources, cannot be taken down by tenant B’s misbehaving CRDs or webhooks, and cannot touch tenant B’s cluster state. That is real control plane isolation, and it costs a fraction of a dedicated cluster because one node pool serves everyone.
Now look at what the tenant-cluster pattern, by design, does not decide. It does not decide which jurisdiction a tenant lands in. It does not decide where that tenant’s logs and traces are shipped. It does not define who may promote a workload from staging in one region to production in another. It does not give developers a paved road that keeps them from hand crafting kubeconfigs against raw clusters. These are not gaps in the pattern. They are platform layer concerns, and they are exactly the concerns the four sovereignty questions keep circling back to: where state lives, where telemetry flows, who can act across a boundary, and whether any of it is provable.
This is where the layering pays off. To the OpenChoreo control plane, a virtual cluster is just another conformant Kubernetes API. Register it as a data plane, and every platform layer control in this article now applies to it:
The DataPlane resource carries a jurisdiction label, so tenant placement becomes declarative and reviewable, not tribal knowledge.
The observabilityPlaneRef pins telemetry to the regional observability plane, so a tenant’s logs inherit the same residency guarantee as its workloads.
Promotion pipelines defined at the platform layer decide which environments a component may move between, so a workload cannot drift into the wrong jurisdiction through an ad-hoc deployment.
The same fine-grained authorization applies to every tenant, mapped from the same identity provider, whether the caller is a developer, the CLI, or an AI agent.
Developers get golden paths and a portal instead of raw cluster access, which shrinks the number of humans who ever hold credentials to the sensitive clusters.
Figure 3 shows the composed topology: one physical host cluster per jurisdiction, virtual clusters inside it as per-tenant data planes, one control plane orchestrating all of them over the same outbound mTLS link. In principle nothing about the registration changes because the data plane happens to be virtual; if you try this and hit an edge, that is a contribution waiting to happen.
Figure 3: the two layers composed. Virtual clusters draw the tenant boundaries inside the jurisdiction; the platform layer decides what may cross any boundary, and records why.
Read the figure as a division of labor. The infrastructure layer answers “who is isolated from whom.” The platform layer answers “what is allowed to go where, and can we prove it.” Neither layer can answer the other’s question. Virtual clusters alone leave placement, telemetry routing, and promotion as manual policy enforced by hope. A platform alone, running tenants as namespaces on shared clusters, leaves every tenant one admission-webhook misconfiguration away from its neighbors. Together they cover all four sovereignty questions at a cost that scales with jurisdictions, not tenants.
One caveat belongs in the open, and Figure 3 makes it visible: tenants on the same host still share nodes and a kernel. If the threat model demands hardware isolation per tenant, a virtual cluster is not enough, and that tenant needs a physical data plane of its own. The point of a composable topology is that this, too, is just a registration decision, not a redesign.
Sovereignty as declarative configuration
The earlier post ends with an idea worth carrying forward: sovereignty should be something with a name, a template, and a commit history, rather than only a clause in a contract.
A plane topology expressed as declarative Kubernetes resources fits that idea well. Data planes, environments, and deployment pipelines are custom resources. The entire topology can live in Git: which region has which data plane, which observability sink it uses, and which promotion paths are allowed.
The manifest below is a simplified sketch with abbreviated field names. It is meant to show the shape, not an exact schema:
# Illustrative only. See the project docs for the real API surface.
kind: DataPlane
metadata:
 name: eu-west
 labels:
   jurisdiction: eu
spec:
 observabilityPlaneRef: eu-observability  # telemetry stays in-region
 # registry, gateway, and network settings scoped to the EU boundary
---
kind: Environment
metadata:
 name: production-eu
spec:
 dataPlaneRef: eu-west
Adding a new jurisdiction then becomes a reviewed pull request. And when someone asks “why is this tenant’s data in this jurisdiction?”, the answer is a commit history, not a screenshot of a console.
What the topology does and does not give you
First, the multi-plane topology does not change the legal jurisdiction of the organization operating the infrastructure. If a cluster operator is subject to a particular legal regime, that exposure still exists. Where the threat model requires sovereign hardware or a sovereign operator, that decision must be made at the infrastructure layer. The topology can partition exposure and reduce its scope, but it cannot remove the legal context of the operator.
Second, the topology draws boundaries; it does not enforce what happens inside them. Policy enforcement, supply-chain attestation and SBOMs, audit logging, and workload identity through something like SPIFFE/SPIRE are separate concerns, and a sovereign deployment may need all of them. The distinction here is between the architectural pattern and the platform implementation. The pattern alone does not provide these controls, but the platform layer is a natural place to integrate them. OpenChoreo’s modular architecture is intended to support this type of integration, in the same way it already orchestrates components such as Cilium, Flux, and cert-manager. Boundary comes first, enforcement is layered on top.
Third, more planes mean more to run. Every cluster is something to monitor, upgrade, and back up. The pattern earns its cost when the boundary you are drawing carries real legal or risk weight. It is overkill when it does not. This is also where the virtual cluster composition above pays off, by keeping the number of physical clusters tied to the number of jurisdictions rather than the number of tenants.
Takeaways
The reframing in the original post holds up. Sovereignty is less about a region on a dropdown and more about how control, state, keys, and audit trails are distributed.
Seen through that lens, the interesting design question becomes how to split responsibilities: tenant clusters as the isolation primitive, a plane-separated topology as the boundary map, and, most powerfully, both together. Expressing those boundaries as declarative, version-controlled objects is what turns “sovereign” from a procurement promise into something a platform team can actually operate and audit.
OpenChoreo is an open -source CNCF Sandbox project. If you would like to explore or contribute, the code and community links are at openchoreo.dev.
Every multi-region setup eventually meets the same awkward moment: a whole cluster goes away, and the identical copy of your service running two regions over might as well not exist, because nothing is wired to treat them as one thing. Failover becomes a runbook: restore, repoint DNS, and wait for an outage that, on paper, you’d already paid to survive.
Linkerd’s multicluster extension closes that gap by letting several clusters present a service as a single, load-balanced endpoint. The part that the official tasks gloss over is that a real platform almost never picks one multicluster mode. Some services want federation (same service everywhere, one endpoint, automatic failover). While others want mirroring (reach a specific remote service by name). And you frequently want both patterns living on the same set of links. The docs walk through each mode on its own. This post wires all three together across three GKE clusters, with a full-mesh link topology, a chaos test that takes out an entire cluster, and scripts you can clone and run on a fresh GCP project.
Companion repo: Every script referenced here lives in this repository. Feel free to clone it, set your project ID, and run it.
Linkerd multicluster modes: Gateway, flat, and federated
Linkerd’s multicluster extension supports three modes. The nice thing is they’re not mutually exclusive: on the same set of linked clusters, the mode is chosen per service via a label.
Mode
Label
Whathappens
Network Requirement
Hierarchical (gateway)
mirror.linkerd.io/exported=true
Service mirrored as <svc>-<cluster>, traffic routed through a gateway
Gateway IP reachable
Flat (pod-to-pod)
mirror.linkerd.io/exported=remote-discovery
Service mirrored as <svc>-<cluster>, traffic goes directly to remote pods
Flat network (pod IPs routable)
Federated
mirror.linkerd.io/federated=member
All same-name services unioned into <svc>-federated, load balanced across all clusters
Flat network (pod IPs routable)
The distinction that matters operationally is that hierarchical mirroring works on any network. Only the gateway IP needs to be reachable, while flat and federated modes need real pod-to-pod connectivity. On GCP, VPC-native GKE clusters on peered VPCs give you that flat network for free. So, you can run federated services for your core workloads over a flat network and still mirror a specialized service through a gateway from a cluster that isn’t on that network. Most platform teams I’ve seen end up with exactly this kind of mix.
Multi-region architecture: GKE cluster setup
We have three GKE clusters across three regions, fully linked to each other (six directional links total). Three demo services, each using a different multicluster mode:
frontend is federated and runs in all three clusters. A single federated frontend service in each cluster load-balances across all nine pods (3 replicas × 3 clusters). When a cluster goes down, the remaining six pods absorb the traffic with no application changes.
api is flat-mirrored and runs in `west` and `east`. The `north` cluster consumes it as `api-west` and `api-east`, which are explicit remote service names with traffic sent straight to the remote pods. This is what you reach for when the client needs to decide which backend it talks to, for example, to keep a request in-region for data locality.
analytics is gateway-mirrored and runs only in `east`. Exported through the Linkerd gateway so `west` and `north` reach it as `analytics-east-gw` without needing flat-network connectivity to `east`’s pods. It’s here mainly to prove that gateway mode coexists with flat and federated modes on the same links.
Deployment prerequisites: GKE, Linkerd, and CLI tools
A GCP account (free-tier credits cover this. Use three standard clusters with small node pools)
The infra script enables the `compute` and `container` APIs for you, so a brand-new project works out of the box.
Step 0: Configure
Clone the repo, create a local .env file from the example file, and customize it for your GCP project. The defaults are enough for the rest of the demo, so in most cases you only need to change the project ID.
```bash
git clone <your-repo-url>
cd blog-linkerd-federation
cp env.example .env
```

Open `.env` and set at least your project ID. The file ships with sensible defaults for everything else:

```bash
export GCP_PROJECT="your-project-id"

export REGION_WEST="us-central1"
export REGION_EAST="us-east1"
export REGION_NORTH="europe-west1"

# One zone per region. We pin node-locations to a single zone so num-nodes is
# the TOTAL node count — see the cost note below for why this matters.
export ZONE_WEST="us-central1-a"
export ZONE_EAST="us-east1-b"
export ZONE_NORTH="europe-west1-b"

export CLUSTER_MACHINE_TYPE="e2-medium"
export CLUSTER_NODE_COUNT="1"
export FRONTEND_REPLICAS="3"
```
At minimum, set GCP_PROJECT. Everything else ships with sensible defaults: three regions, one zone per region, and small node pools to keep the cost down. If you run cat .env, you should see the full set of variables populated.
Load the variables into your current shell so the scripts can read them:
```bash
source .env
```
Every script below reads from this file, and they all run with `set -euo pipefail`, so a missing variable fails loudly rather than silently. That’s why `env.example` carries the full set, the VPC and cluster names included, instead of just the project ID.
Step 1: Provision three GKE clusters with VPC peering
Run the infrastructure script to create the networks and clusters. This takes about 10–15 minutes, so it’s a good point to grab a coffee.
```bash
./scripts/01-infra.sh
```
This script does the following:
Enables the `compute` and `container` APIs (no-op if they’re already on).
Creates three VPCs with non-overlapping pod and service CIDRs, a hard requirement for VPC peering.
Sets up full-mesh VPC peering (west↔east, east↔north, north↔west) with `–export-custom-routes` and `–import-custom-routes` so pod CIDRs are actually advertised. This is what gives us the flat network.
Creates three GKE Standard clusters, one per VPC/region, each pinned to a single zone.
Renames the kubectl contexts to `west`, `east`, `north`.
Here’s the address plan the script uses. The ranges are intentionally non-overlapping so VPC peering can route pod traffic correctly:
Cluster
VPC Subnet
Pod CIDR
Service CIDR
west
10.10.0.0/20
10.100.0.0/14
10.104.0.0/20
east
10.20.0.0/20
10.108.0.0/14
10.112.0.0/20
north
10.30.0.0/20
10.116.0.0/14
10.120.0.0/20
Non-overlapping ranges are non-negotiable. If pod CIDRs overlap across peered VPCs, routing breaks silently. Pods get responses from the wrong cluster, or connections time out with nothing useful in the logs. Ask me how I know.
One zone, not three. A GKE regional cluster places `–num-nodes` nodes in each of three zones by default. With `–num-nodes 1` that’s 3 nodes per cluster, 9 total, and triple the bill. The script pins `–node-locations` to a single zone so `CLUSTER_NODE_COUNT=1` really means one node per cluster.
Cost note: Three Standard clusters with one `e2-medium` node each run roughly $10–15/day total for this demo (management fee + nodes + a small gateway load balancer on `east`). The teardown script removes everything.
Step 2: Install Linkerd with a shared trust anchor
Install Linkerd into all three clusters using a shared trust anchor. The script generates the certificates, installs the control plane, and configures each cluster to trust the others for cross-cluster mTLS.
```bash
./scripts/02-linkerd-install.sh
```
This generates a root CA and per-cluster issuer certificates, then installs Linkerd on all three clusters:
Per-cluster issuer certs are a production habit worth keeping: if one cluster’s issuer is compromised you rotate it in isolation, without touching the others. The shared root is what lets cross-cluster mTLS work at all. Every proxy can verify every other proxy’s identity back to the same anchor.
To keep resource usage (and cost) down, this installs the control plane only with no Viz add-on.
Step 3: Install multicluster and create a full-mesh link topology
Set up the multicluster components and create a full-mesh topology between the clusters. After this step, every cluster can consume services from every other cluster.
```bash
./scripts/03-multicluster-setup.sh
```
This is the step with the most going on. We create six directional links, every cluster linked to every other cluster, so every cluster gets a `<svc>-federated` service for federated workloads, and every cluster can consume mirrored services from any other.
The wrinkle is the gateway. Only `east` needs one (it’s the only cluster exporting `analytics` hierarchically), so we enable the gateway in east’s install and leave everyone else gatewayless. One install per cluster, all flags at once, no re-running install a second time to bolt a gateway on afterward:
```bash
# west: gatewayless, with one controller per cluster it consumes from
linkerd --context west multicluster install --gateway=false \
  --set controllers[0].link.ref.name=east \
  --set controllers[1].link.ref.name=north \
  --set controllers[2].link.ref.name=east-gw \
  | kubectl --context west apply -f -

# east: gateway enabled here, controllers for the clusters it consumes
linkerd --context east multicluster install --gateway=true \
  --set controllers[0].link.ref.name=west \
  --set controllers[1].link.ref.name=north \
  | kubectl --context east apply -f -

# north: gatewayless, controllers for west, east, and east's gateway link
linkerd --context north multicluster install --gateway=false \
  --set controllers[0].link.ref.name=west \
  --set controllers[1].link.ref.name=east \
  --set controllers[2].link.ref.name=east-gw \
  | kubectl --context north apply -f -
Note the controller count. The service-mirror controller runs on the consuming side, one per link. `west` and `north` each consume `analytics` via the gateway, so they get a third controller for the `east-gw` link; `east` doesn’t consume its own analytics, so it only needs two.
Then we generate the links. Flat/federated links use `–gateway=false`; the gateway-aware link to `east` (for the analytics export) is a separate link named `east-gw`:
```bash
# Flat links (no gateway) — for federated + flat-mirrored services
linkerd --context east multicluster link-gen --cluster-name=east --gateway=false \
  | kubectl --context west apply -f -
linkerd --context west multicluster link-gen --cluster-name=west --gateway=false \
  | kubectl --context east apply -f -
# ... (all six directions)

# Gateway-aware link from east (for the analytics hierarchical export)
linkerd --context east multicluster link-gen --cluster-name=east-gw \
  | kubectl --context west apply -f -
linkerd --context east multicluster link-gen --cluster-name=east-gw \
  | kubectl --context north apply -f -
```
After this, `linkerd multicluster check` on any cluster should report every linked cluster healthy.
Step 4: Deploy the demo services
Deploy the demo workloads. The next sections label them for federation, flat mirroring, and gateway mirroring and show what each mode creates.
```bash
./scripts/04-deploy-app.sh
```
Three services, three modes, and deliberately the same `buoyantio/bb` image for all of them, a tiny HTTP server that echoes a fixed string. The application isn’t the point. The point is that one `kubectl label` changes how Linkerd treats the service across clusters, with everything else held constant.
frontend (federated)
Deploy to all three clusters with a per-cluster response string, then labeled for federation:
```bash
for ctx in west east north; do
  kubectl --context $ctx -n mc-demo label svc/frontend mirror.linkerd.io/federated=member
done
```
Within a few seconds, `frontend-federated` shows up in all three clusters:
```bash
$ kubectl --context west -n mc-demo get svc
NAME                 TYPE        CLUSTER-IP     PORT(S)    AGE
frontend             ClusterIP   10.104.1.50    8080/TCP   45s
frontend-federated   ClusterIP   10.104.2.100   8080/TCP   10s
```
api (flat-mirrored)
Label the api service in `west` and `east` for flat export:
```bash
kubectl --context west -n mc-demo label svc/api mirror.linkerd.io/exported=remote-discovery
kubectl --context east -n mc-demo label svc/api mirror.linkerd.io/exported=remote-discovery
```
Now `north` can see `api-west` and `api-east` as separate services:
```bash
$ kubectl --context north -n mc-demo get svc
NAME                 TYPE        CLUSTER-IP      PORT(S)    AGE
frontend             ClusterIP   10.120.1.50     8080/TCP   45s
frontend-federated   ClusterIP   10.120.2.100    8080/TCP   10s
api-west             ClusterIP   10.120.3.20     8080/TCP   5s
api-east             ClusterIP   10.120.3.21     8080/TCP   5s
```
The client in `north` picks `api-west` or `api-east` explicitly. Traffic will go straight to the remote pods with no gateway in the path.
analytics (gateway-mirrored)
Next, deploy only to `east`, labeled for hierarchical (gateway) export:
```bash
kubectl --context east -n mc-demo label svc/analytics mirror.linkerd.io/exported=true
```
This creates `analytics-east-gw` in `west` and `north`, routed through east’s Linkerd gateway:
```bash
$ kubectl --context west -n mc-demo get svc analytics-east-gw
NAME               TYPE        CLUSTER-IP     PORT(S)    AGE
analytics-east-gw  ClusterIP   10.104.5.10    8080/TCP   5s
```
The endpoints for this service point at east’s gateway IP, not the analytics pods directly. That’s the right trade when you can’t guarantee flat-network connectivity, or when you specifically want the gateway handling load balancing and mTLS termination.
Step 5: Verify all three modes
Generate traffic against all three service patterns and verify that each resolves the way you expect.
```bash
./scripts/05-verify.sh
```
This deploys a traffic generator in `north` that hits all three service patterns in a loop and tails the logs. The response strings come straight from the deployments, so you’ll see which cluster served each request:
```
[federated]  frontend from east
[federated]  frontend from west
[federated]  frontend from north
[flat-west]  api from west
[flat-east]  api from east
[gateway]    analytics from east
```
You can also inspect endpoints to see how differently each mode resolves:
```bash
# Federated: endpoints span all three clusters
$ linkerd --context west diagnostics endpoints frontend-federated.mc-demo.svc.cluster.local:8080
NAMESPACE   IP            PORT   POD                        SERVICE
mc-demo     10.100.1.15   8080   frontend-xxx-west          frontend.mc-demo
mc-demo     10.108.0.42   8080   frontend-xxx-east          frontend.mc-demo
mc-demo     10.116.0.33   8080   frontend-xxx-north         frontend.mc-demo

# Flat mirror: endpoints are the remote pod IPs
$ linkerd --context north diagnostics endpoints api-west.mc-demo.svc.cluster.local:8080
NAMESPACE   IP            PORT   POD                        SERVICE
mc-demo     10.100.2.10   8080   api-xxx-west               api.mc-demo

# Gateway mirror: the endpoint is east's gateway IP on port 4143
$ kubectl --context west -n mc-demo get endpoints analytics-east-gw
NAME               ENDPOINTS             AGE
analytics-east-gw  35.186.xxx.xxx:4143   30s
```
Three modes, one mesh, one set of clusters, and the only difference between them is a label.
Step 6: The chaos test, kill a cluster
This is where federation earns its keep. We simulate a full cluster failure and watch how each service type reacts.
```bash
./scripts/06-chaos-test.sh
```
The script scales every deployment in `east` to zero replicas (standing in for a cluster outage), then samples traffic from `north` across all three patterns.
Traffic redistributes immediately. No errors, no config changes. As east’s pods drop out of the endpoint list, Linkerd’s load balancer simply spreads requests across what’s left.
Flat-mirrored service (`api-east`):
```
Before:  api-east responds normally
After:   api-east returns 503s           ← expected: the remote pods are gone
```
This is the correct behavior. The client explicitly asked for `api-east`, and east is down. Handling that is the client’s job: fail over to `api-west`, retry, or front the two with a TrafficSplit. Mirroring hands you control; federation hands you automation.
Gateway-mirrored service (`analytics-east-gw`):
```
Before:  analytics-east-gw responds normally
After:   analytics-east-gw returns 502s  ← the gateway is down too
```
Same story here, the client asked for a specific remote, and that remote is gone.
Bring east back:
```bash
kubectl --context east -n mc-demo scale deploy --all --replicas=1
kubectl --context east -n mc-demo scale deploy/frontend --replicas=3
```
(The script restores `frontend` to its full `FRONTEND_REPLICAS` count rather than leaving it at 1, otherwise east would rejoin the federation under-weighted, landing around 14% instead of an even third.) Within 15–30 seconds all three patterns recover: the federated service rebalances back to 33/33/33, and the mirrored services start answering again.
The lesson worth carrying out of this: federation is the right default for anything that should simply be available everywhere. Mirroring, flat or gateway, is the right call when the client genuinely needs to know which cluster it’s talking to.
Step 7: Teardown
When you’re finished with the demo, run the teardown script to remove all the infrastructure and avoid ongoing GCP charges.
```bash
./scripts/99-teardown.sh
```
This removes all three clusters, the VPC peerings, subnets, firewall rules, and VPCs created by the earlier steps. Run it when you’re done so the meter stops.
Selecting your Linkerd multicluster architecture strategy
After running all three side by side, here’s the decision framework I’d hand a teammate:
Question
→ Mode
Should the client be cluster-agnostic?
Federated
Does the client need to pick a specific cluster?
Flat mirror
Is there no flat network between clusters?
Gateway mirror
Do you need automatic failover with no app changes?
Federated
Do you need traffic splitting with explicit weights?
Flat mirror + TrafficSplit
Is the service a singleton (only in one cluster)?
Mirror (flat or gateway)
And you can mix them freely in the same mesh. The label on each service decides its behavior independently of the others.
Linkerd multicluster gotchas and configuration lessons
The gotchas that cost us time and don’t jump out of the docs:
VPC peering route exchange. Creating the peering isn’t enough. You have to pass `–export-custom-routes` and `–import-custom-routes` on both sides, or the pod CIDRs never get advertised. The symptom is brutal to diagnose: DNS resolves fine, then connections just hang. Maddening to debug.
Regional clusters multiply your nodes. A regional cluster with `–num-nodes 1` quietly gives you three nodes (one per zone). We pin `–node-locations` to a single zone to keep it at one. Easy to miss until the bill arrives.
Overlapping CIDRs. GKE auto-allocates large ranges out of the `10.0.0.0/8` space by default, and three clusters built with defaults will overlap, at which point peering fails silently. Always set explicit, non-overlapping `–cluster-ipv4-cidr` and `–services-ipv4-cidr`.
Controller count matters. Each cluster needs one service-mirror controller per link it consumes. Miss one and the Link CR is created, but nothing mirrors, and `linkerd multicluster check` still looks green, so you’ll stare at it for a while before the penny drops.
Federated service naming is fixed. The federated service is always `<svc>-federated`; you can’t change the suffix. Clients have to target `frontend-federated`, not `frontend`. Plan your naming around it, or use a TrafficSplit to point `frontend` at `frontend-federated`.
Gateway and flat can’t share one link. A single Link CR is either gateway or flat, not both. To get both behaviors to the same cluster you create two links with different names. That’s why our setup uses `east` (flat) and `east-gw` (gateway) as separate links, with a matching controller for each on the consuming clusters.
Production checklist
Bidirectional links between all clusters (full mesh) so every cluster has the federated service
cert-manager with a shared CA instead of hand-rolled `step` certificates
Separate issuer certs per cluster (don’t skip it!)
NetworkPolicies restricting cross-cluster traffic to only the services that need it
Linkerd authorization policies for fine-grained access control
Monitoring: pipe Linkerd-Viz metrics into your Prometheus/Grafana stack, and alert on a federated service’s endpoint count dropping
GitOps: keep Link CRs and multicluster config in version control
Test failover regularly: scale a cluster to zero in staging and confirm traffic redistributes
The docs show each multicluster mode in isolation; real platforms need all three at once. Federation covers the common case: The same service everywhere, automatic failover, and nothing to change in the app. Flat mirrors give you explicit, cluster-aware routing when data locality matters. Gateway mirrors get you cross-cluster reach when a flat network isn’t on the table.
What surprised me most about building this is how little of it is genuinely complex. It’s mostly wiring. Once the trust anchor is shared and the links are up, adding a service to the federation is a single `kubectl label`, and removing a cluster is as simple as letting it go down. The mesh adjusts on its own.
For teams running across regions, that’s a real chunk of operational toil gone: your services run everywhere, traffic finds the healthy copies, and you pick the multicluster mode per service based on what that service actually needs.
As we all know, AI is advancing from generative AI to agents, driving growing demand for scalable, efficient infrastructure. Kubernetes and the broader Cloud Native ecosystem are becoming increasingly critical foundations for modern AI workloads.
To bring together Japan-local engineers, researchers, and platform builders to share best practices, operational experiences, and emerging technologies for Cloud Native AI infrastructure, Cloud Native Community Japan (CNCJ)is launching AI Infra SIGunder the CNCF Japan chapter.
In this post, we introduce the motivation behind the AI Infra SIG, its mission, and the FIRST meetup—along with an open call for speakers.
Why We Are Launching the AI Infra SIG
The emergence of infrastructure challenges for AI workloads.
The Cloud Native ecosystem has historically evolved around web applications and microservices. These workloads are typically stateless, CPU- and memory-oriented, and exhibit relatively predictable traffic and scaling patterns.
Modern AI workloads, however—particularly those powered by LLMs and AI agents—present a new set of infrastructure challenges with heavy dependence on specialized hardware, complex distributed processing and orchestration, and unique traffic and scaling characteristics.
To address these challenges, the Kubernetes community has been actively advancing its vision of AI Readiness, introducing new capabilities, projects, and standards for AI-native infrastructure.
Japan is also home to a growing community of practitioners, contributors, and organizations actively working in this space.
Many engineers from Japan are already involved in open source projects and community discussions across the Cloud Native AI ecosystem.
At the same time, innovation is extending well beyond Kubernetes and CNCF. Across the broader Linux Foundation ecosystem, AI and agent technologies are rapidly emerging as major areas of community-driven development.
ThePyTorch Foundation has become a hub for open-source AI innovation, supporting projects such as PyTorch and vLLM, while theAgentic AI Foundationhas brought together communities working on open standards and interoperability across the rapidly evolving AI agent ecosystem.
These developments are not limited to global communities. Japan has an active and growing ecosystem of engineers, researchers, and open-source contributors participating across CNCF, the PyTorch Foundation, the Agentic AI Foundation, and other Linux Foundation projects. Events such as AGNTCon + MCPCon Japan 2026 further highlight the growing momentum around Cloud Native AI and Agentic AI technologies within Japan.
As innovation, we believe there is a unique opportunity to strengthen collaboration within Japan while connecting local practitioners to the broader global open-source ecosystem. This is one of the key motivations behind launching the CNCJ AI Infra SIG.
Mission and Activities
The CNCJ AI Infra SIG aims to bring together engineers, researchers, and platform builders who are shaping the future of AI infrastructure on Cloud Native technologies.
Our mission is to:
Share optimization techniques, operational best practices and real-world experiences for building and operating AI infrastructure and workloads.
Strengthen Japan’s engagement with upstream open-source projects and contribute back to the broader AI-related Cloud Native and Linux Foundation ecosystems.
To achieve these goals, the AI Infra SIG will organize regular community activities to facilitate knowledge sharing and collaboration around Cloud Native AI infrastructure, including:
Meetups covering practical experiences, emerging technologies, and updates from upstream communities.
Collaborative events with companies, research institutions, and broader open source communities across the Linux Foundation ecosystem, including the PyTorch Foundation and Agentic AI Foundation.
The AI Infra SIG welcomes discussions and contributions across the Cloud Native AI infrastructure ecosystem, including but not limited to:
To celebrate the launch of the SIG, we are delighted to invite you to our first meetup, themed “Let’s Get Started with the CNCJ AI Infra SIG — Where Are We Today?”
Together, we’ll explore the current landscape of Cloud Native AI infrastructure and discuss the latest developments across Kubernetes, CNCF, and the broader open-source ecosystem.
Date: October 1, 2026
Time: 18:00–21:00 JST
Venue: Seminar Room, 17F Garden Terrace Kioicho (with live stream)
Call for Speakers: We’d also love to hear from practitioners, researchers, and contributors working on AI infrastructure, platforms, and open source projects. If you have experiences, insights, or emerging ideas to share, please consider submitting a session proposal or lightning talk.
Get Involved
The CNCJ AI Infra SIG is open to anyone interested in Cloud Native AI infrastructure—from engineers and platform builders to researchers, operators, and open-source contributors.
There are many ways to participate:
🎤 Submit a talk proposal and share your experiences, insights, or lessons learned.
Whether you’re running AI workloads in production, contributing to upstream projects, exploring new technologies, or just getting started, we’d love to have you join us.
We look forward to seeing your proposals and welcoming you to the CNCJ AI Infra SIG community!
CNCJ AI Infra SIG発足のお知らせ & 第1回 Meetup 開催・スピーカー募集開始!
本記事は, Shingo Omura, Principal Architect of AI Infrastructure, LY Corporation, Sunyanan Choochotkaew (Pang), CNCF Ambassador, Senior Research Scientist, IBM Research – Tokyoによって執筆されました。
このような大きな技術変革のうねりを受け、このたびCloud Native Community Japan (CNCJ)に、AI/機械学習ワークロードを動かすためのベストプラクティスや最適化、現場の実践知の共有にフォーカスした新しいコミュニティAI Infra SIG (Special Interest Group)を立ち上げます!
このAI Infra SIGは、最先端を追いかけるだけの場ではありません。国内のエンジニアやプラクティショナーが直面している課題や実践知を共有し体系化していく場になっていけば良いなと思っています。そしてCNCFやLinux Foundationのアップストリームへと還元を促進していけたら良いなとも思っています。
Running a database on Kubernetes is well understood. Running one that survives a complete regional failure, a corrupted control plane, or a severed network requires a fault-resistant architecture. This post walks through how to build a multi-cluster MongoDB deployment on Kubernetes that can withstand those failures. We will use thePercona Operator for MongoDB, an open-source Apache 2.0 Licensed Kubernetes Operator, as our example. For relational workloads, similar patterns are available through projects like Vitess and CloudNativePG.
If you are new to multi-cluster MongoDB on Kubernetes, Ivan Groenewold’s post is a great place to start. It walks you through a complete multi-cluster setup you can follow hands-on.
Single Point of Failure: The risk of a single-cluster setup.
Standard Kubernetes excels at self-healing within a single cluster, automatically recovering from crashed Pods or failed Nodes. However, it has no built-in mechanism to handle failures at the cluster level itself: a regional outage, a corrupted control plane, or a network partition can take down your entire database with no automatic recovery path.
Distributing MongoDB nodes across separate Kubernetes clusters addresses this gap and enables three core scenarios:
Disaster Recovery (DR): If an entire region goes down, nodes in a secondary cluster already hold a full copy of the data and enough votes to elect a new Primary and resume writes automatically.
Live Migrations: Running nodes across two clusters lets you shift application traffic gradually between environments, for example, during a cloud provider migration, without taking the database offline. Note that coordinating a clean cutover still requires careful application-level planning around connection strings and write consistency.
Maintenance without Stopping: You can drain and upgrade one cluster entirely while the database continues accepting writes through the nodes in the remaining cluster, with no scheduled downtime.
Architecture Overview
To manage the complexity of multi-cluster deployments, the architecture divides clusters into two roles, ensuring that Kubernetes-level operations (handled by the Operator) and database-level operations (handled by MongoDB) do not interfere with each other. All nodes, regardless of which cluster they run in, belong to a single MongoDB replica set, which is what enables cross-cluster voting and leader elections.
1. Defining Site Roles
Each cluster is assigned to one role to prevent conflicts between independent Kubernetes control planes:
Main Site: The primary cluster, fully managed by the Operator. It holds the Primary node and handles application writes. The Operator here is responsible for provisioning TLS certificates, user credentials, and replica set configuration.
Replica Site: The Operator runs with unmanaged mode to true, which means it does not generate certificates or user credentials, and does not attempt to initialize a new replica set. Instead, the user needs to copy TLS secrets and credentials from the Main Site, allowing the Replica Site nodes to authenticate and join the existing replica set. This prevents the problem where two independent operators attempt to control the same database simultaneously.
2. Connecting Clusters with the MCS API
Even though each Kubernetes cluster runs an independent control plane, the MongoDB replica set spans across all of them. The Kubernetes Multi-Cluster Services API (MCS API) makes this possible. When multiCluster.enabled: true is set, the Operator creates ServiceExport and ServiceImport resources so nodes in different clusters can discover and communicate with each other via a shared DNS zone (svc.clusterset.local).
Note that the MCS API is not included in a standard Kubernetes installation and requires a separate implementation such as Submariner, Cilium ClusterMesh, or a managed provider solution like GKE’s native MCS.
To enable multi-cluster service discovery with the Percona Operator for MongoDB, set multiCluster.enabled: true in your cr.yaml:
apiVersion: psmdb.percona.com/v1

kind: PerconaServerMongoDB

metadata:

  name: main-cluster

spec:

  crVersion: 1.23.0

  image: perconalab/percona-server-mongodb-operator:main-mongod8.0

  imagePullPolicy: Always

  updateStrategy: SmartUpdate

    multiCluster:

      enabled: true  # <---  Enable multi-cluster service discovery

      DNSSuffix: svc.clusterset.local  # <--- The Global DNS standard
After applying the configuration, verify that the Operator created the ServiceExport resources. Note that it takes approximately five minutes for resources to sync across the fleet. This is how it looks:
kubectl get serviceexport

NAME                     AGE

main-cluster-rs0    6m

main-cluster-rs0-0  6m

main-cluster-rs0-1  5m
The Main Site (Cluster A) runs the Primary node and is fully managed by the Operator. The Replica Site (Cluster B) holds Secondary nodes in unmanaged mode. ServiceExport and ServiceImport resources bridge the two clusters via a shared svc.clusterset.local DNS zone, enabling cross-cluster replica set membership.
Image 1: Multi-cluster MongoDB deployment using the Kubernetes MCS API.
How to Design for High Availability
Before choosing how to distribute clusters, it helps to understand how MongoDB itself decides which node is in charge.
A MongoDB replica set requires a strict majority of its voting members to elect a Primary and accept writes. With four voting members spread equally across two locations, neither side can reach a majority if the network between them is severed, and both sides stop accepting writes, even if every server is healthy.
The solution is a fifth member, placed in a third location. With 5 total votes, one side reaches 3 votes; a majority, and elects a new Primary. This is the 2+2+1 pattern.
Image 2: The following image is in a Normal State with no Network Partition
Image 3: After Network Partition
Have an odd number of MongoDB voting members, placed in different locations, so that if one location or network link fails, one side can still have enough votes to keep/elect a Primary.
With the Percona Operator for MongoDB, the 2+2+1 pattern is configured directly in cr.yaml. Start by defining the total number of data-bearing replica set members across both sites:
replsets:

 - name: rs0

   size: 2        # 2 nodes in Main Site + 2 nodes in Replica Site

   expose:

     enabled: true

     type: ClusterIP
…
Then add the extra member as a separate entry under the same externalNodes section:
The following steps deploy the 2+2+1 pattern across two Kubernetes clusters using the Main and Replica site roles described above.
Connect the Networks: Set up cross-cluster network connectivity using Cilium ClusterMesh, Submariner, or your cloud provider’s native solution (such as GKE Fleet). This is a prerequisite; the MCS API requires an implementation to be installed before the Operator can create functional ServiceExport and ServiceImport resources.
Deploy the Main Site: Deploy the Operator and apply your cr.yaml on the primary cluster. Ensure replica set pods are exposed with type: ClusterIP, this is required by the MCS API since nodes communicate internally across clusters. See the Main Site configuration guide.
Copy the Secrets: The Main and Replica sites must share the same TLS certificates and user credentials to communicate. Run kubectl get secrets on the Main Site to confirm the exact names in your deployment.
Deploy the Replica Sites: Start the remote clusters, but remember to set their operators to “unmanaged” mode. This tells the nodes to join the existing database instead of trying to create a new one.
apiVersion: psmdb.percona.com/v1

kind: PerconaServerMongoDB

metadata:

  name: replica-cluster

spec:

  # ----------------------------------------------------

  # This tells the Operator NOT to start a new database,

  # but to join the existing one to prevent split-brain.

  # ----------------------------------------------------

  unmanaged: true

  multiCluster:

    enabled: true

    DNSSuffix: svc.clusterset.local
Finalize the Replica Set: Update cr-main.yaml on the Main Site to add the Replica Site nodes as externalNodes. Two nodes are added as voting members with lower priority, and the third as a non-voting member, this prevents split-brain if the Replica Site loses connectivity.
Repeat this step on the Replica Site, adding the Main Site nodes as externalNodes in cr-replica.yaml. Please check the interconnect guide if you want to see a full configuration.
Once these steps are complete, the replica set spans both clusters and is ready for the failover behavior described in the next section.
Failover Behavior: The Election Process
MongoDB’s replica set protocol includes built-in failure detection and automatic leader election. If the Primary node goes offline, whether a single pod crashes or an entire region is down, the remaining nodes automatically elect a new Primary without any operator or human intervention.
Let’s look back at our 2+2+1 setup. To stay online, the database needs a strict majority (3 out of 5 votes). If Cluster A completely fails, the two nodes in Cluster B plus the node at Cluster C give us exactly the 3 votes we need to choose a new Primary.
Under the default configuration, the median time before a cluster elects a new primary does not typically exceed 12 seconds; this includes the time to detect the failure and complete the election. In a multi-region setup, cross-cluster network latency may extend this window, so your application connection logic should include retryable writes to handle the brief period during which no Primary is available. The electionTimeoutMillis setting can be tuned if your latency requirements demand faster detection.
Architecture After Failover
After a regional failure, your database is still working, but it enters a “degraded” state. This means it is functioning, but with fewer resources than normal.
The New Primary: A node in Cluster B is promoted to be the new leader and starts accepting new data.
Less Redundancy: Your database is now running with the exact minimum number of nodes needed for a majority. In our 2+2+1 setup, you are surviving on just those 3 remaining members.
Reduced Fault Tolerance: Even though your application survived the crash of Cluster A, your safety margin is completely gone. If you lose just one more node in Cluster B or the node at Cluster C, the database will lose its majority and lock into “read-only” mode.
Image 4: Failover in a multi-cluster MongoDB deployment using the Kubernetes MCS API
The replica set detected the failure, held an election, and promoted a new Primary, automatically, without human intervention. That is the 2+2+1 pattern working as designed. In a follow-up post, we will put this architecture under deliberate pressure with chaos engineering experiments to measure exactly how it holds under real failure conditions.
This blog post was reviewed by Chetan Shivashankar, Technical Lead, Kubernetes at Percona.
Here are some resources you can review to learn more about the topic.
When we first started building kagent, we didn’t run every agent in its own Kubernetes Pod, Service, and ServiceAccount. Instead, agents were simply executed inside the kagent runtime. It was the simplest architecture possible: one runtime hosting many agents.
It worked well for demos and proofs of concept.
As the number of agents grew, however, fundamental questions started to emerge.
How do we isolate one agent from another?
How does each agent get its own identity?
How do we enforce access and network policies?
How do we understand what an individual agent is doing?
Who owns an agent, and how do we support multi-tenancy?
These aren’t Kubernetes questions. They’re agent platform questions.
The Pod as the Deployment Unit
Our first answer was straightforward: run every agent in its own Pod, Service, and ServiceAccount.
That decision immediately solved many of our problems.
A Pod provides process and container isolation. A ServiceAccount gives every agent its own Kubernetes identity, allowing us to integrate naturally with authentication and authorization mechanisms. Existing network policies, admission policies, and security controls continue to work without modification. Observability systems can attribute logs, metrics, and traces to individual agents. Scheduling and resource management also became Kubernetes-native.
As the architecture evolved, we introduced stronger isolation mechanisms such as agent-sandbox in kagent, allowing agents to execute with tight security boundaries.
For a while, this felt like the right abstraction.
But Should Agents Be Best Represented as Pods?
The more we thought about agents, the more we realized they are quite different from traditional microservices.
Most services are expected to be continuously available.
Agents are not.
An agent may wake up only when assigned a task, execute for a few seconds or minutes, and then become completely idle. Keeping a dedicated Pod alive for every potential agent quickly becomes wasteful.
Agents also have execution patterns that don’t resemble long-running services:
An agent may dynamically create multiple subagents to perform certain subtasks in parallel.
An agent may impersonate a user or execute on behalf of a human.
An agent may pause while waiting for human approval before continuing.
An agent’s lifetime may be measured in seconds or minutes rather than days.
These characteristics naturally lead to a question:
Are Kubernetes Pods the right lifecycle abstraction for short-lived, bursty AI agents?
Pods are excellent execution environments. But that doesn’t necessarily mean they should also be the right abstraction for AI agents.
Enter Agent-substrate
Instead of treating every agent as a first-class Kubernetes workload, agent-substrate introduces an additional control plane above Kubernetes. Kubernetes continues to manage Pods, Services, networking, storage, and compute resources, while agent-substrate manages the lifecycle and placement of AI actors onto execution workers.
Agent-substrate introduces a set of abstractions that are similar to the Kubernetes concepts we are already familiar with. A WorkerPool is analogous to a NodePool, Workers are analogous to Nodes, and ActorTemplates correspond to the declarative specification of a Pod.
Let’s look at what this abstraction looks like in practice. A WorkerPool defines a collection of execution workers that can host Actors. Example of the default WorkerPool in kagent:
An ActorTemplate defines how an Actor should execute, much like a PodTemplate defines how a Pod should be created. Below is an example of a simple ActorTemplate in kagent. Note that it includes the runsc configuration, which serves as the execution entrypoint for gVisor. I omitted several kagent-specific fields, including the agent’s name and additional configuration details.
The Worker or Actor is not represented as a custom resource in Kubernetes. Kubernetes only sees WorkerPools and ActorTemplates. Agent-substrate, however, sees Workers and Actors. This separation allows the cluster to manage a fixed number of execution Pods while agent-substrate manages a much larger number of logical agents. You can use the substrate CLI or API to view them directly. Each Worker is mapped to a single unique Pod.
$ kubectl-ate get workers
NAMESPACE   POOL             POD                                         STATUS   ASSIGNED ACTOR
kagent      kagent-default   kagent-default-deployment-ddfcfbdd7-54pb7   FREE     <none>
kagent      kagent-default   kagent-default-deployment-ddfcfbdd7-jmjl5   FREE     <none>
kagent      kagent-default   kagent-default-deployment-ddfcfbdd7-z2mmh   FREE     <none>

$ kubectl-ate get actors
NAMESPACE   TEMPLATE                  ID                                                                STATUS             ATEOM POD   ATEOM IP   VERSION
kagent      hello-substrate           a786a0c4-c2c8-44e5-9ea5-67b64f41deb1                              STATUS_SUSPENDED   <none>                 5
kagent      hello-substrate           asr-kagent-hello-substrate-019efbb5-cc48-7601-8fc6-985e6239aa05   STATUS_SUSPENDED   <none>                 5
kagent      hello-substrate-linsun    0c82223d-cc14-40c8-a25c-5ee00fe153ae                              STATUS_SUSPENDED   <none>                 5
kagent      hello-substrate-linsun3   asr-ce96fc0ee592bf1e12336461                                      STATUS_SUSPENDED   <none>                 5
The important distinction is that an Actor, which represents (“acts as”) an AI agent, is no longer itself a Kubernetes Pod.
Instead, an Actor is a logical entity that can be scheduled onto an agent-substrate Worker when work arrives and removed when execution completes. Workers remain long-running Pods managed by Kubernetes, while Actors are lightweight execution units that share those workers.
This abstraction allows us to continue leveraging Kubernetes for pod and service scheduling, networking, security, and resource management while supporting far more AI agents than the cluster could ever support as individual Pods.
In other words, Pods become the execution workers, not the deployment model for agents.
Challenging More Than Deployment Model
At first glance, agent-substrate may look like a more efficient scheduling layer.
In reality, it challenges a much deeper assumption: should a Pod be the primary representation of an AI agent at all?
Agent Identity
Should an agent’s identity really be tied to a Pod or its Service?
Or should identity belong to the ActorTemplate, namespace, tenant, and version, independent of whichever Worker happens to execute the Actor at a given moment? Christian Posta tried to explore this topic much deeper in his blog.
Security and Policy
Today, Kubernetes policies are attached to Pods, Services, or ServiceAccounts.
Should access control, network policy, and runtime permissions instead be expressed at the ActorTemplate level and selectively overridden for individual Actors? Can we use agentgateway to mediate the traffic and enforce policies?
Ownership and Multi-tenancy
Who owns an Actor?
Who owns an ActorTemplate?
How are quotas, billing, and lifecycle managed across teams and tenants when AI agent execution is no longer tied one-to-one with Pods?
Observability
When an Actor executes on different Workers over its lifetime, observability must follow the logical agent, not the underlying Pod.
Logs, traces, audit records, and execution history should all be associated with the Actor regardless of where it was scheduled.
Looking Ahead
Kubernetes remains an exceptional platform for running microservices and inference workloads at scale.
But AI agents introduce more unique characteristics than traditional cloud-native services. They are ephemeral, bursty, capable of spawning subagents on demand, and often act on behalf of users. The Pod may still be the right execution unit for AI agents, but it may no longer be the right deployment, identity, or lifecycle unit.
That is the question agent-substrate is exploring. Explore the agent-substrate project through kagent, join the agent-substrate community, and feel free to connect with me on LinkedIn.
As more organizations move to use OpenTelemetry in production at scale, with multiple Collectors across heterogeneous environments, a new challenge arises: how to remotely manage, configure, and update this agent fleet in a consistent and secure way?
This is where Open Agent Management Protocol (OpAMP) comes into the picture: it provides a standardized protocol that lets a central backend automatically configure agents, push updates, monitor their health, and collect status information.
In a recent episode of OpenObservability Talks, I sat down with Andy Keller, OpAMP maintainer and Principal Engineer at BindPlane, to hear what OpAMP is and how it makes large-scale observability deployments much easier to operate and control. We also covered project status and roadmap, including a hot KubeCon update you don’t want to miss.
OpenObservability Talks: Operating OpenTelemetry at Scale with OpAMP
Why OpAMP: The management challenge at scale
As OpenTelemetry adoption has exploded, organizations are finding themselves managing increasingly complex collector deployments. Before OpAMP, the landscape was fragmented and challenging. Andy shared their journey: “We probably developed in-house three, four, maybe five different agent management protocols. Some were HTTP-based, long polling. We used WebSockets. We used protobufs. We used JSON.”
The problem becomes acute when you consider the scale and variety of deployments. We’re not just talking about a handful of collectors — organizations are deploying collectors everywhere from massive gateways to embedded devices. Each deployment model brings its own management challenges, and the teams responsible for deploying collectors are often different from the observability teams who need to configure them. This disconnect creates operational friction that can undermine your entire observability strategy.
Scale and variety of OTel Collector deployments
I found the sub-story about the diversity of OpenTelemetry collector deployments staggering. “We see anything from a couple massive OpenTelemetry gateways where really what you’re doing is managing the configuration of the gateway and doing all the processing there,” said Andy, “but then we also even see people deploying collectors to embedded devices. We have collectors in point of sale machines. We have collectors on laptops collecting Windows events for security tracking.”
The scale ranges from dozens to millions of collectors. When you factor in IoT and embedded use cases, the numbers become truly massive. As Andy noted, when you get into the embedded space, it gets to millions of collectors that you need to start reasoning about.
What is the Open Agent Management Protocol (OpAMP)
OpAMP (Open Agent Management Protocol) is a standardized protocol that provides remote management capabilities for observability agents, primarily the OpenTelemetry Collector (which is why it resides under the OpenTelemetry project). It enables central backends to automatically configure agents, push updates, monitor their health, and collect status information — all in real-time over WebSocket or HTTP connections.
Managing OpenTelemetry Collectors with OpAMP. Source: opentelemetry.io
What’s particularly interesting is how OpAMP has evolved beyond simple configuration management. As Andy explained: “It started to really focus on configuration management and with agent health and component health and things like that, really moving into this observability for your observability realm. Because observability is something that is so critical to operations that you need to know is your observability actually working?”
To me, this evolution reflects a crucial insight: your observability infrastructure is too important to be a black box. You need observability for your observability. OpAMP addresses this by providing real-time visibility into collector health, configuration drift, and operational status. There was a great talk at last year’s KubeCon North America 2025, in which Nike’s observability platform engineers shared how they built an enterprise-grade implementation of OpAMP for their scale and use case.
OpAMP protocol and components
OpAMP, as the name suggests, is first and foremost a network protocol specification, used to remotely manage large fleets of data collection Agents. The protocol is elegantly simple: just two messages — server-to-agent and agent-to-server — defined using Protocol Buffers. The specification lives in the opamp-spec repository under OpenTelemetry, while opamp-go provides the reference implementation in Go.
The architecture includes several key components. The OpAMP extension is a read-only component that reports current configuration and health status. The OpAMP supervisor sits as a separate process alongside the collector, implementing both read and write capabilities. As Andy described it: “It kind of sits between the management platform and the collector. It speaks to the collector on behalf of the management platform, and it can accept changes.”
The supervisor’s approach is particularly clever — it writes new configurations to disk, shuts down the collector, and restarts it with the new configuration. Critically, it includes safety mechanisms: “If it doesn’t start, it will revert the config and run with the last known good config so that we’re not breaking your telemetry pipelines remotely.”
Supervisor-based management with OpAMP. Source: gihub.com/open-telemetry
Beyond OTel Collector: OpAMP for Kubernetes, SDKs and more
What makes OpAMP powerful is its protocol-level flexibility. The configuration payload is intentionally generic — just a map of name-value pairs. This allows OpAMP to manage not just OpenTelemetry collectors, but any type of agent. In fact, it’s already used to manage SDKs and Kubernetes deployments.
To manage Kubernetes deployments, OpAMP utilizes the OpAMP Bridge, which acts as an intermediary between OpAMP-speaking management platforms and Kubernetes-native deployment mechanisms. Andy explained the architecture: “rather than communicating with [OTel] Collectors, you’re communicating with this OpAMP Bridge. The OpAMP Bridge is communicating within the cluster with the OpenTelemetry Operator, and that Operator reads CRDs and deploys Collectors.”
Andy mentioned that the OpenTelemetry Java SDK can also speak OpAMP and receive remote configuration. The use cases are compelling: imagine remotely adjusting sampling rates across your entire microservices architecture to investigate an issue, or enabling debug logging for specific services without redeploying. Reconfiguring SDKs, however, requires a different operational model, as we can’t shut down applications to reconfigure the SDK. SDKs require hot-reloading capabilities rather than the restart-based approach used for collectors.
Another interesting use case is managing a fleet of Fluent Bit agents. This brand-new project was recently open-sourced these days by Phil Wilkins, with Fluentd support planned next. Check out the GitHub repo and Phil’s blog post for more details.
The protocol’s agent-agnostic design is intentional. The remote config message is just a map of name-value pairs, where that value can be anything. This flexibility means OpAMP can manage security agents, custom telemetry collectors, or any other agent-based software. The protocol defines the communication contract, but doesn’t dictate what agents do with the configuration they receive.
Hot off the press: OpAMP Gateway Extension
One of the most exciting developments is the upcoming OpAMP Gateway Extension launching these days around KubeCon Europe 2026. This addresses a critical scaling challenge: WebSocket connection limits.
Andy described the problem and solution: “Let’s say I’ve got 100,000 collectors deployed across my many different clusters in my organization, instead of all the 100,000 [collectors] connecting to the management platform, I can deploy 100 OpAMP gateways, have 1,000 collectors connect to each one, and then those 100 connect to the management platform.”
The OpAMP Gateway is an OpenTelemetry Collector extension. It runs inside a collector and acts as a multiplexer, aggregating OpAMP messages from thousands of edge collectors and relaying them through a smaller number of upstream connections. You can think about it as similar to how OpenTelemetry gateways work for telemetry data, but for the control plane.
The benefits are substantial: reduced connection overhead on management platforms (i.e., OpAMP Server), support for network-segmented environments where edge collectors can’t directly reach external management systems, and more efficient use of network resources. For organizations operating at IoT scale — millions of collectors — the gateway becomes essential infrastructure. The OpAMP Gateway Extension is launched in Alpha, check out the launch blog for more details.
OpAMP roadmap
OpAMP is currently in beta, with different components at varying maturity levels, and the community is actively working toward stability.
Configuration diff support is another priority — sending only configuration changes rather than complete configurations becomes critical when dealing with large, complex collector configurations. There’s also significant interest in true hot-reloading capabilities that wouldn’t require collector restarts.
Perhaps most intriguing is the telemetry policy OTEP (OpenTelemetry Enhancement Proposal) currently in draft. This would introduce policy as a concept distinct from configuration — communicating intent (like “filter out these log messages” or “add this attribute”) rather than specific implementation details. The SDK and collector could then implement the same policy differently based on their capabilities.
Andy expects additional SDKs to support OpAMP, expanding remote management capabilities to more languages and platforms.
The agentic AI space is moving incredibly fast. Not long ago, I learned about a cool project called agent-sandbox, which provides a sandboxed environment for AI agents by leveraging many of the building blocks we have already developed for Kubernetes pods, such as identities, storage and networking.
If you’ve ever read the horror stories about AI coding agents or followed projects like OpenClaw & NemoClaw, you know how important it is to provide a secure and isolated environment for your agents. Without proper isolation, agents can surprise you by doing things you never intended, such as deleting family photos or modifying critical files.
Just a few weeks ago at Open Source Summit North America in Minneapolis, while chatting with Bob Killen in the hallway track, I learned about a new project called agent-substrate. What immediately caught my attention was its ability to dynamically wake up agents based on invocation, thus allowing more agents on the same infrastructure resources while still providing the security benefits of sandboxed execution.
Naturally, the first thing I did was discuss with our team how we could integrate it with kagent and agentgateway.
What Are the Differences Between the Two Projects?
Agent-sandbox
The agent-sandbox project provides a Sandbox Custom Resource Definition (CRD) and controller for Kubernetes under the umbrella of Kubernetes SIG Apps.
Its primary focus is on providing:
Strong identities for agents
Persistent storage that survives restarts
Lifecycle management of sandboxed pods
Security and isolation through the Sandbox controller
In short, agent-sandbox focuses on making agent execution secure, manageable, and Kubernetes-native.
Agent-substrate
The agent-substrate project is currently a standalone project and is not part of any Kubernetes SIG or other cloud native foundation project, though that may change in the future.
Built on top of Kubernetes, agent-substrate aims to go beyond sandboxing by focusing on:
Higher scale
Better resource efficiency
Lower latency execution
More dynamic lifecycle management for agents
My understanding is that agent-substrate provides the runtime building blocks needed to run AI agents securely at very high scale.
Instead of keeping agents running continuously as pods, agents execute in secure worker pods for short bursts, suspend when idle, and resume later on any available worker. The worker pod lifecycle is decoupled from the agent “actor,” which is managed by the agent-substrate control plane.
In this model, agents behave more like on-demand serverless workloads: they can be scheduled, paused, and resumed with minimal overhead, while still benefiting from Kubernetes-based sandbox isolation using lightweight runtimes such as gVisor or Kata Containers.
Do We Need Agent-substrate When We Already Have Agent -sandbox?
I believe the answer is yes.
Sandboxing your agents is necessary, but not sufficient.
In most Kubernetes environments, resources are constrained. You have to be selective about which agents run continuously. Many agents are only useful occasionally, and keeping them always on is inefficient.
This creates an awkward tradeoff:
Keep agents running idle and waste resources
Or constantly spin them up and down, adding overhead and latency
Neither option scales well.
This is where agent-substrate becomes interesting. While agent-sandbox focuses on security, isolation, and lifecycle management, agent-substrate focuses on density, efficiency, and operational scalability, while still preserving a secure execution model.
You can think of it as making large-scale agent fleets practical: not just safe, but economically viable.
Agent-substrate Integration with kagent
One of the things I appreciate about kagent is its simplicity and declarative YAML-based workflow. You always know what is running in your cluster, and you can recreate environments easily from source-controlled manifests.
With the efficiency introduced by agent-substrate, we can support many more agents using a shared pool of worker resources. Instead of assigning a dedicated pod per agent, we can use shared worker pools and templates that dynamically execute agents on demand.
Agents can now appear and disappear based on invocation, while still running on the same underlying infrastructure.
I’ve updated my AIRE agent to use agent-substrate as its runtime. This allows me to invoke agents only when needed, without keeping them running continuously.
It also enables multiple AIRE agents (each with different skills, echoing the idea of “Don’t put agents! build skills instead”) to share the same worker pool or even same pod.
The result is a more efficient system: agents remain available on demand, idle resource consumption drops significantly, and there is far less need to constantly scale pods up and down.
For example, my six AIRE agents map to six actor templates but only require a single worker pod to execute them, as long as they are not running concurrently. If concurrency increases, I can simply scale the worker pool (kagent-default) horizontally to increase the number of worker replicas.
Final Thoughts
agent-sandbox and agent-substrate solve related but distinct problems.
Agent-sandbox asks: How do we run agents securely? Agent-substrate asks: How do we run agents not only securely but also efficiently at scale?
As AI agents become more common in Kubernetes environments and AI costs remain one of the biggest concerns in adoption, we need to be more innovative and avoid tying an agent’s lifecycle too closely to Kubernetes pods.
Security, identity, isolation, and policy controls remain essential. At the same time, we need a runtime model that allows hundreds or thousands of agents to exist in a dormant state, waiting to be invoked, without requiring hundreds or thousands of pods for workloads that are idle most of the time.
The future is not just secure agents, it’s scalable, efficient, and ephemeral agents.
Dynamic Resource Allocation (DRA) recently reached GA in Kubernetes v1.35, and I believe many of us are eager to give it a try. Adding to the momentum, NVIDIA has moved dra-driver-nvidia-gpu into Kubernetes SIGs, with the documentation dropping the Beta label — a sign that the technology and its standards are gradually maturing.
For this post, I borrowed all the NVIDIA GPUs currently available at CNTUG Infra Labs to learn how to elegantly allocate devices and resources with DRA.
CNTUG Infra Labs: Lab environment overview
CNTUG Infra Labs was founded to nurture the next generation of students and engineers in Taiwan’s software infrastructure field. The lab is hosted in Equinix’s Tokyo data center and is jointly funded by several CNTUG community members. Building the environment leverages a stack of open source projects, including OpenStack, Ceph, and Ansible
.
Since infrastructure software has a steep learning curve and requires substantial compute, storage, and network resources, CNTUG Infra Labs aims to provide a cloud platform where students and community members can experiment with and host related services. Spare capacity is also offered to the open source community for hosting services such as websites, Mattermost, and Jitsi Meet, or for workshop events. You can review the use cases for more details.
Lab Environment
We’ll use a Kubernetes cluster built with Cluster API + OpenStack. For brevity, the setup process is omitted here — feel free to refer to other blog posts for the details, or wait for a future post once I finish writing it up.
OS: Ubuntu 24.04
Kubernetes v1.35.3
Containerd 2.2.2
Node:
1 Control Plane + etcd
3 Workers
No GPU
T10 * 2
A5000 * 1
NVIDIA GPU Operator v26.3.1
NVIDIA DRA Driver GPU v25.12.0
Running kubectl get node should return something like:
NAME                                   STATUS   ROLES           AGE     VERSION
capi-dralabs-control-plane-xtcth       Ready    control-plane   8m7s    v1.35.3
capi-dralabs-md-0-p4xkh-rpfxc          Ready    <none>          6m55s   v1.35.3
capi-dralabs-md-gpua5000-jw4mx-d64jz   Ready    <none>          2m37s   v1.35.3
capi-dralabs-md-gput10-gzl84-f2m2d     Ready    <none>          6m49s   v1.35.3
Installing NVIDIA GPU Operator
Before installing the GPU Operator, label the Nodes that have GPUs. For my environment, this looks like:
If you’re using a different Kubernetes distribution (e.g., Rancher or K3s), the default Containerd installation path may differ — remember to add the following settings to values-gpu-operator.yaml:
Wait for the GPU Operator to come up. It will install the NVIDIA GPU Driver and tweak the Container Runtime configuration. For specific tuning needs, refer to the NVIDIA official documentation.
Installing NVIDIA DRA Driver GPU
Create a values-nvidia-dra-driver-gpu.yaml file that we’ll use during installation:
If you’d like to try out Scenario IV’s GPU Time Slicing later, you can enable the TimeSlicingSettings Feature Gate now; otherwise, leave it commented out and helm upgrade later when needed.
Use kubectl get pod to confirm the NVIDIA DRA Driver GPU is up:
kubectl get pod -n nvidia-dra-driver-gpu
NAME                                         READY   STATUS    RESTARTS   AGE
nvidia-dra-driver-gpu-kubelet-plugin-6skhp   1/1     Running   0          10m
nvidia-dra-driver-gpu-kubelet-plugin-jswk6   1/1     Running   0          10m
A first look at DRA
DeviceClass
Once installed, you’ll find that DeviceClass and ResourceSlice have been set up by NVIDIA DRA Driver GPU. As the name suggests, DeviceClass represents categories of devices — opening it up reveals regular GPUs, MIG, and VFIO. (If ComputeDomains isn’t disabled, you’ll also see ComputeDomains information.)
kubectl get deviceclass
DeviceClass example output
NAME                  AGE
gpu.nvidia.com        44m
mig.nvidia.com        44m
vfio.gpu.nvidia.com   44m
ResourceSlice
ResourceSlice is automatically updated by the DRA driver on each node, recording all devices the driver manages on that node.
Devices on the same node managed by the same driver belong to the same Pool. When the device count exceeds what fits in a single object (up to 128 entries, or 64 if any device uses taints or counters), the driver splits the Pool across multiple ResourceSlices.
.spec.pool.generation and .spec.pool.resourceSliceCount let the scheduler determine whether it has the complete and latest device list for a given node.
kubectl get resourceslice
ResourceSlice example output
NAME                                                        NODE                                   DRIVER           POOL                                   AGE
capi-dralabs-md-gpua5000-jw4mx-d64jz-gpu.nvidia.com-w9fnv
capi-dralabs-md-gpua5000-jw4mx-d64jz   gpu.nvidia.com
capi-dralabs-md-gpua5000-jw4mx-d64jz   5m13s
capi-dralabs-md-gput10-gzl84-f2m2d-gpu.nvidia.com-dtgtc
capi-dralabs-md-gput10-gzl84-f2m2d     gpu.nvidia.com
capi-dralabs-md-gput10-gzl84-f2m2d     23m
You can expand the full content with -o yaml:
kubectl get resourceslices -o yaml
Click the panel below to see the full output. Each ResourceSlice records its node in .metadata.ownerReferences and the devices in .spec.devices. Every device carries .attributes including (but not limited to) architecture, product name, and driver version.
Since each node in this lab has at most 2 GPUs — far below a single ResourceSlice’s 128-entry limit — every node only shows one ResourceSlice.
With this information, how does a Pod tell Kubernetes which devices it wants? That’s where ResourceClaim and ResourceClaimTemplate come in!
ResourceClaim & ResourceClaimTemplate
If you’d like multiple Pods to share the same device, you can manually create a ResourceClaim. It stays fully independent regardless of Pod creation or deletion.
What if you want each Pod to have its own dedicated device? ResourceClaimTemplate lets you predefine a ResourceClaim. Once a Deployment references the template by name, every new Pod automatically gets a corresponding ResourceClaim; conversely, deleting the Pod removes its claim.
Do these concepts feel familiar? DRA is modeled after Storage in Kubernetes — PersistentVolumeClaim and PersistentVolumeClaimTemplate (the latter only existing inside StatefulSet), with DeviceClass playing roughly the role of StorageClass.
Hands-On with DRA
Scenario I: Two Containers Sharing One GPU
Use a ResourceClaim to declare that we need one NVIDIA GPU, then run a Pod with two containers that share it.
The status changes to allocated and reserved because a Pod is now using the resource.
NAME              STATE                AGE
must-nvidia-gpu   allocated,reserved   16s
Now we can use logs to print the output:
kubectl logs pod must-nvidia-gpu-pod --all-containers --prefix
[pod/must-nvidia-gpu-pod/ctr0] GPU 0: Tesla T10 (UUID:
GPU-dae084a2-974c-00e2-6dec-4ba1999b8652)
[pod/must-nvidia-gpu-pod/ctr1] GPU 0: Tesla T10 (UUID:
GPU-dae084a2-974c-00e2-6dec-4ba1999b8652)
In practice, it might not be a T10 — it could just as easily be an A5000.
Now delete the Pod:
kubectl delete -f lab01-pod.yaml
Check the ResourceClaim once more:
kubectl get resourceclaim
The status returns to pending because no Pod is using the resource anymore.
NAME              STATE     AGE
must-nvidia-gpu   pending   3m39s
Delete the ResourceClaim:
kubectl delete -f lab01-rc.yaml
The example above only asked for one GPU but didn’t tell us which one we’d get.
This scenario isn’t all that different from the original Device Plugin, right? The next scenarios are where DRA truly shines!
Scenario II: ResourceClaimTemplate — Prefer A5000 in a Deployment
Today, an engineer asks me for an inference model that prefers the A5000, but since A5000s are scarce, they’re fine falling back to T10 when scaling up.
Beyond exactly, ResourceClaim also supports firstAvailable for ranked preferences. Going back to the full ResourceSlice output, we can target GPUs by name using .attributes.productName.
Confirm the Pod is Running and use the nvidia-smi -L output to verify it got the A5000:
kubectl get pod
kubectl logs deployments/first-a5000-deploy --all-pods
NAME                                 READY   STATUS    RESTARTS   AGE
first-a5000-deploy-8c6cf4568-2lsv9   1/1     Running   0          9s

[pod/first-a5000-deploy-8c6cf4568-2lsv9/ctr0] GPU 0: NVIDIA RTX A5000 (UUID: GPU-e13ce856-7474-797f-d143-16e99b65c0c3)
Now scale up to 2 replicas to see which GPU the new Pod gets:
The first Pod has taken the only A5000, so the second Pod falls back to T10 — exactly the expected behavior of firstAvailable when the top choice is unavailable.
We can also see the corresponding ResourceClaims:
kubectl get resourceclaim
NAME                                           STATE                AGE
first-a5000-deploy-8c6cf4568-2lsv9-gpu-bdz9j   allocated,reserved   4m29s
first-a5000-deploy-8c6cf4568-865jj-gpu-mqfcx   allocated,reserved   3m29s
⚠️ WARNING — If we delete the A5000 Pod, will the rebuilt Pod return to A5000?
With the configuration above, no, it won’t return to A5000. The Deployment default strategy.type is RollingUpdate; while the old Pod is Terminating, its ResourceClaim hasn’t been released yet.
The Deployment controller immediately creates a new Pod and a new ResourceClaim from the ResourceClaimTemplate. Since the A5000 is still held by the old Pod, the new claim falls back to T10.
Finally, clean up:
kubectl delete -f lab02.yaml
Scenario III: GPUs With at Least 20 GiB of Memory
Today an engineer wants to deploy an LLM that needs a single GPU with at least 20 GiB of memory. Since it’s still in testing, compute requirements are flexible — any available GPU meeting the memory threshold will do.
Beyond .attributes, we can also use .capacity.memory. How do we express comparison rules? Take a look at line 15:
We use CEL’s isGreaterThan(quantity(“20Gi”)) to require more than 20 GiB.
Apply the YAML:
kubectl apply -f lab03.yaml
Confirm the Pod is Running and that we got the A5000:
kubectl get pod
kubectl logs deployments/gt20g-deploy --all-pods
NAME                           READY   STATUS    RESTARTS   AGE
gt20g-deploy-5ff576476-hdz8f   1/1     Running   0          5m16s

[pod/gt20g-deploy-5ff576476-hdz8f/ctr0] GPU 0: NVIDIA RTX A5000 (UUID: GPU-e13ce856-7474-797f-d143-16e99b65c0c3)
kubectl get pod
NAME                           READY   STATUS    RESTARTS   AGE
gt20g-deploy-5ff576476-hdz8f   1/1     Running   0          8m9s
gt20g-deploy-5ff576476-vjss8   0/1     Pending   0          26s
Run describe on the gt20g-deploy-5ff576476-vjss8 Pod:
kubectl describe pod gt20g-deploy-5ff576476-vjss8
Events:
  Type     Reason            Age   From               Message
  ----     ------            ----  ----               -------
  Warning  FailedScheduling  98s   default-scheduler  0/4 nodes are available: 1 node(s) had untolerated taint(s), 3 cannot allocate all claims. still not schedulable, preemption: 0/4 nodes are available: 4 Preemption is not helpful for scheduling.
Since there’s no other GPU with at least 20 GiB of memory in the cluster — the T10 has only 16 GiB — the new Pod is stuck in Pending.
As of June 2026, neither the NVIDIA official documentation nor the NVIDIA DRA Driver GPU wiki contains any tutorials on Time Slicing.
The configuration below is adapted from demo/specs/quickstart/v1/gpu-test5.yaml, supplemented by reading parts of the source code; the Feature Gate part draws from third-party articles.
The setup may change in future releases — keep that in mind!
Today, an engineer comes back to me asking: “I know DRA is great for resource allocation, but is there a way to fall back to Time Slicing mode?”
Want to go back to the old mode? Nooo… problem at all!
Just specify the device under .spec.devices.config and switch the sharing strategy to TimeSlicing. Here’s an example:
That’s how Time Slicing is enabled under DRA — the effect is similar to the legacy Device Plugin’s Time Slicing mode, except we don’t need to specify how many slices to divide into. We just configure timeSlicingConfig and its interval.
Finally, clean up the resources:
kubectl delete -f lab04.yaml
Summary
Compared to the Device Plugin, DRA now offers a much cleaner usage model that lets developers and cluster admins allocate devices more precisely. There’s no longer a need to colocate the same kind of device on the same node, nor to write complex rules in nodeSelector or Affinity.
Starting with K8s v1.36, device health reporting is also available, so Pods no longer simply show Error — we can tell whether the failure stems from the device or from the application.
Previously, when a K8s cluster ran low on CPU or memory, Cluster Autoscaler could spin up new machines. In the future, the same may apply to GPU shortages — Cluster Autoscaler may provision GPU nodes on demand, enabling more efficient resource allocation.
Thank you to Laura Llinares, Mary Baldwin Hughes, Vimal Kumar, and Sunil Thaha for their significant contributions to this blog post and the Kepler project.
Data centers accounted for 1.5% of global electricity demand in 2024, which is projected to double to around 945 TWh by 2030, driven in part by rapid growth in AI workloads according to the International Energy Agency’s “Energy and AI” report published in 2025. In Kubernetes clusters, there is no easy built-in method to allocate power per workload. Kepler solves this: it reads from hardware power meters, attributes this power consumption to Linux processes, associates that to Pods running in your Kubernetes cluster, and exports Prometheus metrics.
Since joining the CNCF as a sandbox project in 2023, Kepler adoption has grown. However, the original architecture relied on eBPF, and while that added granularity, it also created problems. First, it required CAP_BPF and CAP_SYSADMIN privileges, which is a blocker for many production environments. Secondly, eBPF proved to be error-prone when it comes to tracking fine-grained, kernel-level processes at this level of accuracy. Data inaccuracy at this level creates a bottleneck for the power estimation models that we need to train in order to deploy Kepler on virtual machines (VMs). Beyond the elevated privileges and accuracy issues, the eBPF integration made the learning curve steeper. It added complex abstractions that made it difficult to extend and maintain the codebase.
The team decided to tackle these challenges head on. We wanted to make Kepler easier to configure and deploy, less error-prone, and easier for the community to extend the codebase.
The maintainer team made a big but exciting decision: rewrite Kepler. In this post, we walk through what changed, why, and how you can get involved. And for more on this decision, Vimal Kumar walks though the rewrite in this podcast episode.
Re-architecting Kepler
To run Kepler, two elements are required: the utilization signal of the containerised Linux process and power meter access. The Power Attribution documentation guide explains how Kepler measures and attributes power consumption to processes, Pods, and other Kubernetes internals.
Previously, Kepler relied on eBPF to capture utilization signals, which accounted for the majority of user-reported issues. At the same time, it caused missing short-live, terminated processes, leading to inaccurate, under-reported energy footprints.
To prioritize ease of adoption and accuracy improvement, we are shifting away from eBPF and going back to basics. Our re-architected solution leverages read-only access to standard /proc and /sys. Because these are universally available on Linux systems, they require significantly lower privileges and minimal setup. By eliminating the complicated configuration overhead, we’ve made Kepler easier to deploy out-of-the-box via a single configured Helm.
For the power metrics, previously, Kepler assumed a hardcoded power structure (e.g., RAPL is composed of core, DRAM, and other). However, we found that actual hardware topologies vary significantly, meaning the old design was attributing data to a non-existent ground truth. The re-architected Kepler dynamically discovers the host’s power meter structure at runtime. By adapting to the layout of the underlying hardware, Kepler can now report precise energy metrics across diverse environments according to real availability.
Validating Accuracy Improvements
We ran two experiments to validate the accuracy improvements of the Kepler rewrite.
Experiment 1: Comparing pre- and post-rewrite versions
The first test, led by Laura Llinares (CERN), compared versions of Kepler before and after the rewrite. We deployed both Kepler versions simultaneously on the same bare-metal node:
kepler-old: the previous version, publishing metrics with an old_ prefix.
kepler-new: the re-architected version, publishing clean metrics without prefix.
Intelligent Power Management Interface (IPMI): hardware BMC power meter readings.
Then we compared Node-level CPU energy and container-level CPU energy.
Both Kepler versions read the RAPL Package domain (entire CPU socket). The newer Kepler versions expose power both as a watts gauge (kepler_node_cpu_watts) and as joules counters (kepler_node_cpu_joules_total and kepler_container_cpu_joules_total). In the Grafana dashboard panels shown below, PromQL is used to derive watts from the old joules counters using PromQL’s rate() so that all series share the same unit.
Node-level CPU energy
Metric
Version
kepler_node_package_joules_total
old
kepler_node_cpu_watts
new
Both counters increment with energy consumed by the CPU Package RAPL domain at node level.
Container-level CPU energy
Metric
Version
kepler_container_package_joules_total
old
kepler_container_cpu_joules_total
new
IPMI is the full-node power draw from the BMC. It includes DRAM, fans, NICs, and PSU losses on top of CPU, so Kepler values are expected to be 40-70% of IPMI. Since IPMI measures the whole node and Kepler measures only the CPU, we use IPMI as a load shape reference. IPMI is displayed as a background reference in the overlay panels. When a stress workload ramps up, IPMI and both Kepler versions should all rise together. A Kepler estimator that rises and falls in sync with IPMI is correctly tracking load.
Dashboard (source) showing old vs new Kepler tracking against IPMI
The new Kepler node_cpu_watts metric tracks IPMI patterns closely and eliminates the multi-kW spikes seen with the old node_pkg_joules and full_node_joules counters that exceed the IPMI ground truth values.
Experiment 2: Negligible attribution gap
The second test, led by Vimal Kumar (Red Hat), shows the negligible attribution gap when comparing Node power with power derived through the process attribution model, which validates the accuracy of Kepler’s new design. The system testing uses a progressive stress-ng workload. The resulting Grafana dashboard panels for core and package energy show a Process Power Attribution Gap of essentially 0 Watts.
Dashboard (source) panels showing process energy variation and attribution gap
Dashboard (source) panels showing core energy variation and attribution gap
Furthermore, the detailed delta graphs indicate that the difference between the total node active energy and the energy distributed to individual processes is minimal, fluctuating by only a few milliwatts. This negligible variance demonstrates the architecture’s capability to accurately track and assign power usage at the process level.
Last but not least, we added extensive integration and unit tests to reach 90% testing coverage. This improves the long-term maintainability and trust in results. This is key to validate the accuracy of the power metrics that Kepler exports. The project will continue improving the testing and validation framework to keep improving Kepler’s accuracy.
What’s Next? A Call to Action
The rewrite lays the foundation. Our immediate priorities are improving CPU power attribution on bare metal then extending to VMs. Getting this right is key. It sets the stage for everything that comes next.
Looking ahead, there’s a lot we’re excited about, and plenty of room to help! We’re looking for contributions in three specific areas:
Try GPU power monitoring: We have an experimental flag for GPU power monitoring, which is crucial now for AI and accelerator-heavy workloads. We need end users running AI/ML workloads to test and validate Kepler’s GPU power monitoringfeature.
Train VM power modeling: We need community members with machine learning experience to (re-)train the model that estimates power in virtualized environments where hardware counters aren’t available. This will bridge the gap between virtualized environments and physical energy signals.
Validate data accuracy: We need end users to test kepler against physical power measurements, both CPU attribution on bare metal and GPU power monitoring. If you have hardware with IPMI or external power meters, your results will directly shape how we improve the model.
Improve Idle Power Attribution: After the rewrite, Kepler only attributes active CPU usage per workload. However, this oversimplifies power estimation. While this was added to avoid confusion between idle and dynamic states, it should be added back and expressed better.
If you wish to contribute, browse and work on good first issues, open a new issue, or review open PRs. For features and bigger work streams, we moved to enhancement proposals. This gives the community a clearer way to discuss ideas, review designs, and collaborate on larger changes before going into implementation.
The rewrite gives Kepler a solid foundation. What comes next depends on the community that builds on it. Join us in our twice-monthly community meetings and in our #kepler-project channel on the CNCF Slack to keep the momentum going! 💚
A practical walkthrough of running a self-hosted, read-only AI agent inside a Kubernetes cluster, with the full CI/CD chain handled by GitHub Actions and Argo CD Image Updater. No data leaves the cluster, no cloud AI provider involved.
Why a Cluster-Aware Agent Is an Interesting Pattern
Most “AI for Kubernetes” tooling today is a hosted SaaS that consumes cluster data and returns advice. The model lives elsewhere. The data leaves the network.
This article walks through the opposite design: an agent that runs inside the cluster, observes live state through the Kubernetes API, and reasons with a local LLM. Every layer is visible, every credential is scoped, and the only network egress is a model pull at startup.
The interesting properties of this pattern for platform engineers:
Property
What it provides
Cluster-aware
The agent reads live pods, events, and logs and reasons about real state rather than generic Kubernetes facts.
Read-only by design
A dedicated ServiceAccount + ClusterRole with get/list verbs only. The agent can observe but cannot mutate the cluster, regardless of what the model produces.
Just another K8s workload
The agent is a Deployment + Service + PersistentVolumeClaim. No special runtime, no operator, no custom scheduler.
Full GitOps
Prompts, model selection, and RBAC live in Git. Argo CD reconciles them. The agent’s behavior is auditable through git log.
A Large Language Model answers from training data alone. It has no awareness of the environment it’s deployed into. An agent, in the sense used here, performs an extra step before reasoning: it observes the real world and incorporates that observation into the prompt.
The contrast in output is concrete. A generic LLM call returns “CrashLoopBackOff usually means the container is failing health checks or exiting unexpectedly…” An agent call returns “Pod api-7b8d has restarted 14 times in the last hour with ImagePullBackOff against registry.local. Run kubectl describe pod api-7b8d to confirm.”
The second answer is grounded. The first answer is correct but not actionable for this cluster.
This project demonstrates both modes through two REST endpoints:
POST /ask — LLM alone, useful for general questions like “What is a StatefulSet?”
POST /diagnose — the agent: reads live cluster state, then reasons over it
Architecture
The system has two halves: a CI/CD chain on the top and a Kubernetes runtime on the bottom.
Runtime side:
An Ollama pod serves a local Mistral 7B model on port 11434
A FastAPI pod exposes the agent’s HTTP API and chat UI on port 8000
A PersistentVolumeClaim holds the model weights so pulls aren’t repeated
A dedicated ServiceAccount mounted in the FastAPI pod has a ClusterRole permitting only read operations on pods, events, logs, services, and deployments
Delivery side:
A push to the application source in Git triggers GitHub Actions to build a multi-architecture image (linux/amd64 + linux/arm64) tagged with the 7-character commit SHA
Argo CD Image Updater (from argoproj-labs) polls Docker Hub on a 2-minute interval, detects new tags matching the configured regex, and commits the new tag back into the repository’s kustomization.yaml
Argo CD detects the manifest change and reconciles the cluster
The two halves are decoupled. Argo CD has no awareness of the registry. GitHub Actions has no awareness of the cluster. Image Updater is the small operator that bridges them, and it does so by writing to Git, which preserves a single source of truth.
The AI Concepts You’ll Actually Touch
Here are a few concepts that every AI engineer uses every day, explained in plain language.
1. LLM (Large Language Model)
A statistical model trained on enormous amounts of text. It doesn’t “know” facts; it predicts the most likely next word given everything that came before. That’s it. The magic is that this simple task, done at scale, produces something that feels like reasoning.
This project uses Mistral 7B, a 7-billion-parameter open-source model. “Parameters” are the numbers the model learned during training, similar to the strengths of connections in a brain.
2. Local LLM
Most commercial AI services send your text to a remote cloud provider. The trade-off is capability: a local 7B model isn’t as expansive as a massive foundational model running on cloud infrastructure.. But for experimenting, it’s more than enough. And nothing leaves your network.
3. Ollama (The Model Serving Runtime)
Ollama is not an AI model. It’s a server that runs AI models. Think of it like a web server for LLMs: it downloads the model files, loads them into memory, and exposes a REST API on port 11434 so anything (including our FastAPI app) can send prompts and get responses.
Without Ollama, you’d be wrestling with PyTorch, CUDA, and tokenizer libraries. With it, running an LLM is ollama pull mistral followed by an HTTP POST.
4. System Prompt (The Personality)
This is the single most important AI concept for application developers, and you can master it in about ten minutes.
A system prompt is the instructions you give the model before the user’s question. The model reads it first and uses it to shape every response.
In our project, the system prompt for /ask is:
“You are a DevOps assistant specializing in Kubernetes.
When given an error or question, you:
1. Explain what it means clearly
2. Provide the exact kubectl commands to diagnose or fix it
3. Explain why the fix works
Be concise and practical.”
Without that prompt, Mistral is a general assistant. With it, Mistral is a Kubernetes specialist who always returns structured answers. No retraining was needed. This is called prompt engineering, and it’s how almost every AI product you use was built.
5. RAG (Retrieval-Augmented Generation)
The fancy term for what /diagnose does. RAG means: before asking the model, retrieve real-world data and augment the prompt with it.
RAG is why contemporary AI assistants work. A code assistant reads your local workspace repository; our agent reads your live cluster state.. Same pattern, different data source.
The Two Modes: Where the Agent Becomes Real
Here’s where the “agent” idea earns its name.
Mode 1: Ask (LLM alone)
You type a question, FastAPI prepends the system prompt, sends it to Ollama. The model answers from its training data. Useful for general K8s questions like “What is a StatefulSet?”
Mode 2: Diagnose Cluster (true agent)
You type a question and a namespace. FastAPI does something new: it calls the Kubernetes API and reads:
All pods in that namespace (phase, restart count, waiting reason)
The last 10 events
The last 20 lines of logs from any non-Running pod
That entire context is injected into the prompt. Then Mistral reasons, but now it’s reasoning about your actual cluster, not generic Kubernetes knowledge.
The chat UI even shows you the exact context the agent read, in a collapsible panel under each answer.
Read-Only by Design
The agent runs with a ServiceAccount bound to a ClusterRole that exposes only read verbs:
This is the most important design decision in the project, and it generalizes beyond AI workloads. An agent that can delete pod based on its own reasoning is a production incident waiting to happen. Hallucinations multiplied by write access is a poor combination.
Read-only RBAC inverts the trust model. The agent is allowed to be wrong because being wrong has no consequences. The Kubernetes API server enforces the boundary; the LLM’s output cannot bypass it. Iteration on prompts and models becomes cheap because the worst-case behavior is bounded.
The same pattern scales: start every agent read-only, then earn each additional capability one verb at a time, each with its own RBAC rule and review.
The CI/CD Chain in Detail
The delivery half of the architecture uses three independent components, each with one responsibility.
GitHub Actions builds and pushes the image. The workflow uses docker buildx with QEMU emulation to produce a manifest list covering both linux/amd64 (GitHub-hosted runners) and linux/arm64 (Apple Silicon developer machines). The tag is the 7-character commit SHA, an immutable reference.
Argo CD Image Updater polls the registry on a 2-minute interval. Configuration lives in an ImageUpdater Custom Resource that names the target Argo CD Application, the image to track, an allowTags regex (^[0-9a-f]{7}$), and the update strategy (newest-build). When a new matching tag is found, the operator rewrites the newTag field in k8s/kustomization.yaml and commits the change to the main branch.
Argo CD watches the repository and reconciles the cluster on each commit. Because the source manifests are managed by Kustomize, Argo CD applies the rendered output, which now includes the updated image tag.
Try It Yourself: It’s a Starting Point, Not a Destination
Step-by-step setup with exact commands is in the README. Total time from git clone to working chat UI is about 30 minutes (most of that is the Mistral download).
To bring this article full circle: if you’re a DevOps or Platform Engineer who’s been hearing “AI agents are coming” and wondering what that actually means in practice, this is meant to be your starting point, not your finish line. Once you’ve seen the agent loop running, you’ll be in a much better position to continue.
The point of starting local isn’t that local is always the right answer. It’s to understand how the full circle works behind the scenes.

 Connexion