❌

Vue lecture

AWS Weekly Roundup: GPT-6 Sol and Luna, Claude Opus 5.5 on Amazon Bedrock, Strands harness, and more (September 28, 2026)

If there’s one theme that defined last week, it’s choice. The frontier models keep arriving, and the interesting question is no longer just “how smart is it?” but “which model fits this step, at this cost, at this latency?” That’s exactly what landed on Amazon Bedrock over the past few days: GPT-6 Sol and GPT-6 Luna from OpenAI, giving you two new points on the intelligence-versus-efficiency curve, and Claude Opus 5.5 from Anthropic, the first of the Claude 5.5 family.

GPT-6 Sol is built for the demanding, recurring work of development and operations, while GPT-6 Luna makes focused, repeatable tasks practical at high volume, and both ship at significantly lower pricing than their GPT-5.6 predecessors. Claude Opus 5.5, meanwhile, does more with fewer tokens than Opus 5 and is tuned for agentic coding and long-running tasks. What I like about all three is that they push toward the same idea: match the model to the job instead of reaching for the biggest one every time. The other thread was observability catching up to this agentic world, including a launch I had the pleasure of writing about myself.

Now, let’s get into this week’s AWS news…

Last week’s launches
Here are some launches and updates from this past week that caught my attention:

  • Introducing Amazon CloudWatch Omni – You can now observe your applications and AI agents together in a single, collaborative experience. Amazon CloudWatch Omni is built on OpenTelemetry, so your existing telemetry shows up with nothing to reconfigure, and your whole team reaches it through one URL with enterprise SSO — no console access required. It auto-discovers your services, maps dependencies, and brings AWS DevOps Agent into investigation sessions to correlate signals and trace root causes. There’s a companion post on the agent-observability side, a deeper dive on the AWS Cloud Operations blog on what observability for the AI era looks like, and the announcement on What’s New with the specifics. If you want the bigger picture, Matt Wood’s Wrong, not broken is a great read on why correctness now has to be measured at the level of the run.
  • Enhanced custom event buses in Amazon EventBridge – Amazon EventBridge now offers an enhanced custom event bus purpose-built for organizations scaling event-driven applications across teams and accounts. You can now deploy a single centralized bus shared across every account in your organization through AWS RAM, with optional event ordering, a simplified Subscriber resource that bundles filtering, targets, and retries, content-based deduplication, and synchronous invocation for targets like AWS Lambda. A new ingress/egress pricing model replaces the compounding cross-account routing charges of multi-bus setups, and your existing buses keep working unchanged as “classic.”
  • Amazon SageMaker HyperPod Inference Gateway – You can now front your LLM inference on Amazon SageMaker HyperPod with a Kubernetes-native, GPU-aware routing layer that deploys as a single Amazon EKS managed add-on with zero application changes. Instead of round-robin load balancing, it routes on real-time inference signals — KV cache utilization, queue depth, prefix cache hits, predicted latency, and more — cutting first-token latency by up to 82% in mixed-hardware and bursty scenarios. It works with any OpenAI-compatible model server, including vLLM and SGLang.
  • AI agent skills for AWS End User Messaging and Amazon SES – You can now build and send messages by asking your AI coding agent in plain language. Amazon SES and AWS End User Messaging publish AI agent skills for the AWS MCP Server, giving your agent step-by-step, validated guidance for tasks like verifying a sending identity, sending a production email, or building a branded RCS agent with cards and buttons. The skills work with Claude Code, Codex, Cursor, and Kiro, so you can complete messaging workflows without hopping between docs and console screens.

For a full list of AWS announcements, be sure to keep an eye on the What’s New with AWS page.

Other AWS news
Here are some additional posts and resources that you might find interesting:

  • Introducing Strands harness – The Strands Agents team released Strands harness, a fully assembled, general-purpose agent harness you can run locally or deploy anywhere, under Apache 2.0. It takes one line of Python or TypeScript to wire up your model of choice across Amazon Bedrock, Anthropic, OpenAI, Google, or a local Ollama model, and it ships with sensible defaults for prompt caching and context management (truncating bulky tool results, compacting when the context window fills up, and keeping memory across runs). The team reports it costs about 28% less than comparable harnesses on the same models while holding accuracy steady.
  • Announcing the new AWS Reimagine report on AI – The AWS Executive in Residence team spent nine months interviewing 154 leaders across 27 countries about what separates organizations that turn AI into value from those that don’t. The report is candid (including where AI hasn’t worked at Amazon), and the recurring insight is that once building gets fast, the bottleneck moves to deciding, funding, and governing the work. Well worth a read if you’re thinking about how your teams adopt AI in practice.

For a full list of AWS blog posts, be sure to keep an eye on the AWS Blogs page.

Upcoming AWS events
Check your calendar and sign up for upcoming AWS events:

  • AWS re:Invent – AWS re:Invent returns to Las Vegas from November 30 to December 4, and session times, locations, and speakers are live. Reserved seating opens October 6, so register now and be ready to claim your spot in chalk talks, workshops, and builders’ sessions.
  • AWS Summits – With re:Invent on the horizon, the Summits are wrapping up for the year. The last stop is Dubai (September 30) at the Dubai World Trade Center, with 60+ sessions, an AWS Village, and hands-on workshops.

Join the AWS Builder Center to connect with builders, share solutions, and access content that supports your development. Browse here for upcoming AWS-led in-person and virtual events and developer-focused events. That’s all for this week. Check back next Monday for another Weekly Roundup!

— Daniel Abib
  •  

Introducing Amazon CloudWatch Omni: collaborative AI-powered observability for your applications

Amazon CloudWatch now offers CloudWatch Omni, an AI-powered observability experience for the applications and AI agents you run together. You reach Omni through a dedicated URL for your organization and sign in with the identities you already manage, so working in Omni does not require access to the AWS Management Console. Omni is built on OpenTelemetry: the telemetry you already send to CloudWatch appears in Omni with nothing to reconfigure, and any other workload you instrument with OpenTelemetry sends its telemetry to an OpenTelemetry Protocol (OTLP) endpoint.

CloudWatch Omni offers both agent observability and application observability in a single experience. In our companion post, we introduced the agent observability capabilities of Omni for generative AI and agentic workloads. In this post, we present the application observability experience.

Engineering teams spend a significant portion of their observability time maintaining dashboards, tuning thresholds, and switching between tools to piece together what happened during an incident. When an issue crosses team boundaries, context gets lost in Slack threads and screenshots rather than flowing naturally to the next engineer. CloudWatch Omni changes this by organizing observability around your applications rather than individual signals, and bringing your whole team into the same workspace.

What CloudWatch Omni brings
CloudWatch Omni addresses three problems that engineering teams told us they face today.

One collaborative experience for your whole team. Every engineer accesses CloudWatch Omni through a single URL with enterprise SSO (via IAM Identity Center, supporting Okta, EntraID, and other providers). No AWS Console access is required. SREs, developers, database engineers, and managers share the same data and investigation context. When an investigation escalates, the next person joins the same session with full context already in front of them.

The system adapts as your applications evolve. CloudWatch Omni discovers your services, maps dependencies, and adjusts alarms automatically. Instead of manually curating dashboards and tuning thresholds, you declare what matters (availability targets, latency budgets, error rate thresholds) and Omni adapts as your system changes. When you deploy new services, Omni updates the application topology automatically.

AI-powered investigation with Amazon DevOps Agent. Amazon DevOps Agent participates alongside your team in investigation sessions, correlating signals and suggesting next steps. The agent works from the same telemetry your engineers see, so its suggestions are grounded in the actual state of your application. It identifies correlated events across services, traces root cause paths through your dependency graph, and maintains investigation history for post-incident review.

How an investigation works
When something breaks, CloudWatch Omni opens an investigation session pre-loaded with context. Here is a typical incident workflow:

An alarm fires on elevated error rates in your checkout service. Omni opens a session showing the service topology, correlated signals (a deployment 10 minutes earlier, increased latency from a downstream payment API), and DevOps Agent’s initial analysis.

Your on-call SRE confirms the deployment correlation, pulls in the trace view to identify failing endpoints, and checks if the payment API latency correlates with a capacity limit.

The SRE escalates to the payments team. The payments engineer joins the same session and sees everything found so far, plus DevOps Agent’s correlation with a configuration change in the payment provider’s API gateway. They identify the root cause and roll back.

The entire investigation history is captured automatically. No separate incident report needed.

Walkthrough: setting up your first Space
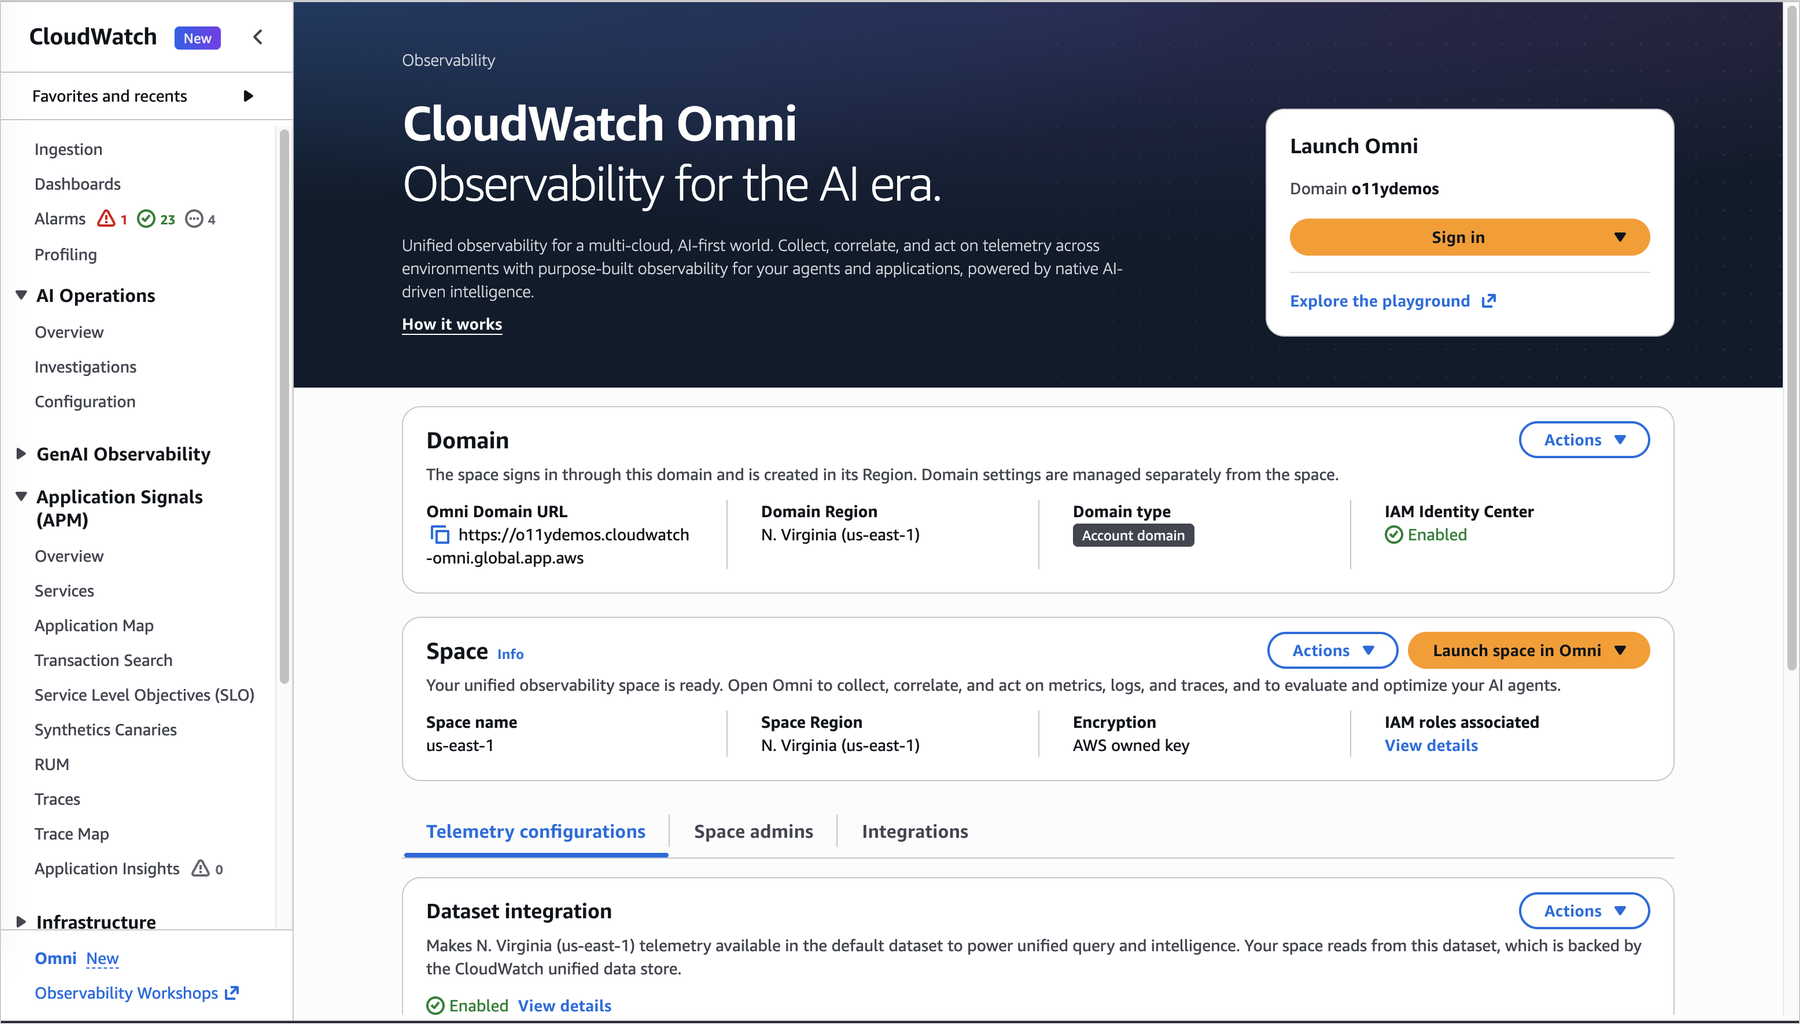
To set up CloudWatch Omni for your team, open the CloudWatch console and click “Try CloudWatch Omni.”


Figure 1. CloudWatch console — Omni setup page

Next, connect your identity provider through IAM Identity Center (supporting Okta, Azure AD, and other SAML 2.0 providers). Once connected, your team members access Omni directly at your dedicated URL without needing AWS Console credentials.

Create a Space for your team. A Space groups the applications your team owns and the telemetry associated with them.


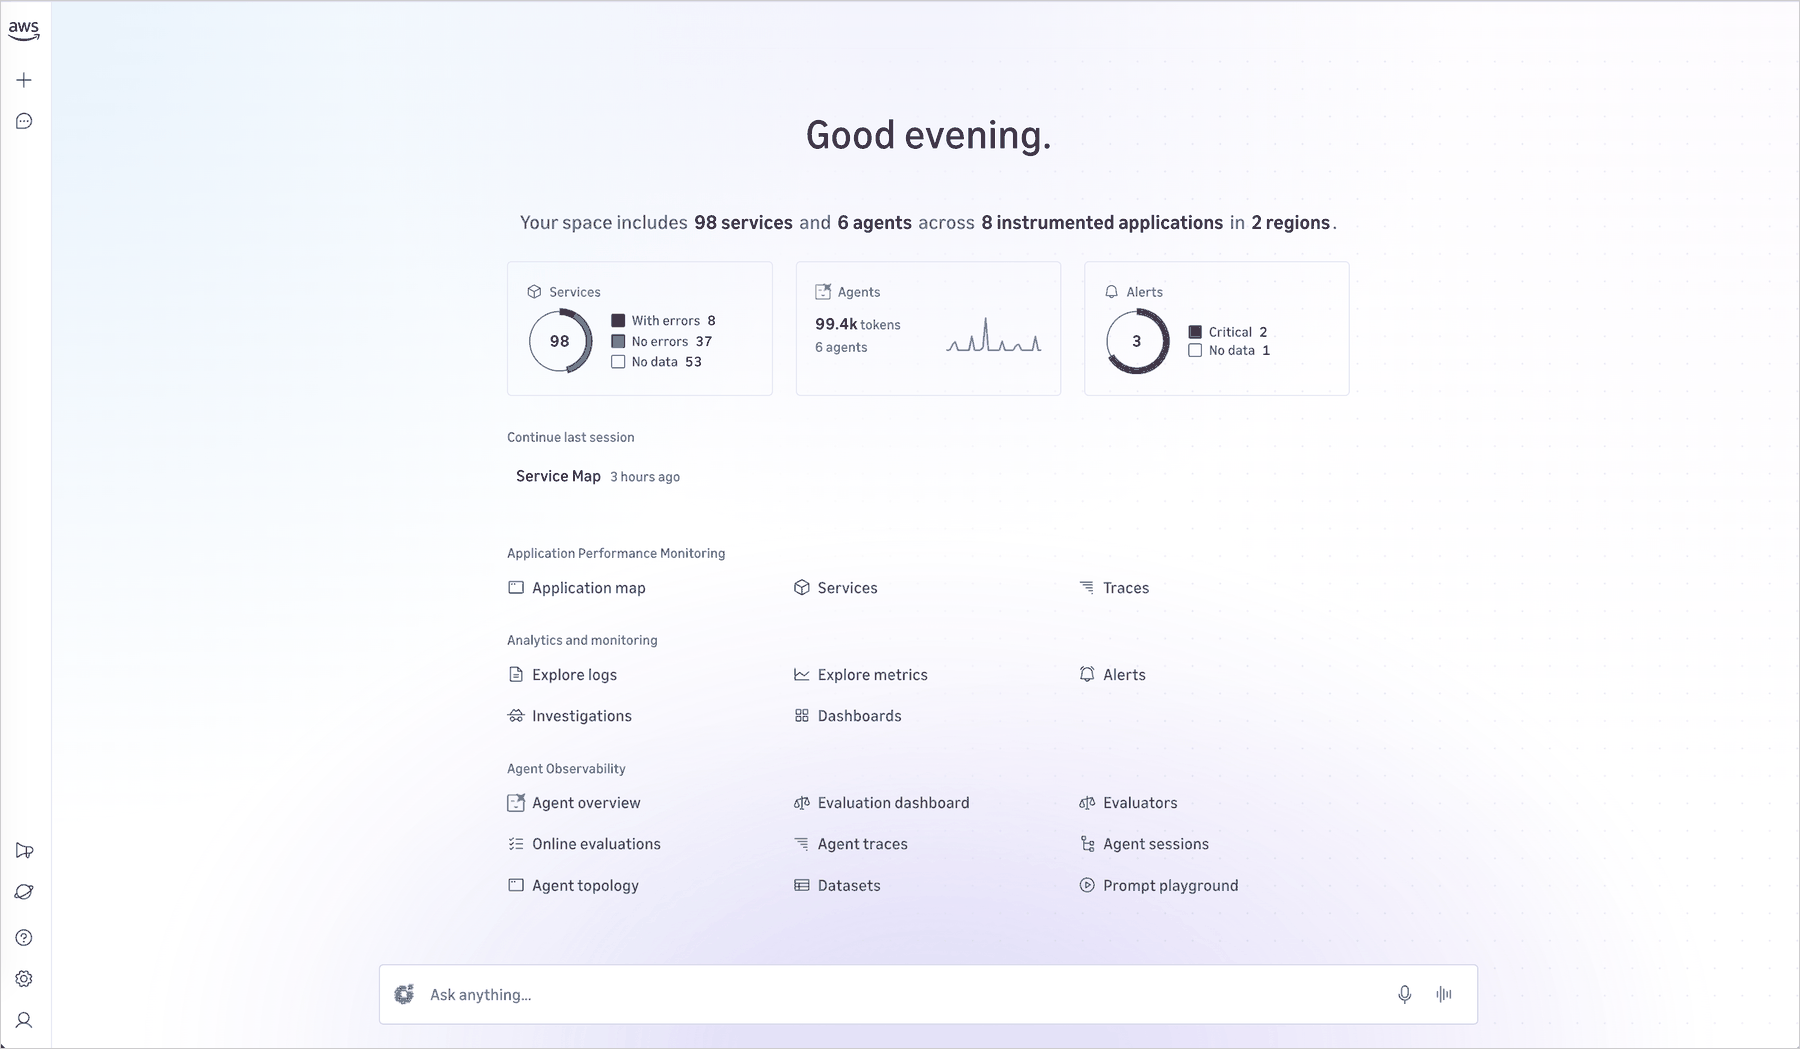
Figure 2. CloudWatch Omni Home — your team’s workspace with application monitoring, analytics, and agent observability

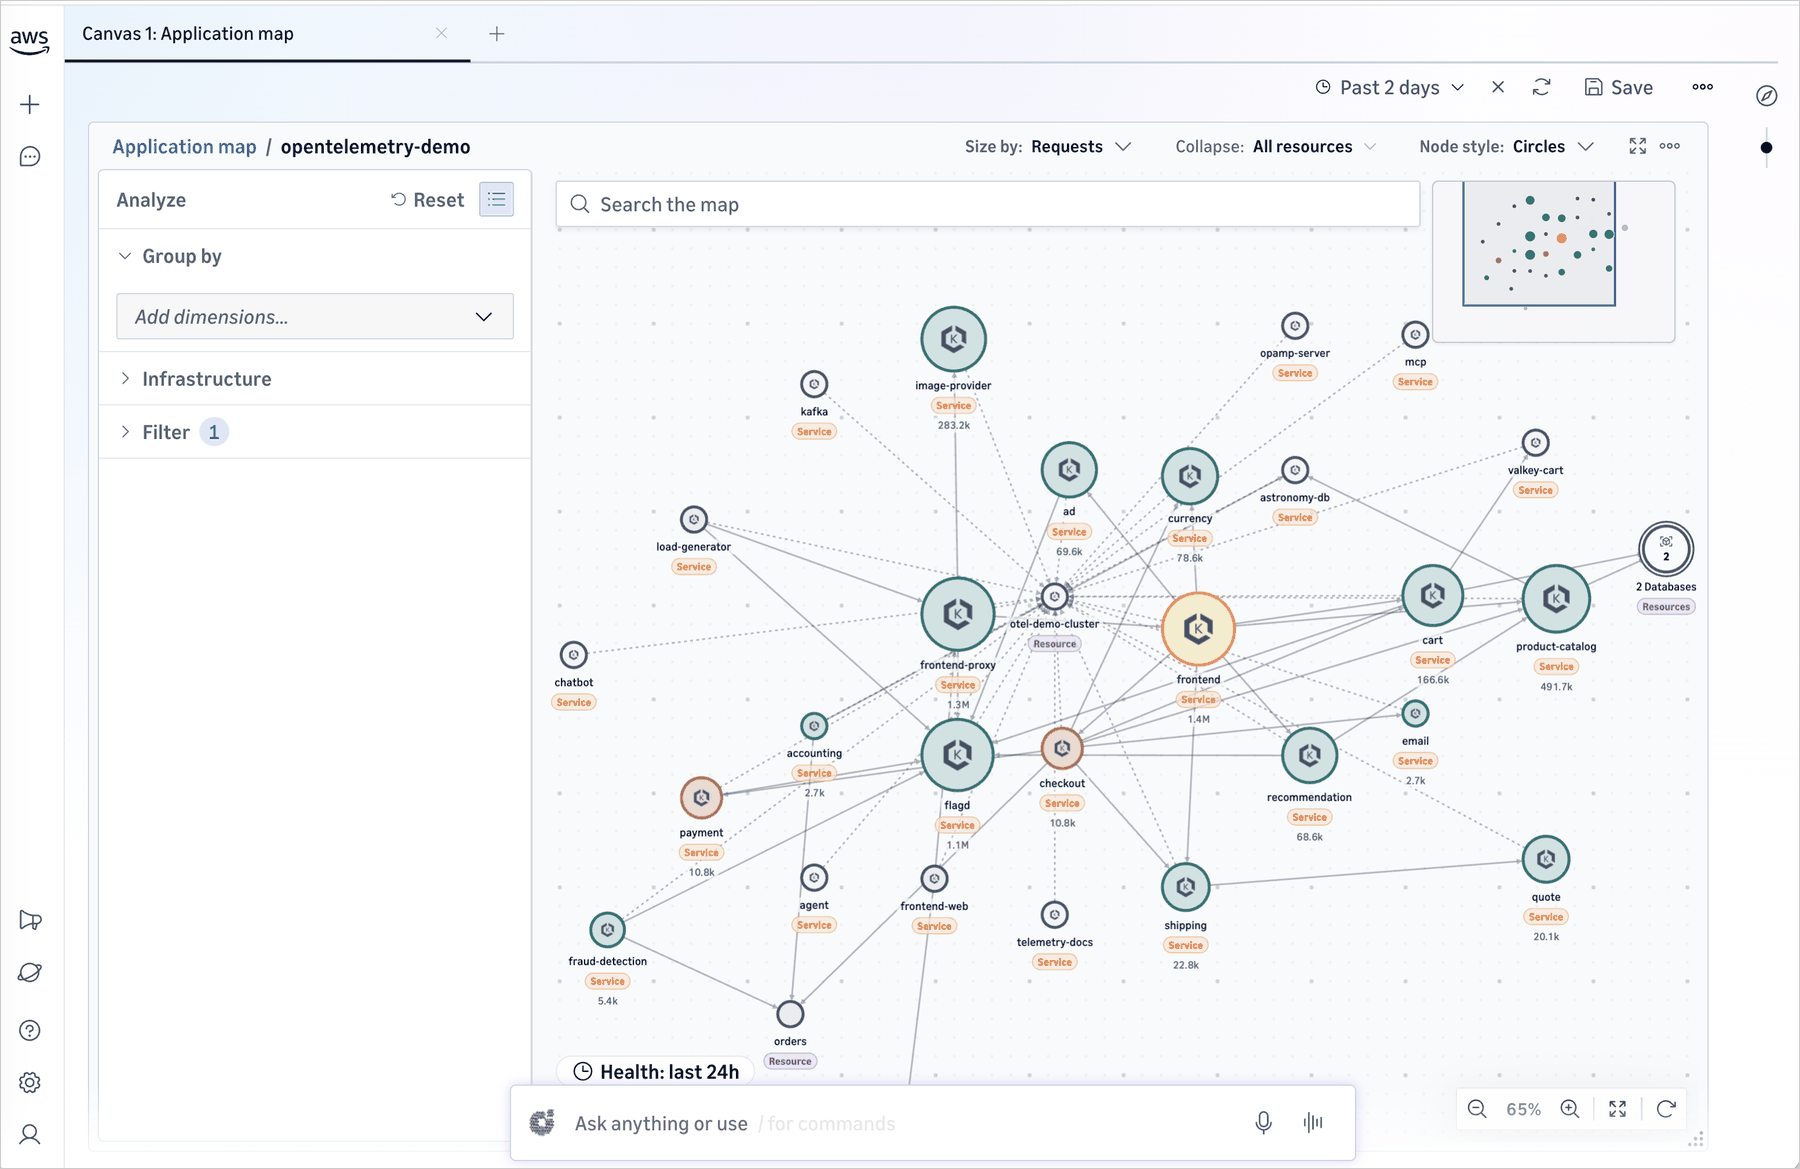
Once created, Omni discovers your services automatically and maps the dependencies between them. You see your application topology immediately.


Figure 3. Application topology — services and dependencies mapped automatically

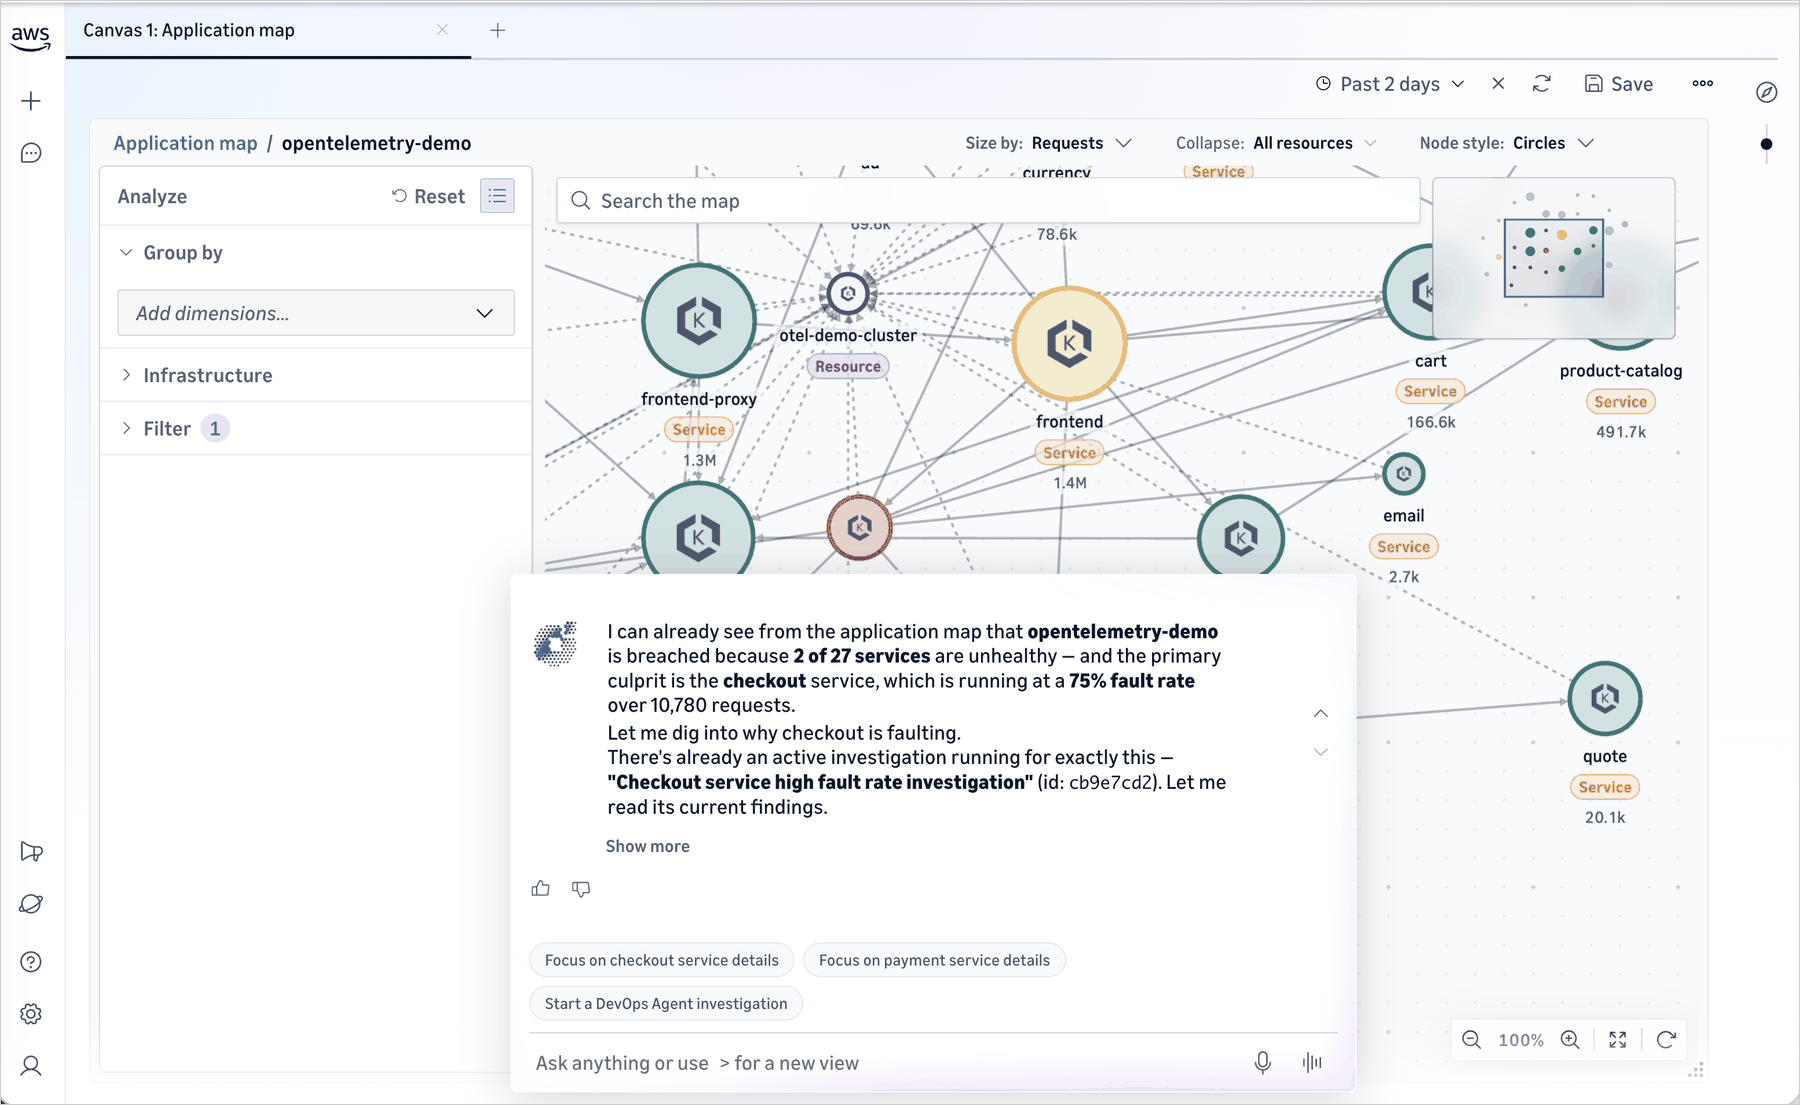
You can ask CloudWatch Omni any question about your applications in plain English, and Omni will analyze your telemetry data and surface insights.

Figure 4. Interact with your telemetry in natural language

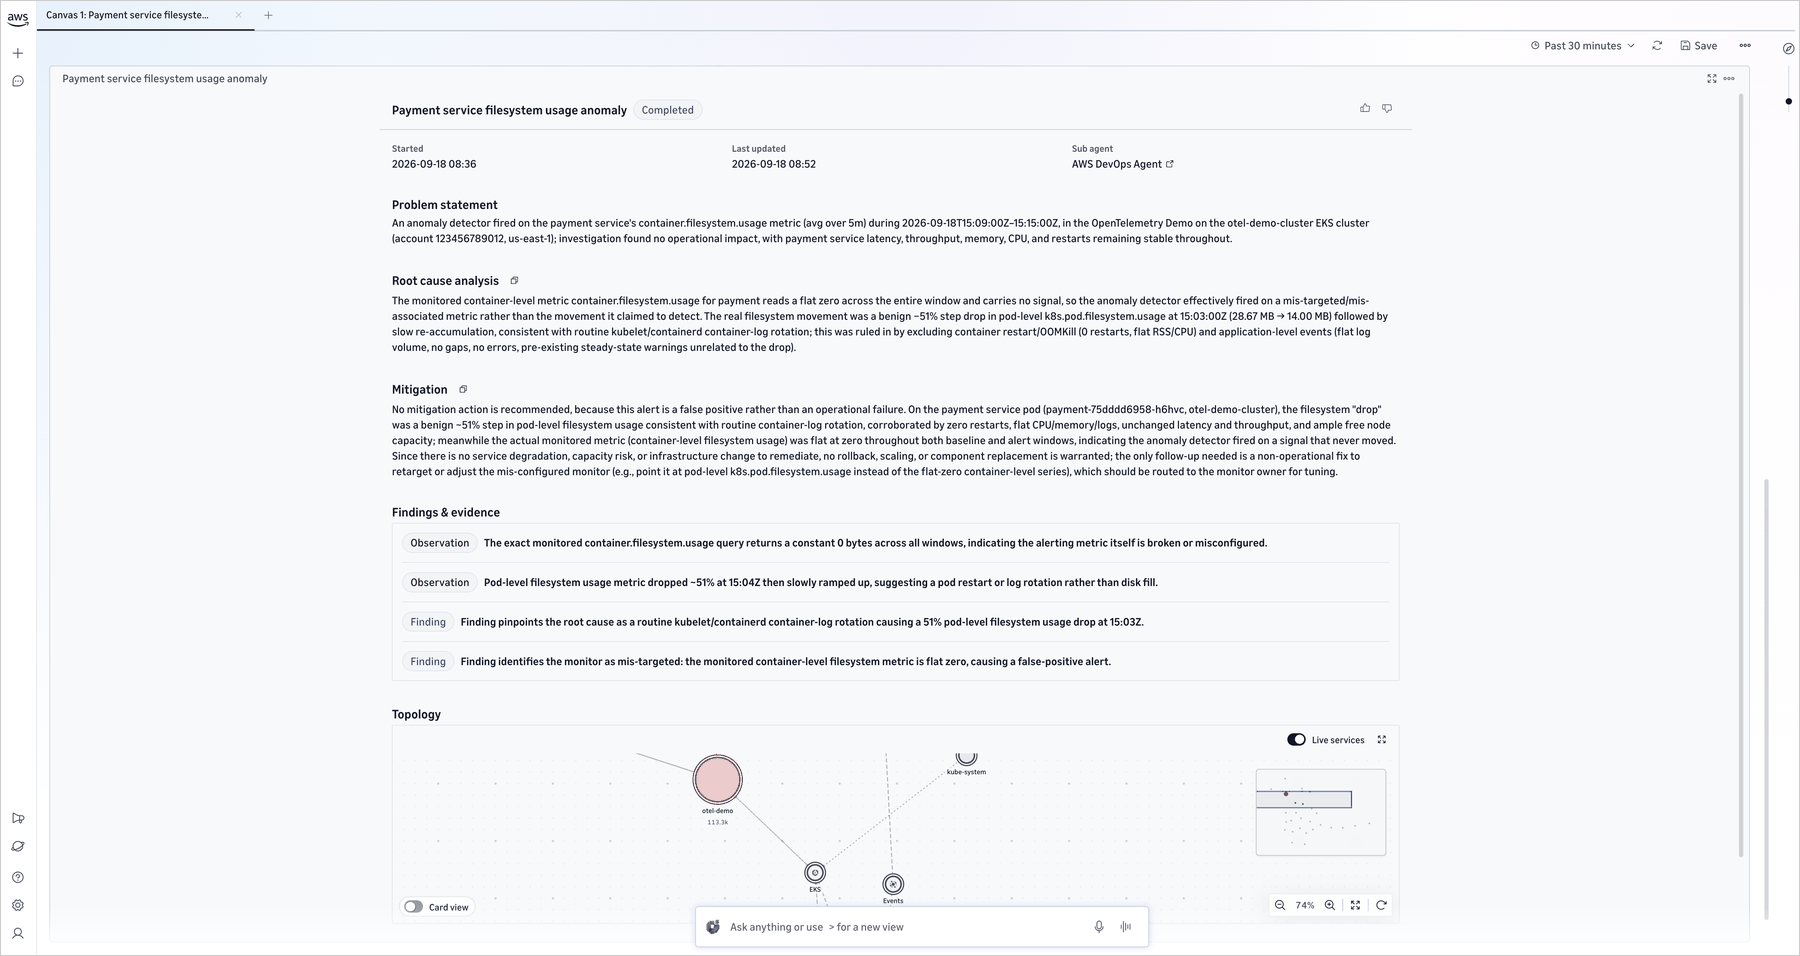
You can also set up service health alerts, configure what matters to your team, and trigger an AWS DevOps agent investigation to identify the root cause and develop a mitigation plan.


Figure 5. Investigation session — DevOps Agent identifies root causes and suggests next steps

Application-centric organization
CloudWatch Omni organizes telemetry by application rather than by infrastructure component. The system automatically discovers services from the telemetry data and AWS Config resource discovery, maps dependencies, and lets you see your application as a connected system rather than a collection of isolated resources.

Each team gets a Space that contains the applications they own. A Space points at existing CloudWatch data (logs, metrics, traces, and alarms) with no additional data movement required. Dynamic views replace the maintenance burden of static dashboards, providing ongoing visibility into SLOs and application health.

Getting started
Getting started takes minutes and doesn’t require reconfiguration of your existing CloudWatch setup.

If you’re an existing CloudWatch customer: Click “Try CloudWatch Omni” in the CloudWatch console. All your existing telemetry (logs, metrics, traces, and alarms) is immediately available. Workloads are discovered automatically, and you can start an investigation or browse your application topology right away.

For organization-wide deployment: An administrator configures a domain, connects your identity provider via IAM Identity Center, defines Spaces for teams and environments, and invites users. Each Space points at existing CloudWatch data with no additional data movement required.

For applications in other environments: CloudWatch Omni provides connectors that make it easy to bring in telemetry from additional environments. All ingested telemetry appears alongside your AWS data in the same Spaces and investigation sessions.

For generative AI and agentic workloads: The same CloudWatch Omni experience delivers purpose-built observability for AI agents, including trace exploration, evaluation frameworks, and real-time monitoring. In our companion post, we introduced the agent observability capabilities of Omni; for that walkthrough, see Introducing Amazon CloudWatch Omni: AI-powered observability for generative AI and agentic workloads.

Things to know

  • CloudWatch Omni extends CloudWatch. Existing alarms, dashboards, APIs, and console workflows continue unchanged.
  • Access is through a dedicated web application with enterprise SSO. Engineers don’t need AWS Console access to use it.
  • Once you setup, DevOps Agent is enabled by default in every Omni investigation session.

Pricing and availability
Amazon CloudWatch Omni is now available. Existing CloudWatch customers can try it directly from the CloudWatch console. For pricing details, visit the Amazon CloudWatch pricing page.

To get started, visit Amazon CloudWatch Omni or click “Try CloudWatch Omni” in the Amazon CloudWatch console.

If you want to call APIs, search documentation, find regional availability, and check troubleshooting about this feature, try using the AWS MCP Server and plugins with your preferred AI tool. Share your feedback on AWS re:Post or reach out through your usual AWS Support contacts.

9/24/2026 – Editor’s note: Azure AD has been renamed to Microsoft Entra ID.

— Daniel Abib

  •  

Introducing Amazon CloudWatch Omni: AI-powered observability for generative AI and agentic workloads

Today, Amazon CloudWatch introduces CloudWatch Omni, a unified observability experience for application and AI workloads that is app-centric, AI-powered, built on open standards, and delivered off-console. CloudWatch Omni is a purpose-built observability, evaluation, and experimentation solution for AI agents. It helps teams design, evaluate, and operate AI agents across any model provider, framework, or runtime, with an eval-driven workflow, support for the tools you already use, and observability delivered where you work: directly in your IDE and through a standalone web experience, separate from the AWS Management Console.

Organizations deploying agentic AI systems face observability challenges that traditional monitoring can’t address. Agent behavior is non-deterministic: a prompt change can degrade response quality even when standard metrics show no errors. Teams spend hours manually reviewing logs across multiple systems, unable to pinpoint what changed or why. Existing tools force teams to choose between siloed generative AI monitoring or fragmented solutions requiring constant context-switching between their coding environment and browser-based dashboards.

CloudWatch Omni captures every trace and includes built-in evaluators for correctness, coherence, retrieval quality, and tool selection, among others. You can compare prompt versions side by side in the playground, build test datasets from production traffic, run experiments across different configurations, and detect regressions automatically.

Two surfaces for development and operations
CloudWatch Omni delivers observability through two complementary surfaces. Developers get a native extension inside VS Code and Kiro (the currently supported IDEs), where traces appear as you run your agent with a playground and evaluators a click away. Operators get a standalone web experience, separate from the AWS Management Console to monitor the fleet, accessible through SSO with no AWS console needed. Both share the same data: the trace a developer debugs is the trace an operator investigates.

The Cloud Login feature connects your local IDE environment to your AWS account, enabling you to send telemetry data to Amazon CloudWatch for persistent storage, share traces with your team, and access production dashboards. This connection is optional. You can use CloudWatch Omni entirely locally during development, then connect to the cloud when you are ready to monitor agents in production.

Getting started
CloudWatch Omni offers two ways to get started: through the IDE extension (for VS Code and Kiro) or directly through the cloud experience, where you can start sending telemetry data to CloudWatch without installing any IDE extension. In this walkthrough, I install the extension, create an agent, run it, and explore the traces and evaluation tools from my IDE.

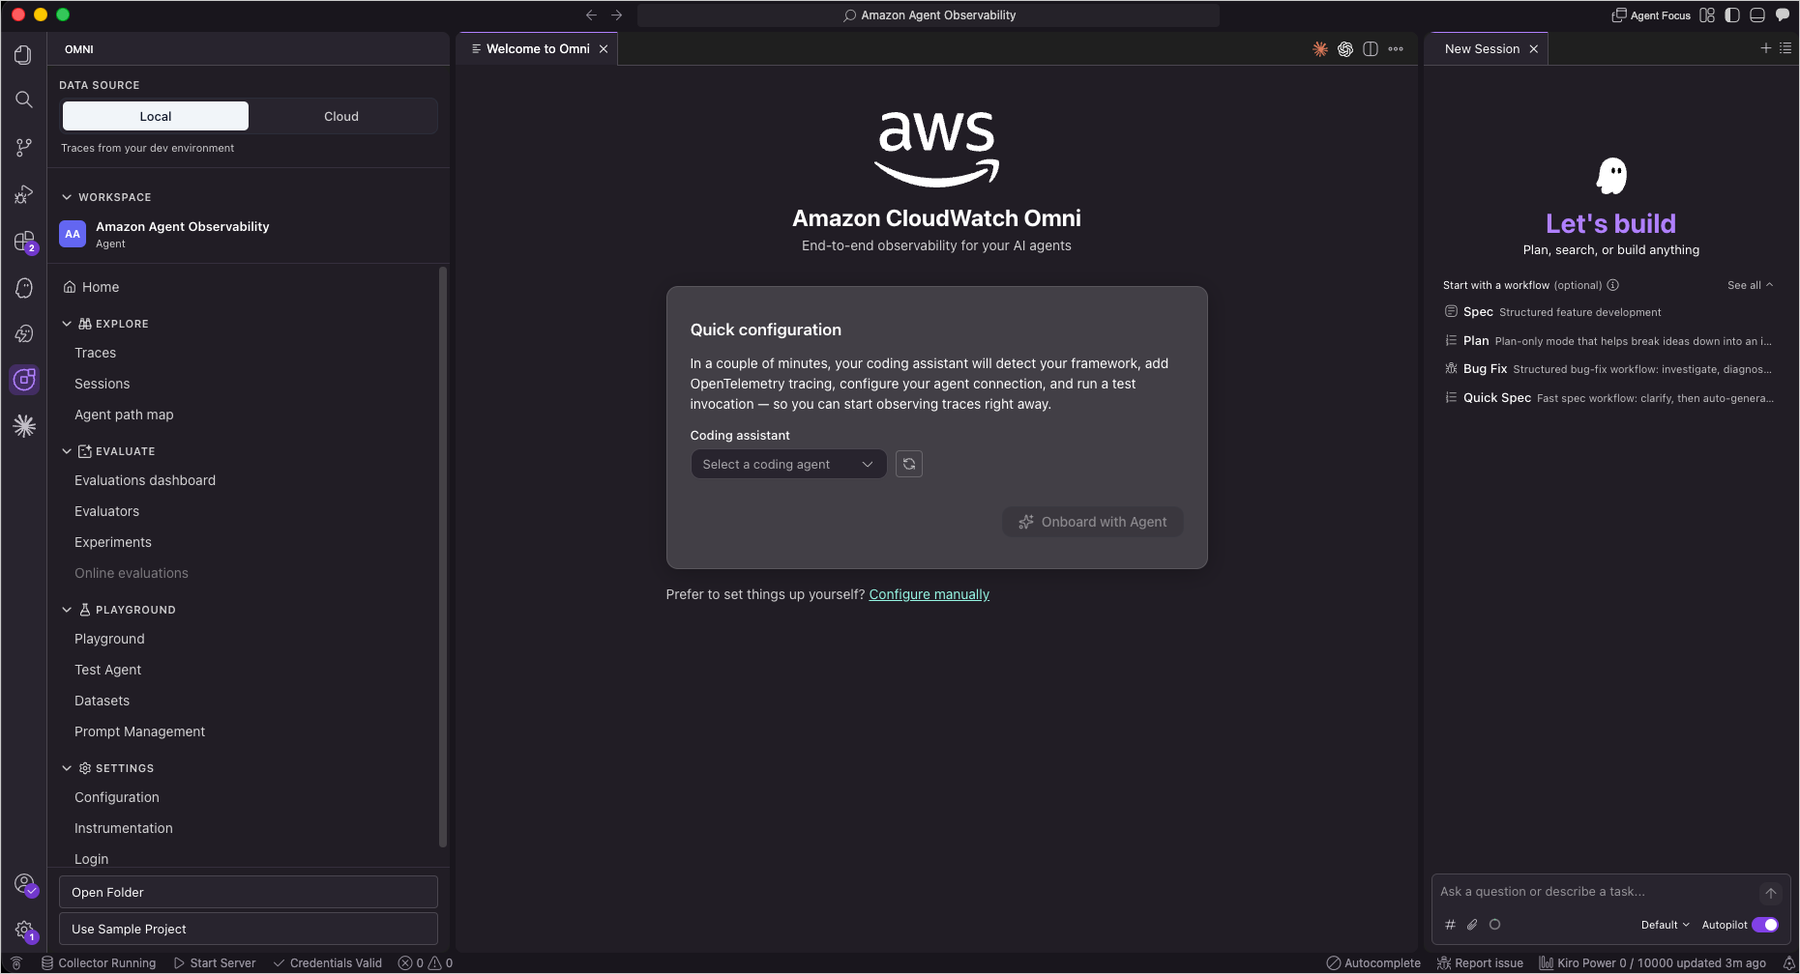
After installing the CloudWatch Omni extension from the VS Code Marketplace, the CloudWatch Omni icon appears in the Activity Bar. From the welcome screen, I selected Get started with Sample Project to load a pre-configured agent with sample trace data or use shortcut to Command Palette using Command + Shift + P (on macOS) or Ctrl + Shift + P (on Windows/Linux) and select Omni: Create a new Project

CloudWatch Omni welcome screen and create new project in VS Code
Figure 1. CloudWatch Omni welcome screen & create new project in VS Code

The sample project comes with an agent implementation and example datasets. Part of the getting-started experience is adding OpenTelemetry instrumentation, and CloudWatch Omni guides you through each step. You can also create a new agent from scratch. CloudWatch Omni walks you through the process using an interactive chat where you define the agent’s purpose, select a model provider, and configure tools. All data is stored locally by default. You can optionally connect to AWS to send data to Amazon CloudWatch.

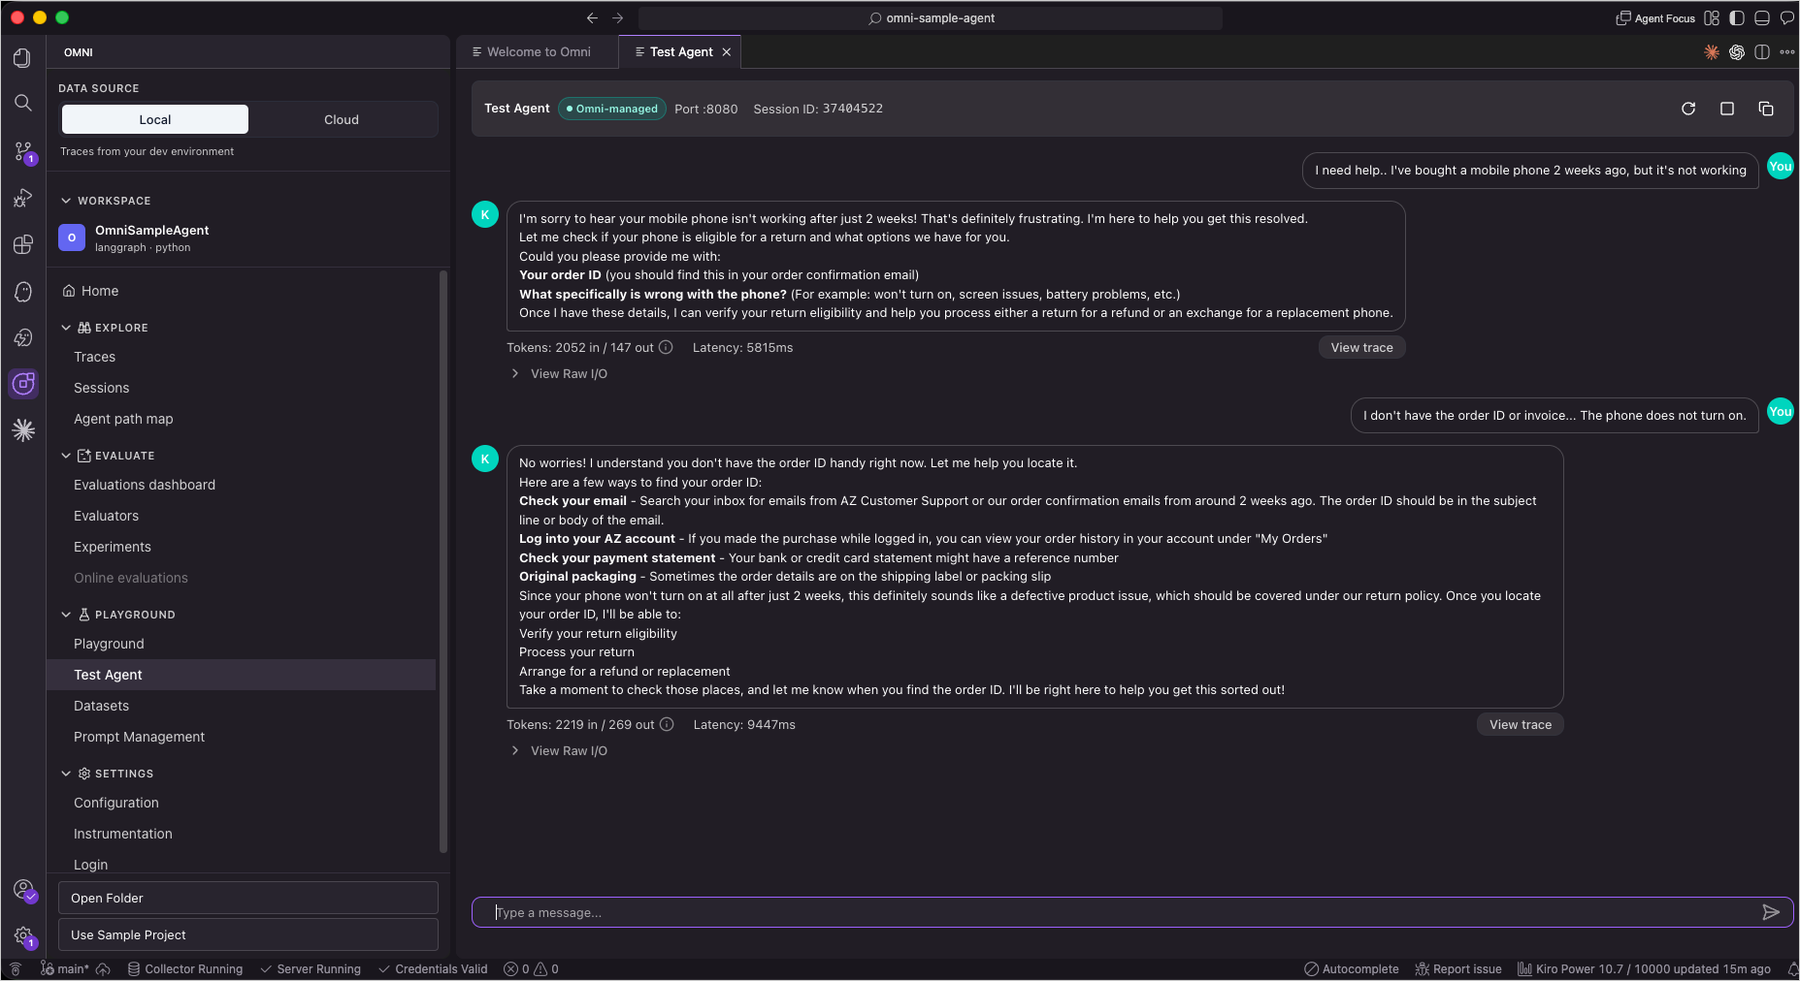
After verifying the configuration, I started the local dev server and sent a question to the agent. What makes this different from a typical chatbot interface is what happens next: selecting View Trace shows exactly how the agent processed the request.

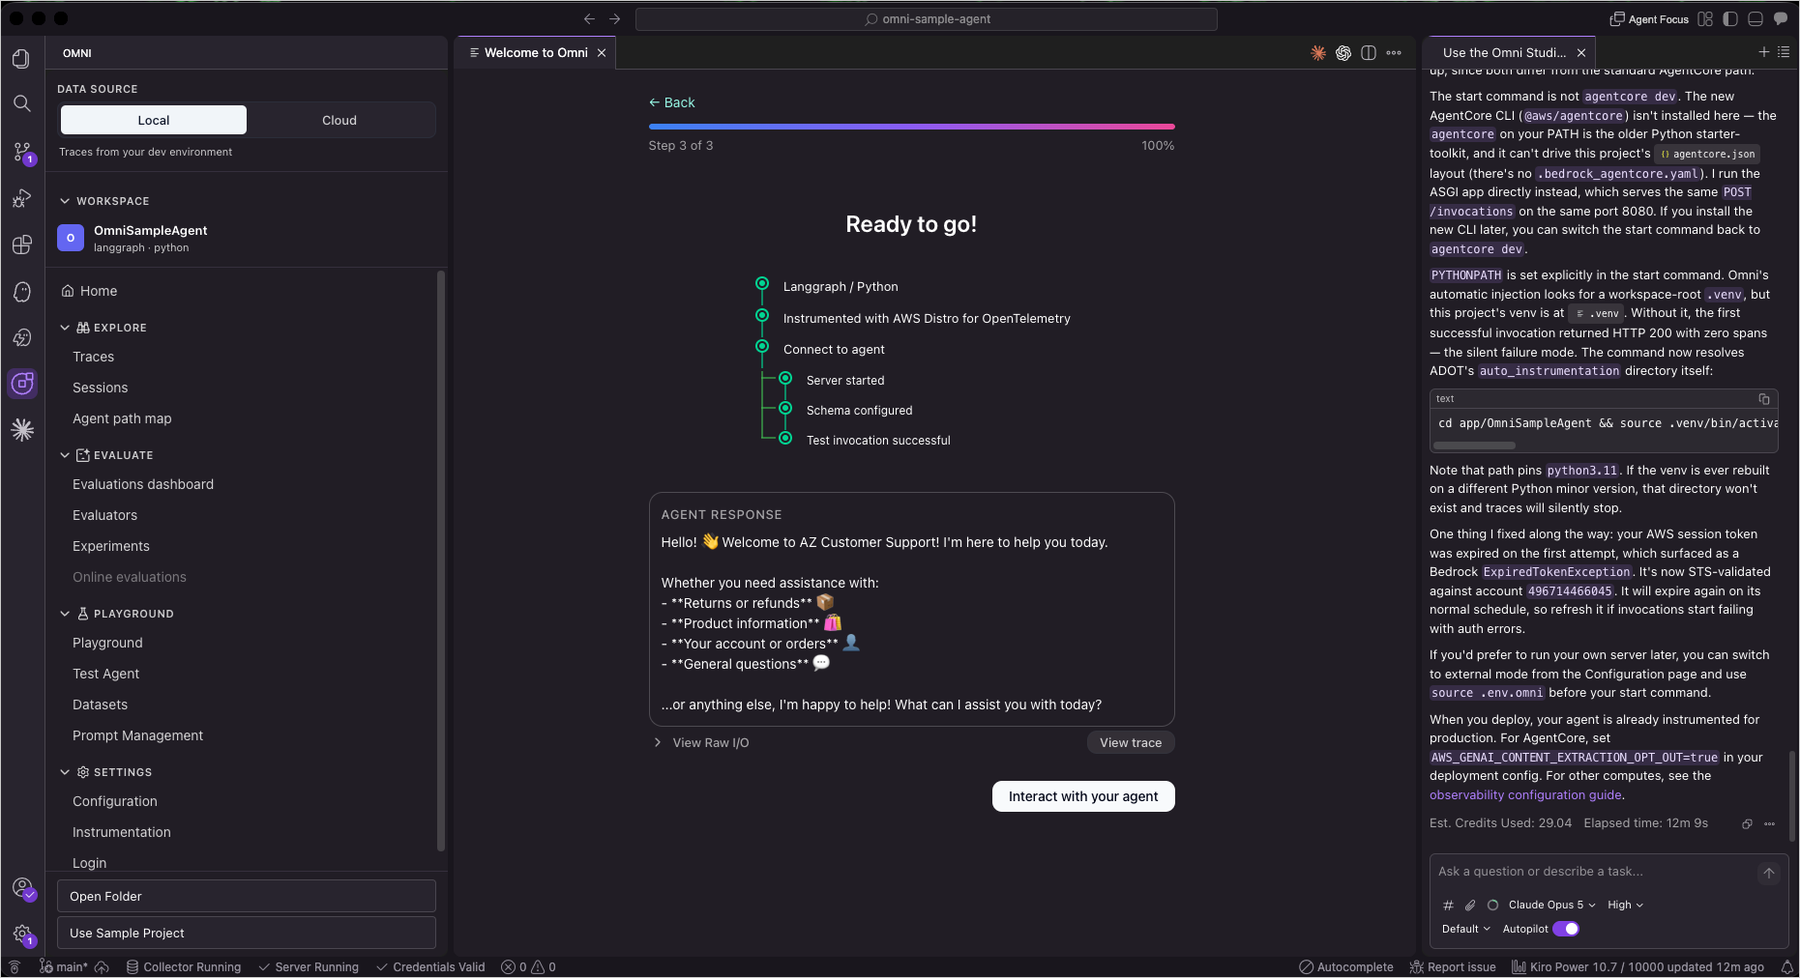
CloudWatch Omni guides your AI code assistant to configure the development environment
Figure 2. CloudWatch Omni guides your AI code assistant to configure the local development environment for testing

CloudWatch Omni integrates with AI code assistants such as Kiro, Claude Code, and Codex to streamline the setup process. These assistants can configure the Dev Server, install dependencies, and set up instrumentation on your behalf, so you can go from installation to running your first traced agent session in minutes without manual configuration.

Interacting with the agent and viewing traces
Figure 3. Interacting with the agent and viewing traces

Traces are essential for understanding AI agent behavior. Unlike traditional request-response systems, agents make multiple decisions per invocation: choosing tools, composing prompts, and chaining sub-calls. Without full trace visibility, diagnosing why an agent produced an incorrect answer or took an unexpected path becomes guesswork. CloudWatch Omni records every step in a structured timeline so you can pinpoint exactly where behavior diverged.

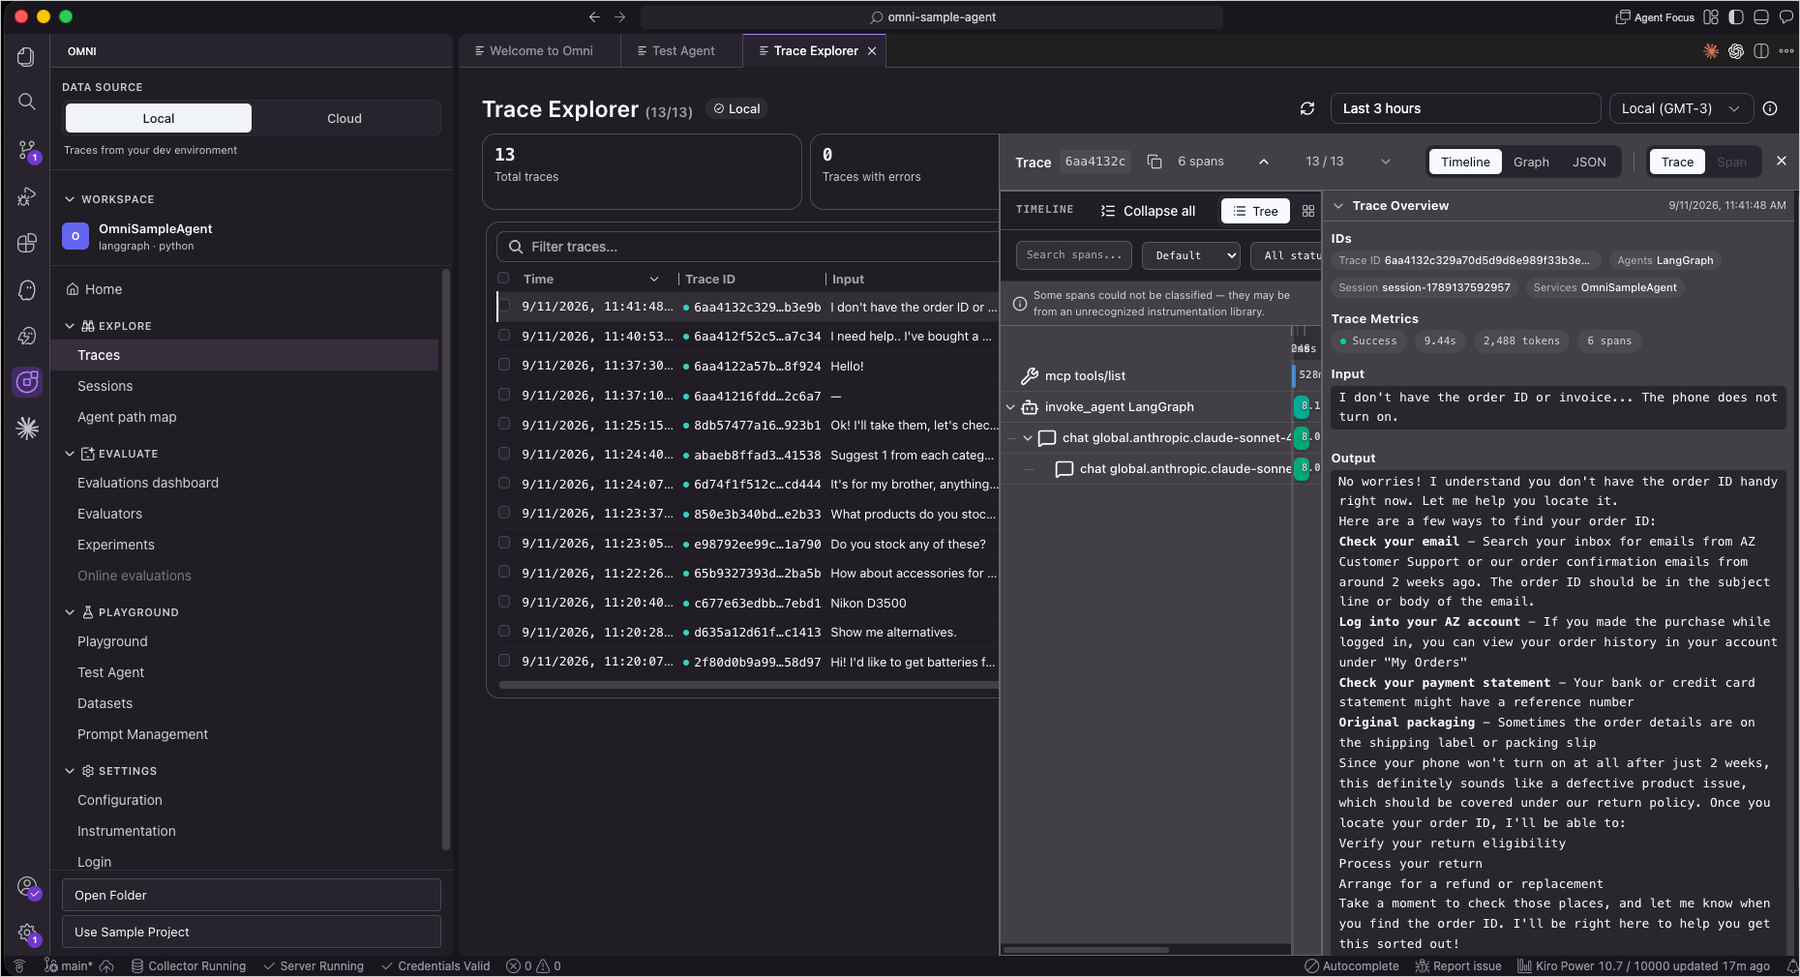
The Trace Explorer shows a detailed breakdown of every step the agent took (LLM calls, tool invocations, and reasoning steps) in a structured, hierarchical timeline. I could drill into any span to inspect inputs, outputs, token usage, and latency.

Trace Explorer showing the agent execution timeline
Figure 4. Trace Explorer showing the agent’s execution timeline

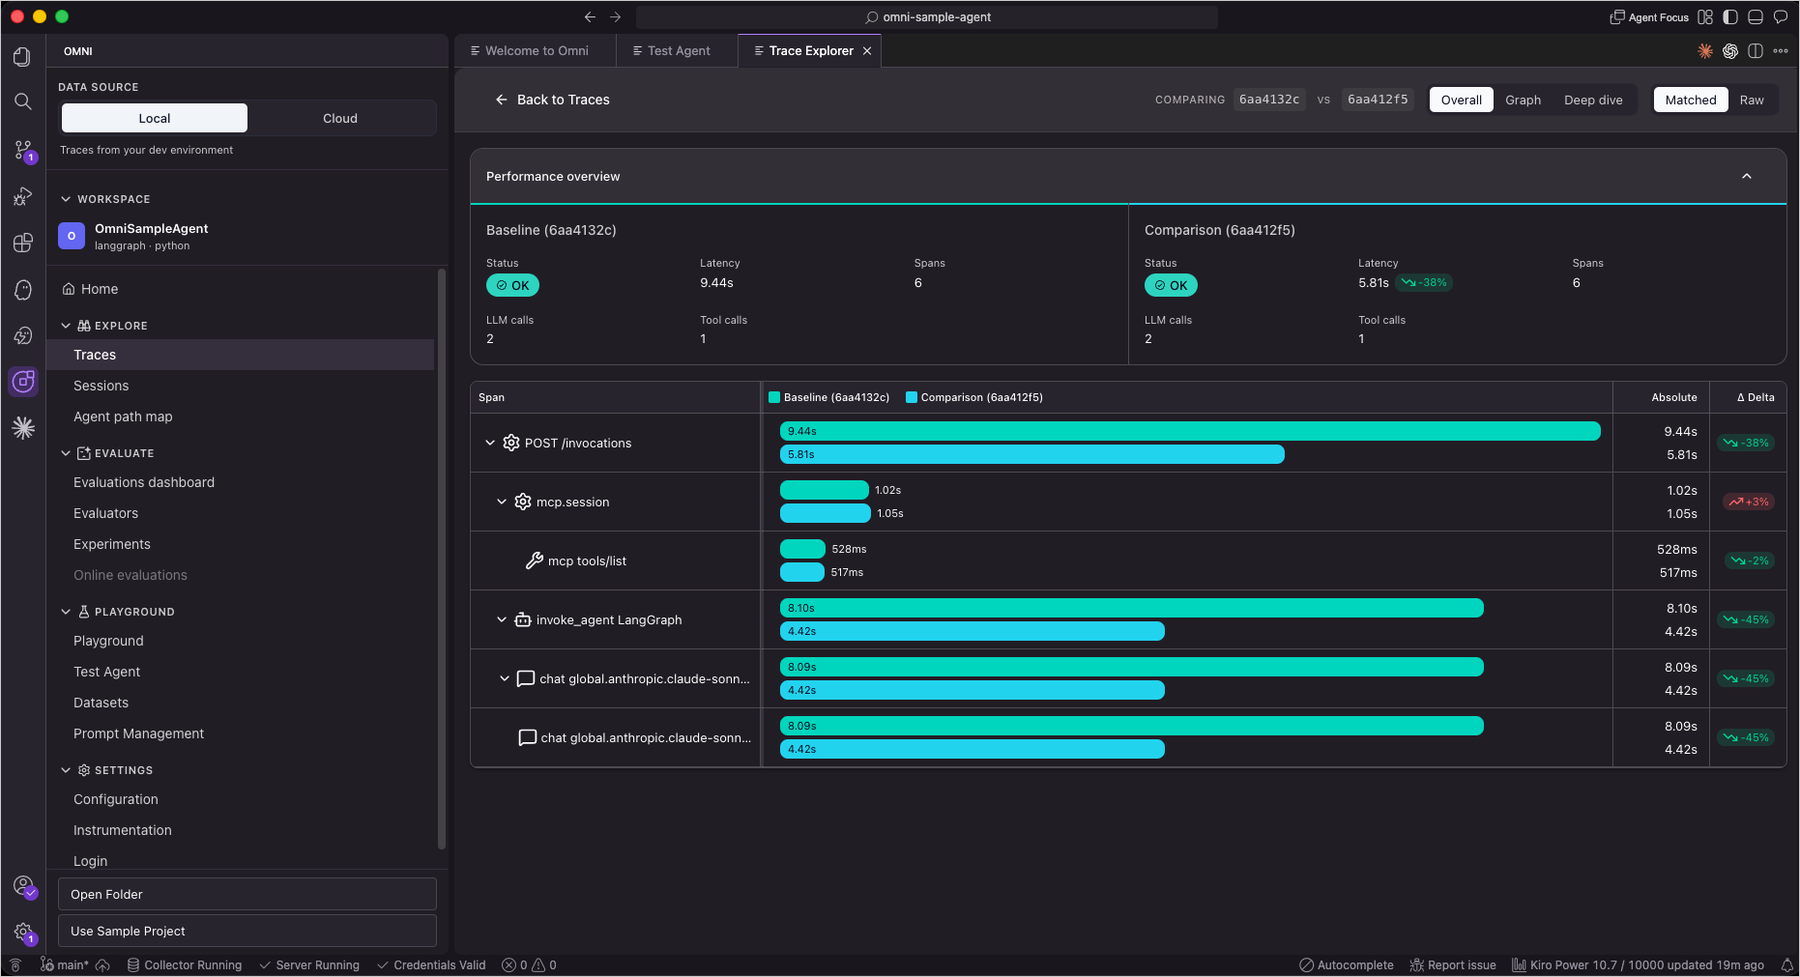
The Trace Explorer also supports Compare mode, which places two traces side by side to see how different prompts or configurations affect behavior. Compare mode is especially helpful when debugging regressions. And with Ask Assistant, an AI agent analyzes your traces to surface patterns and anomalies, answering questions like “Why did the agent call this tool twice?”

Comparing two traces side by side
Figure 5. Comparing two traces side by side

Evaluation is what turns observability into actionable quality improvement for generative AI. Traditional metrics like latency and error rate cannot tell you whether an agent’s response was helpful, coherent, or factually correct. Evaluators score each response against quality dimensions, letting you measure what users actually experience and catch regressions that standard monitoring misses entirely.

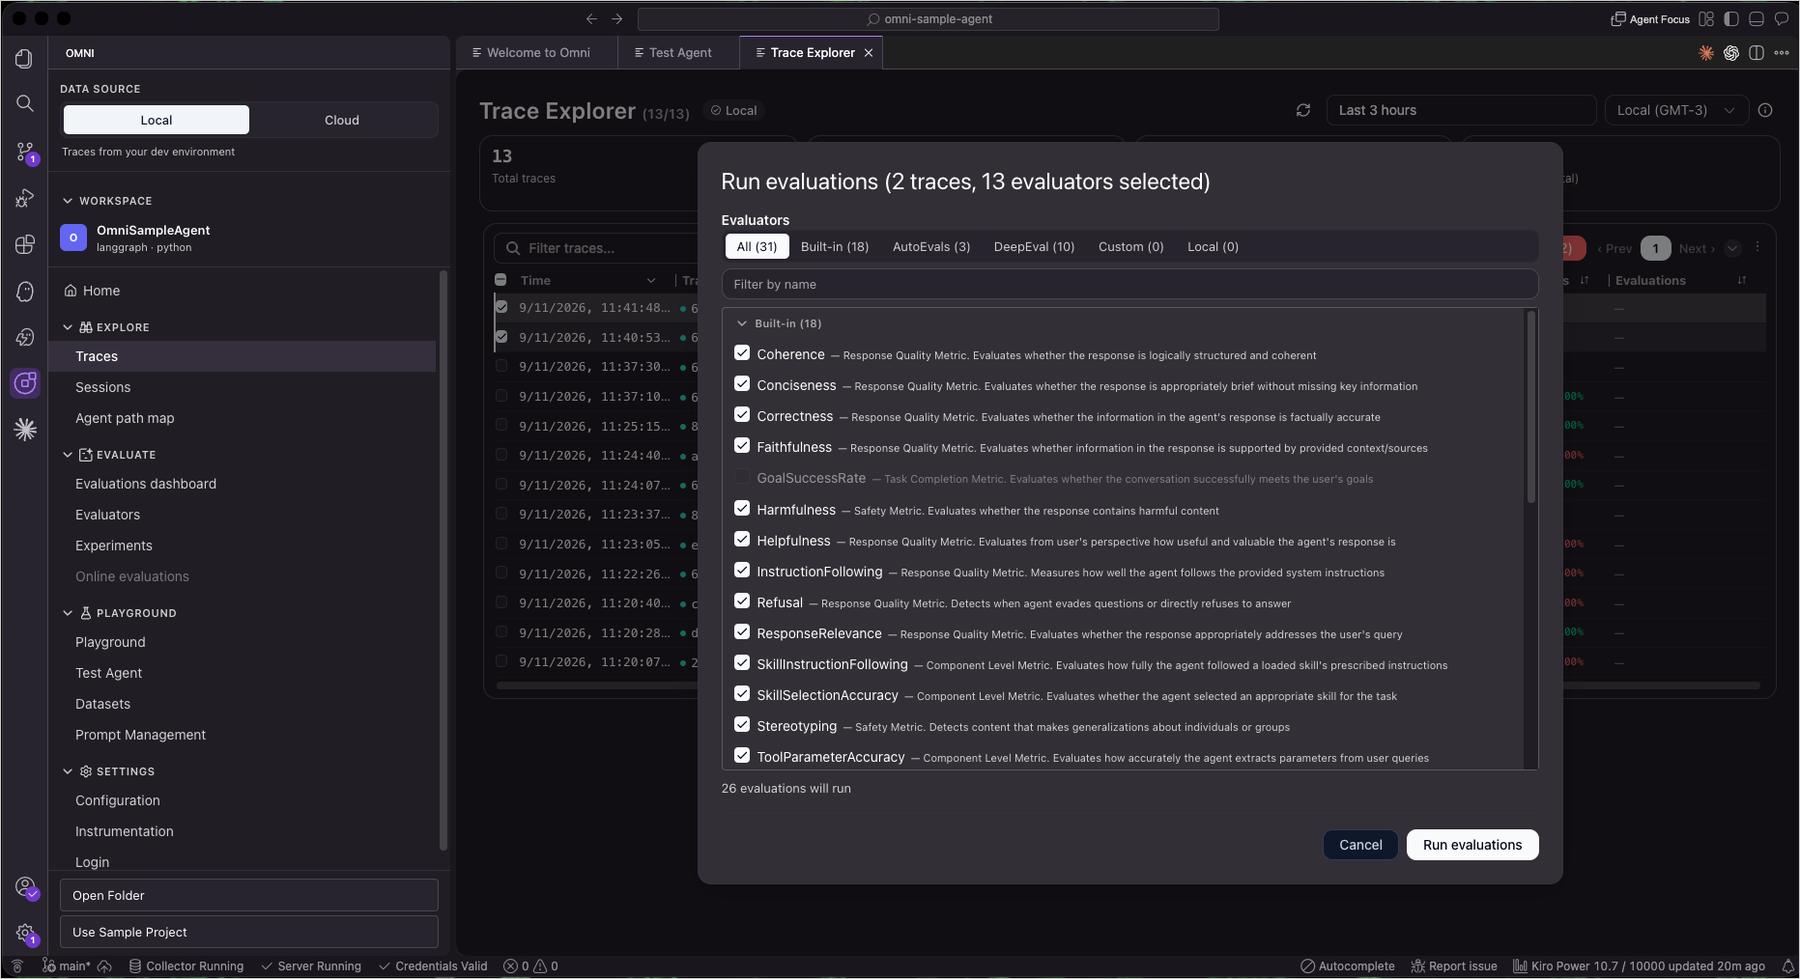
CloudWatch Omni includes 17 built-in evaluators for metrics like coherence, helpfulness, faithfulness, and routing correctness. I selected traces from the Trace Explorer, chose evaluators, and ran an evaluation, getting per-example scores and aggregate metrics without building any custom evaluation framework.

Running evaluations on traces
Figure 6. Running evaluations on traces

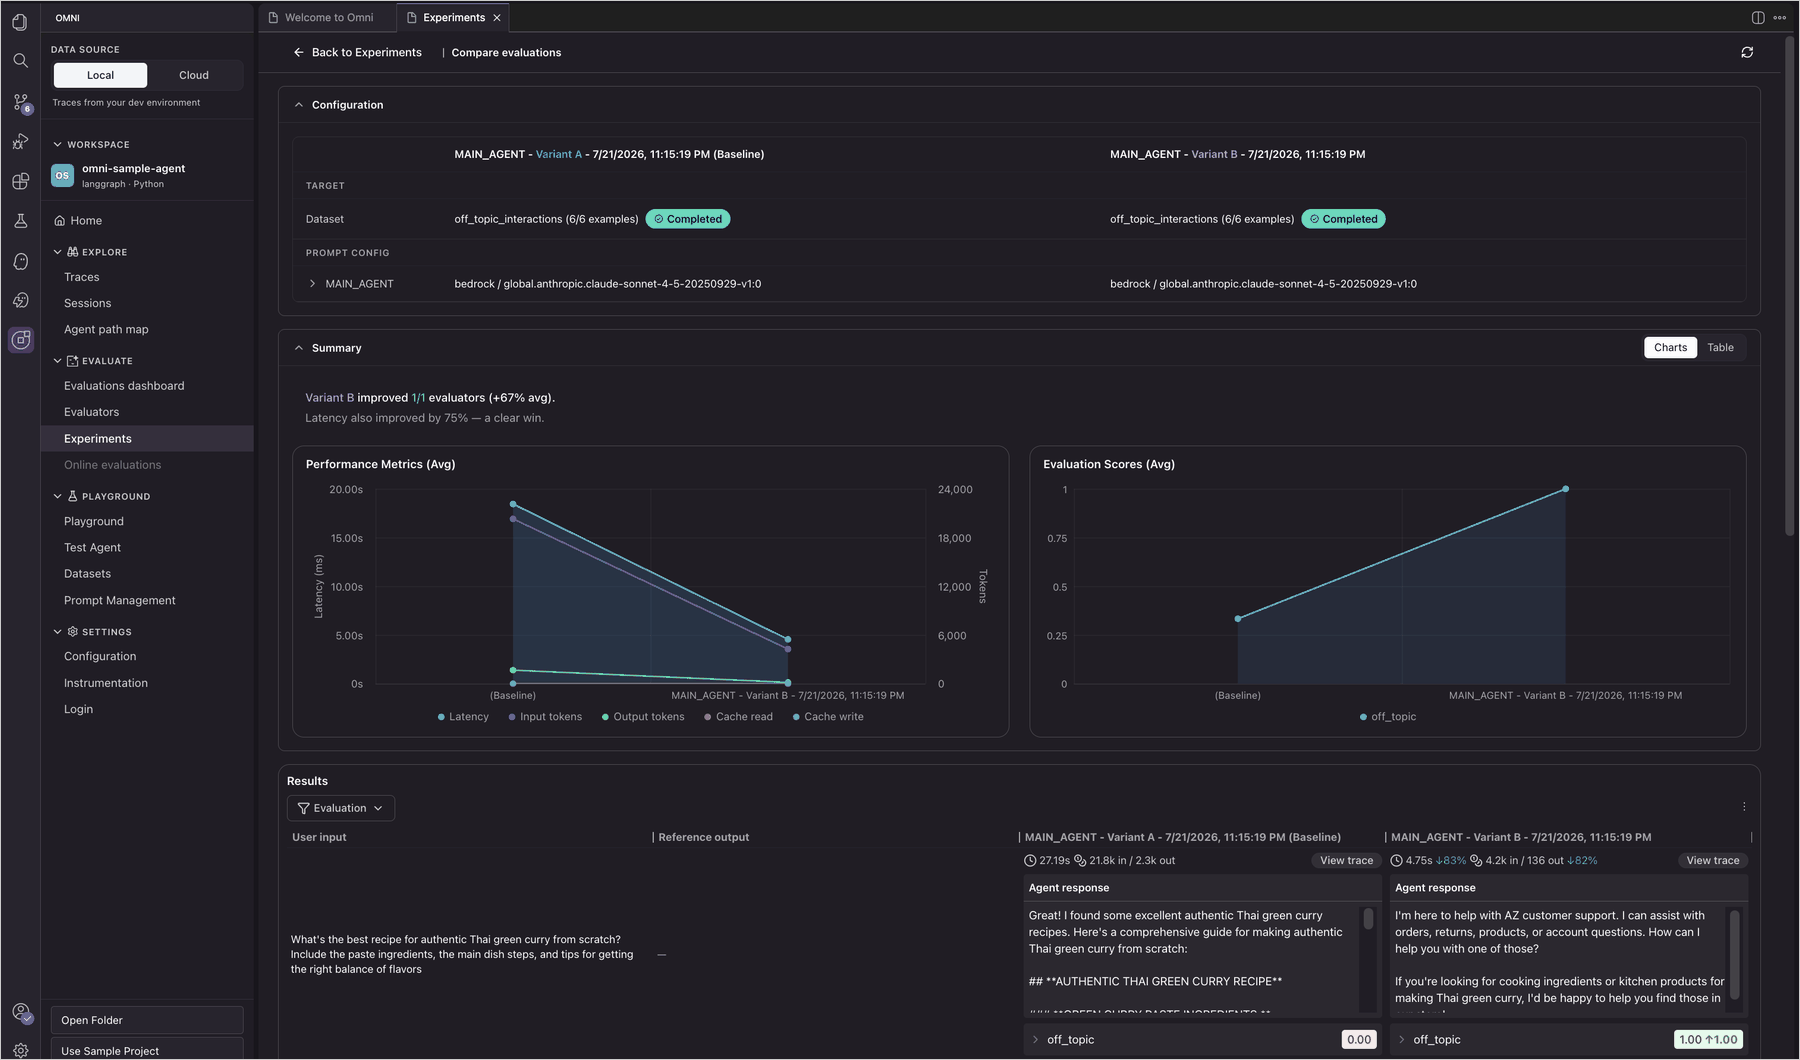
From there, I used the Playground to test different system prompts side by side, comparing multiple model and prompt configurations in real time to see how each variation affects output quality before committing changes. With the Experiments view, I could run the same dataset against two agent variants and compare their evaluation scores, latency, and token usage side by side to pick the best-performing configuration.

Figure 7. Comparing evaluations across agent variants in the Omni Experiments console

With Prompt Management, you can version and track prompt configurations over time, making it easy to roll back when a new version underperforms.

CloudWatch Omni also provides a Session Explorer to review full conversation histories and understand how agents handle multi-turn interactions, along with an Agent Topology view that visualizes the architecture of your agent system, including sub-agents, tools, and their interconnections. You can drill into any node to inspect performance and identify bottlenecks.

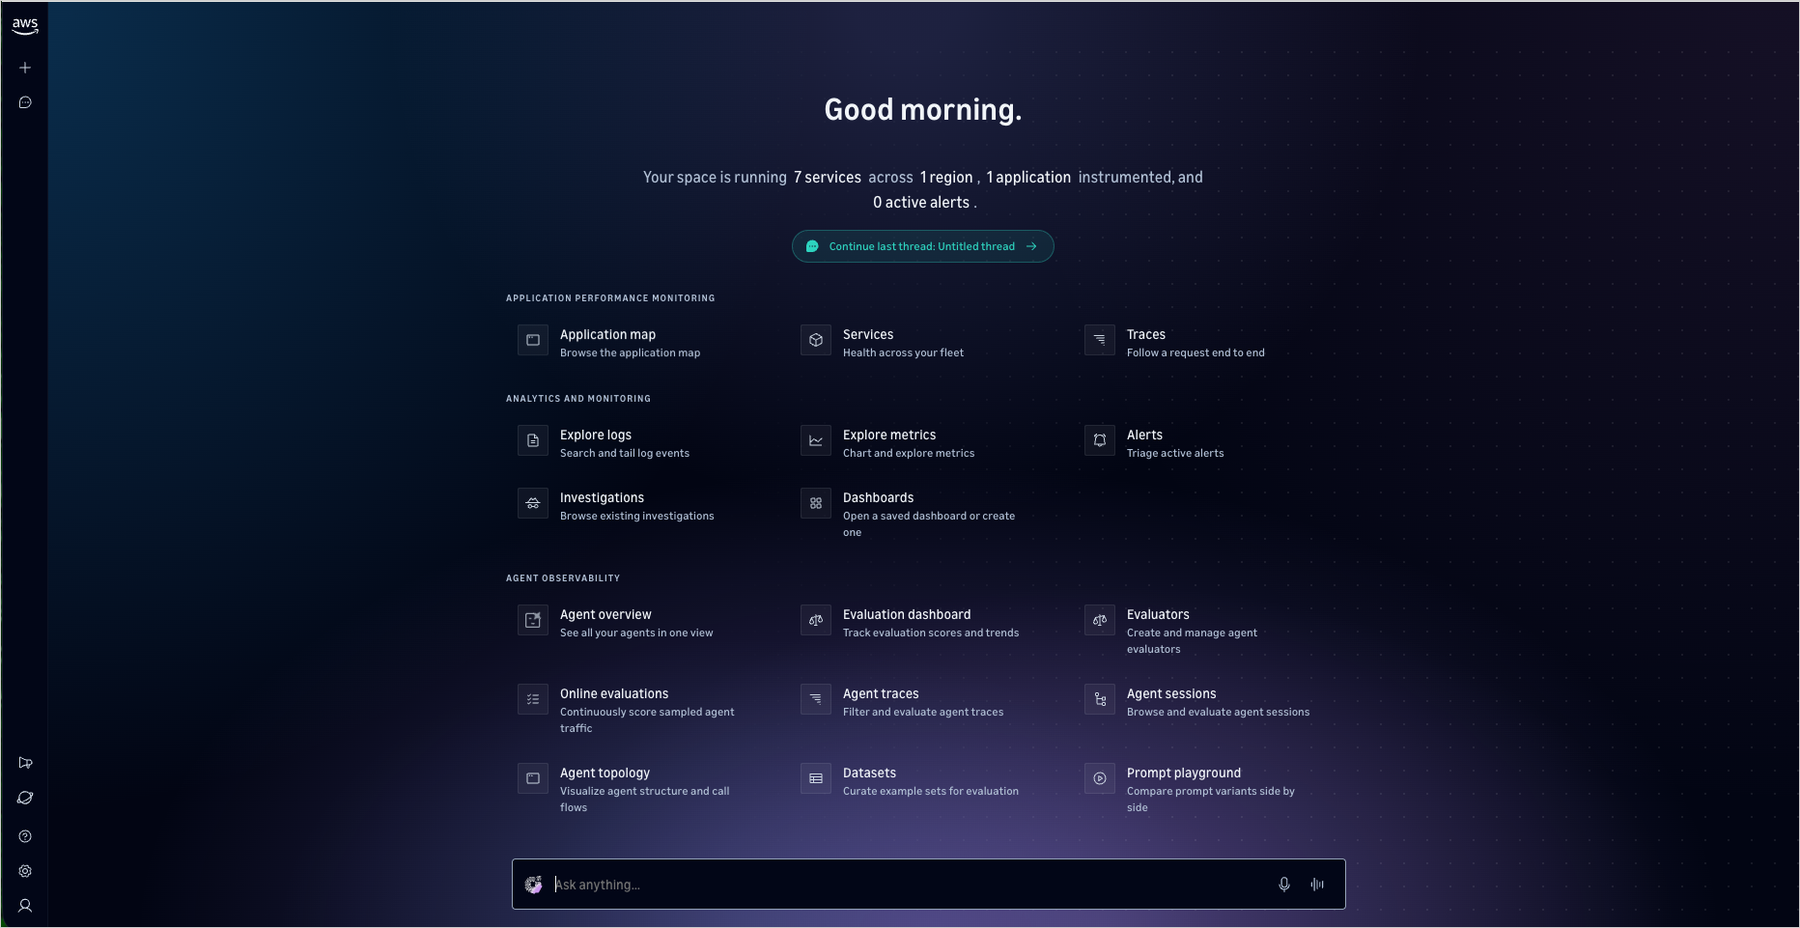
CloudWatch Omni also offers a dedicated web experience accessible from any browser without an IDE. Teams can access all capabilities collaboratively, including application monitoring, analytics, agent observability, and AI-powered investigations.

CloudWatch Omni web experience with application monitoring, analytics, and agent observability
Figure 8. CloudWatch Omni web experience with application monitoring, analytics, and agent observability

I curated traces into golden datasets for structured experimentation. The Experiment function runs the agent against a dataset and automatically scores results, creating benchmarks for regression testing whenever prompts or agent logic change.

If you already have an agent built with a supported framework, CloudWatch Omni provides two paths to add instrumentation: Auto-instrument with Kiro, which detects your framework and configures tracing automatically, or manual instrumentation with ready-to-use code snippets for Python and TypeScript. For detailed instrumentation guides, see the CloudWatch Omni documentation.

Supported frameworks and open standards
The walkthrough above uses the sample project, but CloudWatch Omni works with the agent frameworks teams are already using: LangChain, LangGraph, CrewAI, OpenAI SDK, Strands, Vercel AI SDK, and more, in both Python and TypeScript. It also provides native observability for agents built with Amazon Bedrock AgentCore, and uses AgentCore’s evaluation capabilities to assess agent quality directly within the Omni workflow.

Instrumentation uses open standards (OpenInference and ADOT), whether your agents run on Lambda, ECS, EKS, or other clouds. For evaluation, Omni integrates with third-party evaluators including AutoEval and DeepEval alongside built-in datasets, a playground, and batch experiments. No re-platforming required.

CloudWatch Omni brings agent observability and application observability together in a single experience. For the application observability experience, read the companion post Introducing Amazon CloudWatch Omni: collaborative AI-powered observability for your applications.

Pricing and availability
Amazon CloudWatch Omni is now generally available. The IDE extension is free to use. You don’t need an AWS account to get started. You only need AWS credentials for Amazon Bedrock models, or API keys for other providers like OpenAI or Anthropic. Get started today by installing the extension from the VS Code Marketplace.

To explore all capabilities and get started quickly, visit CloudWatch on AWS Builder Center.

If you want to call APIs, search documentation, find regional availability, and check troubleshooting about this feature, try using the AWS MCP Server and plugins with your preferred AI tool. Share your feedback on AWS re:Post or reach out through your usual AWS Support contacts.

Happy building!

— Daniel Abib

  •  

AWS Weekly Roundup: Price reduction of GPT models in Bedrock, CloudWatch managed collectors for Prometheus metrics, and more (August 3, 2026)

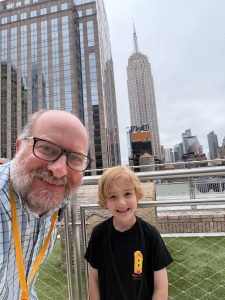
Last week I had the joy of participating in Amazon’s “Bring Your Kids to Work Day” with my 7 year old son. We commuted together into the New York City office, his first real rush hour train ride, and spent the day exploring how Amazon uses AI, machine learning, and robotics to deliver packages to customers all over the world. Watching his eyes light up as he saw robots navigating a fulfillment center reminded me why so many of us got into technology in the first place. There’s nothing quite like seeing that sense of wonder when something complex clicks.
That same energy carried into the week’s launches. We’ve got updates across AI pricing, observability, multicloud networking, and data management. Let’s dive in.

Headlines
Amazon Bedrock announces up to 80% lower prices for OpenAI GPT‑5.6 models – If you’re using OpenAI’s GPT‑5.6 family through Amazon Bedrock, your costs just dropped significantly. Effective July 30, on-demand inference prices for GPT‑5.6 Luna are reduced by 80%, while GPT‑5.6 Terra prices are reduced by 20%. Luna now costs $0.20 per million input tokens and $1.20 per million output tokens, making it one of the most affordable frontier-class models available. These price reductions apply automatically — no action required on your part. Read more

Last week’s launches
Here are some launches and updates from this past week that caught my attention:

  • Amazon CloudWatch announces managed Prometheus collectors – Amazon CloudWatch now supports collecting Prometheus metrics from your AWS infrastructure using fully managed collectors, enabling you to monitor Amazon EKS, Amazon EC2, Amazon ECS, Amazon MSK, and Amazon OpenSearch Service workloads without deploying or managing any agents. If you’ve been maintaining your own Prometheus scraping infrastructure, this removes a significant operational burden. Read more
  • AWS Interconnect — multicloud connectivity with Oracle Cloud Infrastructure is now generally available – AWS Interconnect is the first purpose-built multicloud connectivity product of its kind, allowing you to quickly provision resilient, scalable private connections between AWS and other cloud providers. With this GA launch for Oracle Cloud Infrastructure (OCI), you can establish private cross-cloud networking without traversing the public internet, making it easier to run multicloud architectures with the security and performance your workloads demand. Read more
  • AWS IAM Identity Center extends multi-Region support to Identity Center directory – You can now replicate IAM Identity Center from your primary AWS Region to additional Regions when using the Identity Center directory as your identity source. If IAM Identity Center is affected by a disruption in the primary Region, your users continue to have access to their AWS accounts using provisioned entitlements in additional Regions. This feature was previously available only for instances connected to external identity providers. Read more
  • Amazon S3 Tables now supports the Variant data type for Apache Iceberg V3 – Amazon S3 Tables adds support for the Variant data type, introduced in the Apache Iceberg V3 table format specification. Variant provides a high-performance, native solution for managing semi-structured data within your data lake — think IoT sensor data, application logs, and other schema-flexible payloads — without resorting to JSON blobs. Read more

Other AWS news
Here are some additional posts and resources that you might find interesting:

Upcoming AWS events
Check your calendar and sign up for upcoming AWS events:

  • AWS Summits – AWS Summits are free events that bring the cloud and AI community together to connect, learn, and explore the latest technologies. Browse the full calendar to find a Summit near you in the second half of 2026.
  • AWS Community Days – Community-led conferences where content is planned, sourced, and delivered by community leaders.

Join the AWS Builder Center to connect with builders, share solutions, and access content that supports your development. Browse here for upcoming AWS-led in-person and virtual events and developer-focused events.


That’s all for this week. Check back next Monday for another Weekly Roundup!

  •  

AWS Weekly Roundup: Claude Sonnet 5 on AWS, Amazon WorkSpaces for AI agents, AWS service availability updates, and more (July 6, 2026)

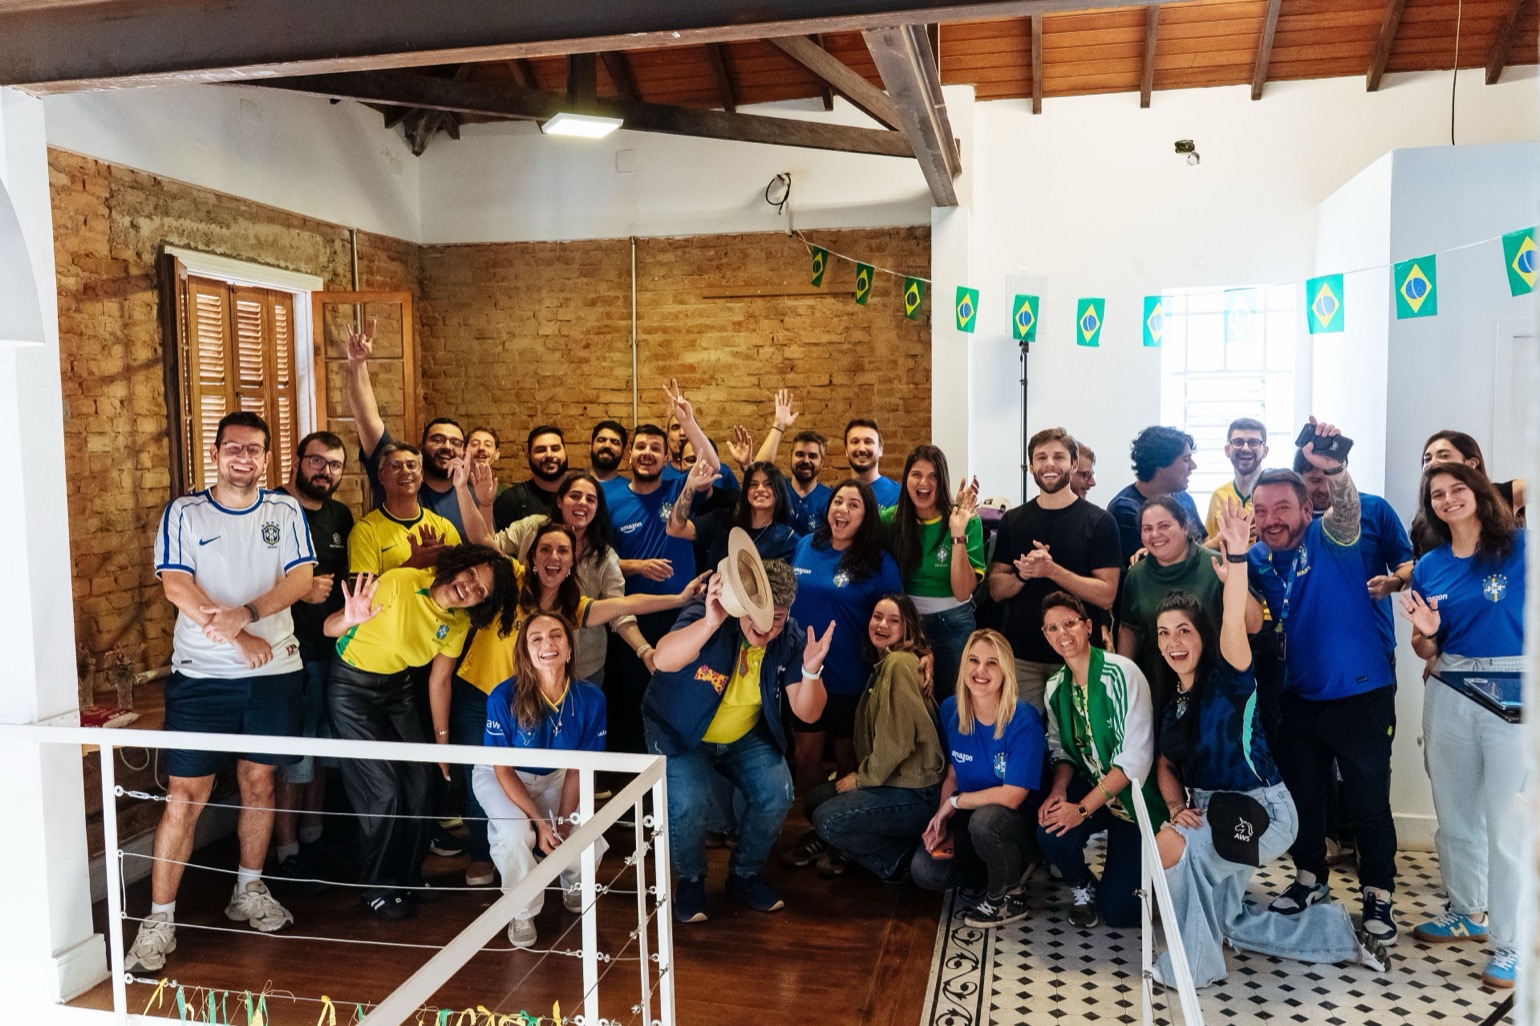
A couple of editions ago I wrote about what I find so energizing about working with startups. Last week I got a fresh dose of it: I spent a few days with the AWS Startups team, listening to stories of founders talking about the problems they’re actually solving. One story that stayed with me came from Marco Negreiros, founder of EyeCare Health, a Brazilian healthtech expanding access to eye care. He shared a striking fact: more than 70% of Brazilian municipalities don’t have a single ophthalmologist. His answer was to put a vision test on the one device almost everyone already carries, the smartphone, so a basic eye screening no longer depends on living near a clinic. Watching a founder turn a gap that big into something that concrete is exactly why I love this space.

AWS Startups team get-together with founders in Brazil

This week, I’ll take a closer look at some key launches, and then cover the quarterly AWS Service Availability updates.

Last week’s launches
Here are some of the launches covered from this past week in the AWS News Blog:

Here are some launches and updates that caught my attention:

For a full list of AWS announcements, be sure to keep an eye on the What’s New with AWS page.

AWS Service Availability Updates
When the availability of an AWS service or feature changes, we provide customers guidance in AWS Product Lifecycle Changes on available alternatives and support for migration so that disruptions to your operations are minimized. The following lifecycle changes were updated on June 30, 2026.

Services moving to Maintenance (no longer accessible to new customers starting July 30, 2026):

Services entering Sunset:

Services reaching End of Support (as of June 30, 2026):

  • Amazon Chime SDK – Carrier Voice Focus
  • Amazon SageMaker AI – Ground Truth Plus

We understand that changes in availability can impact your operations. For specific guidance, consult the relevant service documentation or contact AWS Support.

Upcoming AWS events
Check your calendar and sign up for upcoming AWS events:

  • AWS Summits – AWS Summits are free events that bring the cloud and AI community together to connect, learn, and explore the latest technologies. Browse the full calendar to find a Summit near you in the second half of 2026.
  • AWS Community Days – Community-led conferences where content is planned, sourced, and delivered by community leaders. If you’re in Latin America, don’t miss AWS Community Day Belo Horizonte on August 22. Registration is open at awscommunityday.com.br.

Join the AWS Builder Center to connect with builders, share solutions, and access content that supports your development. Browse here for upcoming AWS-led in-person and virtual events and developer-focused events.

That’s all for this week. Check back next Monday for another Weekly Roundup!

– Daniel Abib

This post is part of our Weekly Roundup series. Check back each week for a quick roundup of interesting news and announcements from AWS!

  •